Mapping the genetic basis of diabetes mellitus in the Australian Burmese cat (Felis catus) - Nature
←
→
Page content transcription
If your browser does not render page correctly, please read the page content below
www.nature.com/scientificreports
OPEN Mapping the genetic
basis of diabetes mellitus
in the Australian Burmese cat (Felis
catus)
Georgina Samaha1*, Claire M. Wade2, Julia Beatty1,3, Leslie A. Lyons4, Linda M. Fleeman5 &
Bianca Haase1
Diabetes mellitus, a common endocrinopathy affecting domestic cats, shares many clinical and
pathologic features with type 2 diabetes in humans. In Australia and Europe, diabetes mellitus is
almost four times more common among Burmese cats than in other breeds. As a genetically isolated
population, the diabetic Australian Burmese cat provides a spontaneous genetic model for studying
diabetes mellitus in humans. Studying complex diseases in pedigreed breeds facilitates tighter control
of confounding factors including population stratification, allelic frequencies and environmental
heterogeneity. We used the feline SNV array and whole genome sequence data to undertake a
genome wide-association study and runs of homozygosity analysis, of a case–control cohort of
Australian and European Burmese cats. Our results identified diabetes-associated haplotypes across
chromosomes A3, B1 and E1 and selective sweeps across the Burmese breed on chromosomes B1,
B3, D1 and D4. The locus on chromosome B1, common to both analyses, revealed coding and splice
region variants in candidate genes, ANK1, EPHX2 and LOXL2, implicated in diabetes mellitus and lipid
dysregulation. Mapping this condition in Burmese cats has revealed a polygenic spectrum, implicating
loci linked to pancreatic beta cell dysfunction, lipid dysregulation and insulin resistance in the
pathogenesis of diabetes mellitus in the Burmese cat.
Domestic cats (Felis catus), a common household pet share with humans many environmental and lifestyle risk
factors for metabolic disorders like diabetes mellitus. Feline diabetes mellitus (FDM; OMIA 000277-9685) affects
approximately one in 200 cats. Similarities in clinical presentation, pathological findings and risk factors between
FDM and human type 2 diabetes (T2D) are well-established1–4. Both are characterised by inadequate insulin
secretion resulting in absolute or partial insulin deficiency and varying degrees of insulin resistance in peripheral
tissues. The prevalence of FDM has been increasing over recent decades, with obesity, diet, over-nutrition and
lack of physical inactivity all implicated as risk factors5,6. In humans, T2D is known to have a complex underly-
ing genetic architecture, with many genetic risk loci identified by genome wide association studies (GWAS).
Such studies have consistently identified T2D associated loci containing genes that alter glucose metabolism or
pancreatic β-cell f unction7,8.
Among recognised cat breeds, the incidence of FDM is highest in Burmese c ats9,10. In Australia, Britain and
Europe, Burmese cats are approximately four times more likely to develop FDM than domestic cats of other
breeds or breed mixes11. In contrast, the same heightened risk has not been observed in the North American
Burmese population which is regarded as genetically distinct12–14. Companion animals are increasingly used to
model human d iseases15,16. Studying the basis of diabetes mellitus in the naturally occurring Burmese model
circumvents the drawbacks associated with in vivo experimental work involving induced illness in healthy
animals and transgenic animals. This includes welfare and the inability to adequately model the disease state17.
Compared with humans, the relatively short lifespan of cats permits observation of the natural progression of
an illness over a compressed timeline.
1
Faculty of Science, Sydney School of Veterinary Science, University of Sydney, Sydney, NSW, Australia. 2School
of Life and Environmental Sciences, The University of Sydney, Sydney, NSW, Australia. 3Department of Infectious
Diseases and Public Health, City University of Hong Kong, Kowloon, Hong Kong SAR, People’s Republic of
China. 4Department of Veterinary Medicine and Surgery, College of Veterinary Medicine, University of Missouri,
Columbia, MO, USA. 5Animal Diabetes Australia, Melbourne, VIC, Australia. *email: georgina.samaha@
sydney.edu.au
Scientific Reports | (2020) 10:19194 | https://doi.org/10.1038/s41598-020-76166-3 1
Vol.:(0123456789)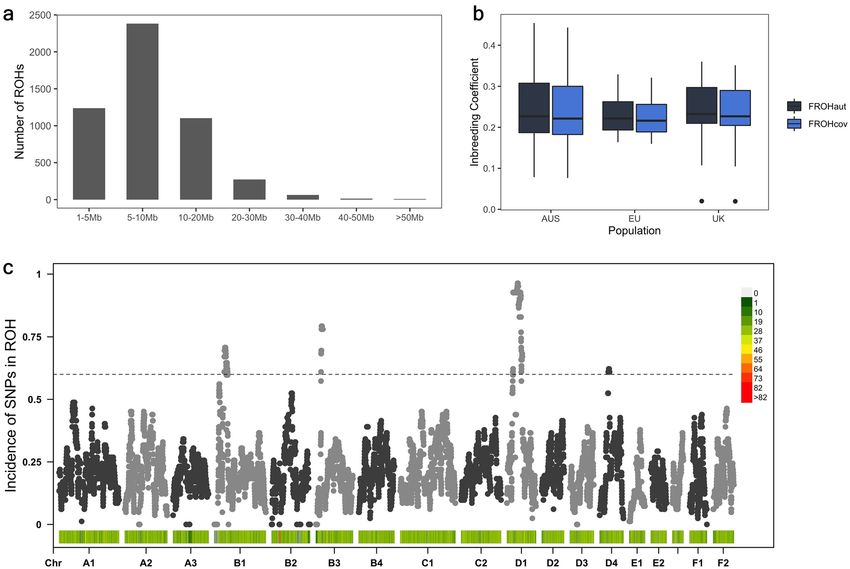
www.nature.com/scientificreports/
Breed-specific phenotypes in cats result from selective breeding for desired characteristics such as coat colour
and texture, body size and morphology. Breed-specific traits are often accompanied by breed-specific suscep-
tibility to genetic diseases compared with outbred populations. Heritable diseases disproportionately affecting
Burmese cats include craniofacial defect18, hypokalaemia19, hyperlipidaemia20, orofacial pain syndrome21 and
diabetes22. Regarding genetic diversity, the Burmese breed has among the lowest levels of heterozygosity, most
extensive linkage disequilibrium (LD) and highest inbreeding coefficients in recognised cat b reeds14,23. This
simplified genetic architecture is beneficial for mapping the genetic basis of breed-specific traits. Extensive LD
reduces the number of markers required to tag segregating haplotypes23,24, making Burmese suitable for analysis
on the Illumina Infinium iSelect 63 k Cat DNA genotyping array that is used in this study.
The closed breeding systems used to maintain pedigreed breed lines leave distinct genomic traces, particularly
when population bottlenecks, such as the importation of individuals to new countries, create founder effects. The
extent and structure of LD varies widely across chromosomes and regions of long-range LD can indicate partial
or complete selective sweeps of functional significance in a population. Across species, the process of intensive
selection for breed-specific traits influences the frequency, distribution and length of runs of homozygosity
(ROH)25. ROH exist as long tracts of homozygous genotypes and are often the result of consanguineous mat-
echanisms25–27. Detecting ROH can identify genes that have been subjected
ings, but they can arise by other m
to selection in population genetic analyses28,29. For example, ROH detection has been used to map causative
recessive variants segregating within human families and canine breeds in complex and Mendelian d iseases30–33.
Enrichment of deleterious variants surrounding regions of selection in domesticated breeds suggest deleterious
alleles may ‘hitchhike’ with nearby positively selected alleles, supporting a link between disease heritability and
breed-specific traits33–35.
The unique demographic history of the Burmese breed is characterised by reduced effective population
sizes, potential founder effects and genetic bottlenecks that may account for differential enrichment of FDM
between different breeding populations. In a population with an already reduced genetic diversity, we predict
GWAS and ROH analyses offer an opportunity to detect FDM-risk loci segregating in the Australian Burmese
breeding population. We used genotyping array and whole genome sequence data to, (1) conduct case–control
GWAS of diabetic and non-diabetic Burmese cats, (2) Identify FDM-associated risk haplotypes and (3) perform
genome-wide characterisation of Burmese ROH to expose risk loci that differentiate the heightened prevalence
of FDM in this breed.
Results
Remapping array variants to feline 9.0 genome assembly. As inconsistencies between genome
assemblies can complicate GWAS, the SNV locations of array variants were updated to the most recent feline
reference assembly (felCat9). Original locations were included in a manifest provided with the Illumina iSelect
63 Cat DNA genotyping array. For the 62,897 variants on the feline genotyping array, 61,371 (97.6%) were
remapped. This comprised 58,674 autosomal variants and 2697 markers on chromosome X. The marker counts
and statistics per chromosome (Table S1a) and the updated map file (Table S1b) are presented in Supplementary
data. The largest gap between consecutive markers spanned 82.3 Mb and was detected on chromosome E1. The
average distance between markers was 39.7 kb. As expected, gaps and low-density distributions of SNVs were
consistently observed flanking centromeres for each chromosome.
Genome‑wide and haplotype association analyses. Samples from eighty-two Burmese cats that were
genotyped on the Illumina Infinium Feline 63 k iSelect DNA array passed quality control. Multidimensional scal-
ing (MDS) revealed some geographical clustering of cat populations (Fig. 1a). Cats from Europe (EU) clustered
distinctly from Australian (AUS) and British (UK) samples. Given geographical clustering of cases, the GWAS
was first run in Australian cats only to control for population stratification (analysis 1). Analysis 1 comprised of
22 cases and 20 controls, Cases and controls within the cohort of samples used in the initial case–control GWAS
(analysis 1) which were evenly dispersed across the population cohort (herein referred to as the ‘Australian clus-
ter’) (Fig. 1b). For analysis 1, the QQ-plot revealed a deviation from the expected P-value distribution only in
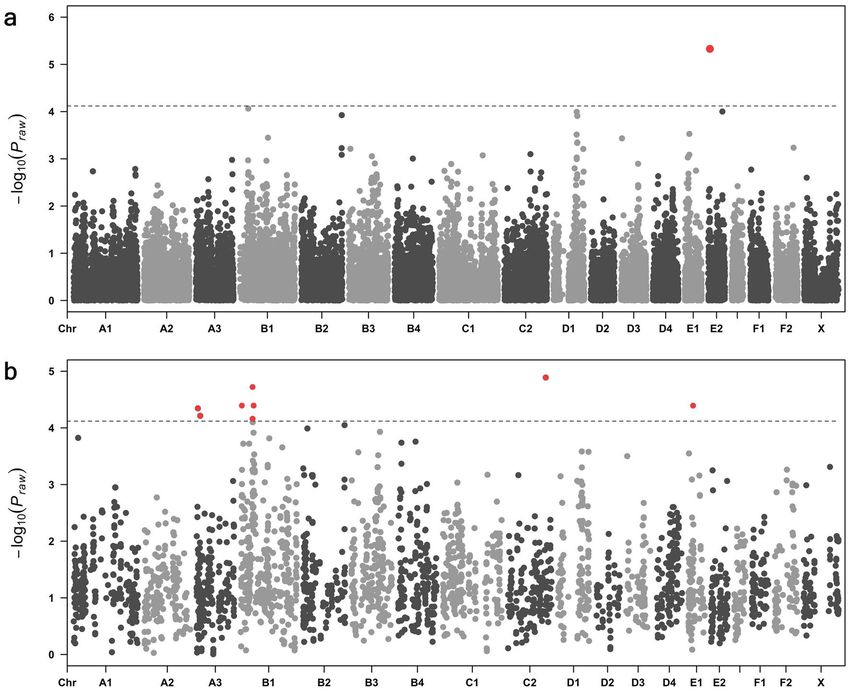
the tail (λ = 1.03) (Fig. 1c). This analysis totalled 30,212 SNVs and one marker at E2:6,883,182 ( Praw = 4.68 × 10⁻⁶)
passed the empirical genome-wide significance threshold (Fig. 2a).
The 3021 SNVs that comprised the top 10% associated signals from analysis 1 were run in an expanded cohort
of Australian, European and British Burmese cats (22 cases, 60 controls) (analysis 2). SNVs passing genome-wide
significance from analysis 2 were observed on chromosomes A3, B1, C2 and E1 (Fig. 2b). The most significantly
associated marker from analysis 2 was C2: 139,466,787 ( Pgenome = 1.26 × 10⁻⁵). This SNV was found not to be in
LD with any surrounding markers and was excluded from further analysis. Additional SNVs passing genome-
wide significance on chromosomes A3, B1 and E1 were observed within intronic regions of Guanine nucleotide-
binding protein G subunit (GNAS) (A3:4,665,802; Pgenome = 4.44 × 10−05), Growth regulating oestrogen receptor
binding 1 (GREB1) (A3:134,518,080; Pgenome = 6.13 × 10−05), Zinc finger matrin-type 4 (ZMAT4) (B1:44,235,566;
Pgenome = 6.85 × 10−05) and EF-hand calcium binding domain 5 (EFCAB5) (E1:16,917,823; Pgenome = 4.02 × 10−05)
genes.
Five regions of association on chromosomes A3, B1 and E1 were defined based on LD clumping with r2 > 0.8
to the top regional SNV and used to identify FDM-associated haplotypes within each of these clumps (Table 1).
The highest associated haplotype spanned the interval chrA3:134,425,431–134,601,739 bp. This region spanned
genes; Lipin-1 (LPIN1), Neurotensin receptor 2 (NTSR2) and GREB1 and harboured a SNV within GREB1
(P = 4.33 × 10−06) unique to cases.
The second highest associated haplotype spanned the interval chrB1:48,056,021–48,848,288 bp
(P = 4.69 × 10−06) and was present in 27.3% of cases and 3.3% of controls. Across this region, seven synonymous
Scientific Reports | (2020) 10:19194 | https://doi.org/10.1038/s41598-020-76166-3 2
Vol:.(1234567890)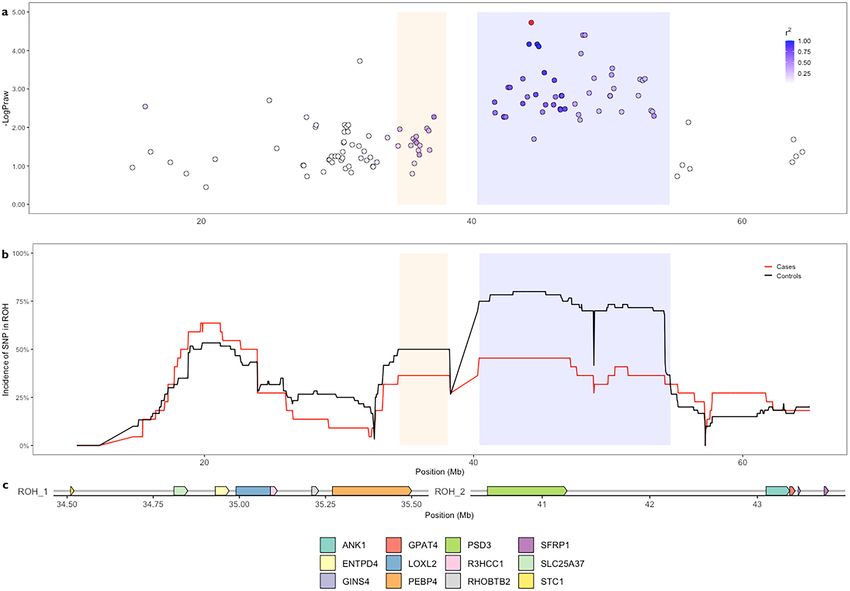
www.nature.com/scientificreports/

                                  Figure 1.  Multi-dimensional scaling and quantile–quantile plot of diabetic and non-diabetic Burmese cats. (a)
                                  Multi-dimensional scaling distribution of Burmese cats of Australian, British and European (HK) provenance
                                  in two dimensions. Samples included within the Australian cluster (circled) were included in the initial case–
                                  control association analysis. (b) Multi-dimensional scaling distribution of diabetic and non-diabetic Burmese
                                  cats in the Australian cluster shown in two dimensions (c) Quantile–quantile plot showing limited inflation of
                                  the test statistics with a genomic inflation factor (λ = 1.03).

                                  Figure 2.  Case–control genome wide association analysis performed in two stages in the Burmese breed. (a)
                                  Manhattan plot summarising initial analysis of 20 cases and 22 controls in the Australian cluster shows a marker
                                  on chromosome E1 b. The top 10% of markers (3022 SNVs) run in the initial association analysis were run in an
                                  expanded association analysis of 82 Burmese cats of Australian, European and British provenance, comprising
                                  22 cases and 60 controls. Signals that maintained or increased their significance above the empirical genome-
                                  wise significance threshold (P < 7.6 × 10⁻⁵) are highlighted in red. Loci passing this threshold were observed on
                                  chromosomes A3, B1 and E1.

Scientific Reports |   (2020) 10:19194 |              https://doi.org/10.1038/s41598-020-76166-3                                                   3

                                                                                                                                            Vol.:(0123456789)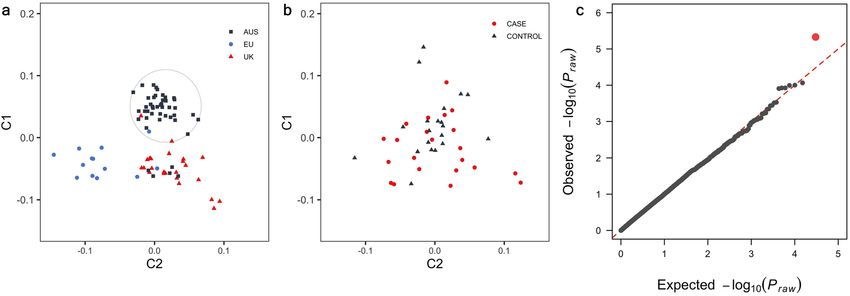
www.nature.com/scientificreports/
Chr Position P Allele Haplotype block Size (kb) Associated haplotype Case:control freq Haplotype P Genes
ATP5F1E TUBB1
4,665,802 4.44E−05 C 4,396,199–4,741,413 345 GGCG 0.232:0.042 0.0372
A3 PRELID3B NELFCD GNAS
134,518,080 6.13E−05 A 134,425,431–134,601,739 176 GAAG 0.168:0 7.00E−04 LPIN1 NTSR2 GREB1
AGGAGAGAGAGCGAA ANK1 GINS4 GPAT4
44,398,531 1.88E−05 C 43,116,211–44,435,725 1319 0.182:0.017 2.50E−04
GGGCA SFRP1 ZMAT4
B1
AAAGGGCAAGAA
48,213,950 3.98E−05 A 48,056,021–48,848,288 792 0.273:0.033 4.69E−06 UNC5D
CGAGA
TMIGD1 BLMH SLC6A4
E1 16,917,823 4.02E−05 A 16,577,377–17,262,839 685 GGGGGCAAGAGGAA 0.636:0.898 0.0052
NSRP1 EFCAB5 SSH2
Table 1. LD clumping and haplotype analysis of association signals from analysis 2 identified risk haplotypes
on chromosomes A3, B1 and E1 across 82 Burmese cats.
Chromosome Position (gDNA) Sequence change (cDNA) Variant id Gene Consequence Location
g.4531693 c.1803G > A – CTSZ Synonymous Exon 5
g.4538198 c.811C > T – NELFCD Synonymous Exon 7
A3 g.4538472 c.751C > T rs783705891 NELFCD Synonymous Exon 6
g.4678284 c.528A > G – NESP55 Synonymous Exon 1
g.4678485 c.729G > A – NESP55 Synonymous Exon 1
g.35028512 c.474G > A – LOXL2 Missense Exon 2
g.35028658 c.620C > T – LOXL2 Synonymous Exon 2
g.35028712 c.674G > A – LOXL2 Synonymous Exon 2
g.35028781 c.743C > T – LOXL2 Synonymous Exon 2
B1 g.35274559 c.136G > A – PEBP4 Missense Exon 1
g.43228852 c.768C > T – ANK1 Synonymous Exon 5
g.43227755C > T - – ANK1 Splice region Intron 4
g.43235911C > T - – ANK1 Splice region Intron 9
g.48700205 c.1176G > A rs783910583 UNC5D Synonymous Exon 10
Table 2. Coding variants matching FDM-risk haplotypes across GWAS loci on chromosomes A3 and B1 and
variants segregating in cases across both ROH on B1.
and splice region variants in Cathepsin Z (CTSZ), Negative elongation factor CD (NELFCD), Neuroendocrine
secretory protein 55 (NESP55), Ankyrin 1 (ANK1) and UNC-5 netrin receptor (UNC5D) (Table 2), 708 intronic,
two splice region variants, two 5′ UTR variants in GPAT4 and GINS4 and seven 3′ UTR variants in CTSZ and
NELFCD matched risk haplotypes across the five FDM-associated haplotype blocks (Table S3). Most notably,
variants matching the FDM-risk haplotype on B1 were identified in common T2D candidate gene, ANK1. Of
WGS samples, two cases were heterozygous for both ANK1 splice variants, all other individuals were homozygous
for the reference allele. SNV, g.43227755C > T, was located within 5 bp of the region of a constitutive donor splice
site at the start of intron 4 and g.43235911C > T was located 2 bp upstream of a constitutive acceptor splice site
at the end of intron 9.
Runs of homozygosity. The total number of SNVs included in ROH analysis was 52,933. A total of 5079
ROH were identified across all individuals. The distribution of sizes of ROH was consistent across populations.
Most of the observed ROH were less than 20 Mb in size, with 46.9%, 48.1% and 46.5% being observed between
5 and 10 Mb in size (Fig. 3a). Limited by the distribution and density of SNVs on the feline genotyping array,
no ROH < 1 Mb were detected. Australian samples displayed larger spans of ROH, with two samples displaying
a total length of ROH greater than 750 Mb. These two samples displayed the highest inbreeding coefficients. No
correlation was observed between case–control status and the total length of ROH, number of ROH or extent
of inbreeding in Burmese cats. Inbreeding coefficient measures F ROHcov and F ROHaut across all samples were
highly correlated (Fig. 3b; r = 1.0; P < 2.26 × 10⁻¹⁶). While FROHaut is the more commonly reported inbreeding
coefficient statistic, FROHcov allows maximal possible genome coverage. Hence, we have reported both here.
FROHaut and FROHcov reported an inbreeding coefficient ~ 0.24 across all samples. Inbreeding (FROHcov) was
consistent among Australian (FROHcov = 0.25), UK (FROHcov = 0.23) and EU (FROHcov = 0.22) populations
(Fig. 3b).
Genomic regions containing the most common ROH across all samples were identified across all auto-
somes (Fig. 3c). ROH on chromosomes B1, B3, D1 and D4 revealed regions potentially under selection in
the breed, with both ROH on chromosome B1 containing FDM-risk variants (Table 2). ROH spanning
chrB3:20,948,939–28,536,357 contained 22 genes, none of which are associated with known feline phenotypes.
This ROH was observed in > 75% of samples and was syntenic with a region of human chromosome 15, previously
Scientific Reports | (2020) 10:19194 | https://doi.org/10.1038/s41598-020-76166-3 4
Vol:.(1234567890)www.nature.com/scientificreports/
Figure 3. ROH analyses on 82 Burmese samples of Australian, British and European provenance. (a) Most
ROH were found in the size ranges 1–20 Mb across all individuals. (b) Inbreeding coefficient measurements
were equivalent across all populations. c. Autosomal distribution of the incidence of SNVs in ROH measured
across all samples.
implicated in Prader Willi syndrome (PWS) (OMIM 176270) and oculocutaneous albinism (OMIM 203200).
FDM-risk variants were found to segregate in Non-Imprinted gene in Prader-Willi syndrome/Angelman syn-
drome (NIPA1; OMIM:608145) and Gamma-aminobutyric Acid Receptor, Gamma-3 (GABRG3; OMIM:600233).
An ROH spanning chrD1:37,995,037–57,240,116 upstream of the FDM-associated locus was observed
in > 90% of all Burmese cats. This locus contained the Tyrosinase (TYR) gene that has been previously Intronic
risk variants in glutamate receptor, metabotropic 5 (GRM5), Dexamethosone-induced gene-2 (DIG2) and
Myosin VIIA (MYO7A) gene were found across WGS samples. The FDM locus with indicative association
on chromosome D1 was 40 Mb upstream of the ROH spanning chrD1:37,995,037–57,240,116. The ROH on
chrD4:34,892,052–40,360,453, observed in 62% of Burmese samples, spanned the Tyrosinase-related protein 1
(TYRP1) gene, implicated in brown coat colour in cats (OMIA 001249-9685). Intronic risk variants in protein
tyrosine phosphate receptor delta (PTPRD) were detected in WGS samples.
Two ROH flanking the centromere on chromosome B1 were detected across all populations. Both were
syntenic to a region on human chromosome 8 and overlapped the putative ticked coat phenotype locus in cats
(OMIA 001484-9685). The first spanned chrB1:34,395,302–38,202,712 at a lower incidence (0.49) than the sec-
ond, chrB1:40,408,022–54,187,390 bp (0.69). Missense and synonymous risk variants in Lysyl Oxidase homolog
2 (LOXL2) and Phosphatidylethanolamine-Binding Protein 4 (PEBP4) genes segregated in FDM-cases (Table 2).
SNVs within the chrB1:34,395,302–38,202,712 bp ROH were in moderate LD ( r2 = 0.5) to the highest associated
SNV in the chrB1:40,408,022–54,187,390 bp ROH (Fig. 4a). ChrB1:40,408,022–54,187,390 overlapped the most
significant region of FDM-association identified in analysis 2 (Fig. 4b) and was observed in 80% of controls and
49% in cases and contained 65 genes. FDM-risk variants segregating in cases could not be detected as only one
diabetic WGS sample had the chrB1:40408022-54187390 ROH. A homozygous missense variant (c.163A > G)
in exon 1 of Epoxide hydrolase 2 (EPHX2) was fixed across all WGS samples. Annotated FDM-risk variants
discovered across ROH are presented in table S4.
Discussion
We sought to identify novel genetic loci associated with FDM in the Australian Burmese population. GWAS
exploits the non-random coinheritance of genetic variants (LD) to assay thousands of markers for an association
with any phenotypic trait. The Burmese breed is characterised by a low fraction of GWAS-informative SNVs on
the 63 K array, and only 49% of the available array markers were included in our analysis. However, the low allele
frequency spectrum used in array-based association analyses, coupled with the genetic profile of this breed limits
Scientific Reports | (2020) 10:19194 | https://doi.org/10.1038/s41598-020-76166-3 5
Vol.:(0123456789)www.nature.com/scientificreports/
Figure 4. Overlapping FDM associated loci on chromosome B1 was identified in both ROH and GWAS
analyses. (a) The distribution of SNVs flanking the highest associated SNV (red). Haplotype testing narrowed
this to a region spanning 42–49 Mb. (b) Two ROH were observed on chromosome B1. ROH_1 (orange) was
4 Mb downstream of the GWAS identified FDM-association loci. ROH_2 (blue) was found to overlap the FDM-
associated haplotype block. The incidence of SNVs included in ROHs were observed differentially between cases
and controls with two adjacent peaks of higher frequently in controls than cases. c. Targeted variant discovery in
these ROH and GWAS-identified regions revealed coding variants in genes.
the need to control for false-positives. Given the extent of LD observed in pedigreed cat breeds, traditionally
conservative forms of correction (i.e. Bonferroni correction) are considered excessive. Empirical estimations of
genome-wide significance (i.e. 95% CIs from the distribution of raw P values) are more conservative than what
is typically used in human GWAS but are adequate in population i solates16,36.
Genomic clustering of samples was concordant with geographical provenance. Geographic population strati-
fication was expected as the cats in this study were collected from British, European and Australian populations
that have each been subjected to population bottlenecks during their local breed development. Population sub-
structure in GWAS cohorts is identified as a cause of potentially spurious associations37. Imprecise modelling
of genetic relatedness within GWAS sample populations can cause substantial inflation of test statistics and
potentially false association signals. Further, limiting study samples to entirely unrelated individuals is difficult
in pedigreed breeds, such as the Burmese. To limit the effects of hidden relatedness and population stratifica-
tion, the linear mixed-model (LMM) approach implemented by EMMAX was used. LMM have been shown to
perform well in comparison to traditional family-based association t ests38.
The Burmese cats in this study displayed high homozygosity and long ROH consistent with previous reports14.
The distribution of ROH across the Burmese samples was consistent with previous results39. Long ROH (> 5 Mb)
are indicative of recent inbreeding, unbroken by historical recombination events. No detectable difference in
inbreeding coefficients between FDM cases and control groups was identified. Several factors influence the
resolution of ROH calling, including marker density, marker distribution and genotype call quality. Therefore,
for most populations, medium density genotyping arrays do not lend themselves to high resolution analysis of
ROH40. For this analysis, minor allele frequency (MAF) and LD pruning were not employed in the ROH detec-
tion as both have been shown to mask the detection of true ROH by limiting genome c overage39. Long ROH
(1–10 Mb) made up the largest size category observed across all populations, accounting for over 70% of ROH
observations. Large ROH may persist in a population because of low rates of local recombination particularly
in genomic regions that are subject to positive selection pressures. The risk of T2D is increased by moderate
inbreeding and consanguinity within isolated populations41–43. ROH did not implicate autozygosity as a risk
Scientific Reports | (2020) 10:19194 | https://doi.org/10.1038/s41598-020-76166-3 6
Vol:.(1234567890)www.nature.com/scientificreports/
factor for FDM in Burmese cats, as diabetic cats did not display a higher number of ROH or higher inbreeding
coefficient than non-diabetic cats.
Selective sweeps, indicative of positive selection, manifest by the reduction of genetic variation surrounding
a beneficial mutation, and occur due to positive selection pressure increasing the frequency of the favourable
allele over time44. In cats, at least eight loci are involved in coat colour determination, with various combinations
of these responsible for extensive phenotypic variation. Genes, TYR and TYRP1, inside ROH support strong
selection of tyrosine metabolism and common Burmese coat ‘ticking’ and colour phenotypes45–47. Tyrosine
metabolism influences the development, differentiation and proliferation of melanocytes, the construction and
transport of the melanosome and the synthesis of m elanin48. Short selective sweeps, indicative of extensive LD,
have been associated with T2D in isolated human p opulations49. Sweeps can cause a shift in the allelic frequency
of a selected allele and the ‘hitchhiking’ alleles in their vicinity. Pancreatic islets of FDM and T2D patients are
characterised by reduced beta cell function and decreased insulin gene e xpression50,51. FDM-risk variants within
these selective sweeps identified GRM5 and DLG2 as candidates for beta cell dysregulation, as both are involved
in glucose-stimulated insulin secretion and hyperglycaemia susceptibility in rodent and h uman52–54. Addition-
ally, PTPRD contained within the chromosome D4 ROH has been associated with progression to diabetes in
humans through enhanced insulin resistance55,56. The ROH on chromosome B3 overlapped a syntenic loci in
humans implicated in Prader Willi Syndrome (PWS). T2D has been found to affect between 7 and 24% of PWS
patients, far exceeding the prevalence in the general population57,58. This is likely a consequence of insulin
resistance resulting from morbid obesity however PWS patients also exhibit a state of hypoinsulinaemia without
expected insulin resistance despite their obese state. Deficits in pancreatic islet development may play a role in
the PWS phenotype59,60. NIPA1 is a magnesium transporter, upregulated in response to reduced magnesium
concentration61. Variants in NIPA1 have previously been associated with T2D r isk62 and GABRG3 is an early
childhood obesity gene contributing to PWS p henotype63. The basis of the diabetic state in obese PWS patients
is currently unclear but the PWS locus contains epigenetically imprinted genes that serve as viable candidates
for FDM.
The most compelling FDM-association was provided by the locus on chromosome B1, identified in both
ROH and GWAS analyses. Coding variants matching the risk-haplotype segregated in ANK1, an established T2D
candidate gene associated with decreased beta-cell function in h umans64,65. Feline ANK1 is highly orthologous
(93.89%) to human ANK1 sequence and multiple ANK1 isoforms with affinities for various target proteins are
expressed in a tissue specific m anner66–68. Transcripts of varying size are present in tissues essential to glucose
metabolism: skeletal m uscle , pancreas, adipose and l iver70. Splice region variants identified in this study may be
69
influential in the molecular function of feline ANK1 isoforms, but any potential impact of these will be depend-
ent on tissue-specific expression of ANK1 isoforms. Alternatively-spliced ANK1 transcripts are functionally
diverse and variants in regulatory regions have been implicated in altered molecular function of the various
human isoforms and their role in T2D71. The physiological role of ANK1 in T2D pathogenesis is unconfirmed but
Ankyrin B (ANK2) regulates ATP sensitivity in murine pancreatic beta c ells72. Additionally, SNVs in the ANK1
promoter region have been found to increase intramuscular fat content in p igs73 and increased muscle-specific
ANK1 expression in human skeletal m uscle71 implying SNVs in the ANK1 promoter region may play a role in
the development of insulin resistance.
ROH analysis implicated two loci on chromosome B1 as FDM-risk loci, containing risk variants segregating
in cases and across the breed, further highlighting the genetic complexity of FDM. Both partially overlapped the
semi-dominant Abyssinian ‘ticked’ coat locus responsible for the homogenous agouti coat with no body markings
characteristic of Burmese c ats47. Across chrB1:34,395,302–38,202,712, variants segregated in cases in LOXL2,
previously implicated in nephropathy and retinopathy in T2D p atients74,75, indicating these may play a critical
role in the progression to FDM. Diabetic nephropathy is not routinely recognised in diabetic cats, although
diabetic retinopathy has been reported76. Dyslipidaemia is a critical factor in the early inflammatory response
in the development of r etinopathy77. LOXL2 overexpression is considered a potential target for treatment of
vascular changes involved in diabetic retinopathy78.
Inherited derangements in lipid metabolism have been described in the Burmese breed20,79 and may be
related to the high prevalence of FDM. Familial hypercholesterolaemia (FH) is a common autosomal dominant
disorder of lipoprotein metabolism, with variable phenotypic presentation in h umans80. Variants in EPHX2 have
been found to exacerbate the dysfunction of the Low-density lipoprotein receptor (LDLR) gene in F H81 and are
associated with insulin resistance in T2D patients . Defects in LDLR result in disturbed clearance of low-density
82
lipoprotein cholesterol (LDL-C) and the clinical presentation varies widely depending on the segregation of risk
alleles and haplotype. A missense substitution (c.163A > G) in EPHX2 was fixed across all WGS Burmese samples
within the chrB1:40,408,022–54,187,390 bp ROH. Phenotypic heterogeneity is present between homozygous and
heterozygous FH patients, with a range of increased plasma triglyceride levels, likely influenced by modifying
gene–gene interactions. A syndrome similar to FH has been described in Burmese cats with affected individu-
als exhibiting significantly elevated plasma triglyceride concentrations, lipid aqueous and delayed triglyceride
clearance compared with other b reeds83–85. Post-prandial hypertriglyceridemia has been described in cats with
inherited Lipoprotein lipase (LPL) factors86 with variable phenotypic presentation in homozygous and heterozy-
gous individuals. Further studies will be required to determine whether the lipid metabolism defects in Burmese
cats can be attributed to EPHX2 dysfunction and any potential contribution to increased risk of FDM.
This study has unveiled genomic regions underlying dysfunctional metabolic processes predisposing Bur-
mese cats to FDM, highlighting lipid metabolism as a contributing factor. Larger cohorts of comprehensively
phenotyped individuals across multiple breeds are needed to validate the genetic risk factors presented here. The
segregation of polymorphisms across autozygous regions and identification of risk-haplotypes reveal a potential
highly penetrant recessive locus on chromosome B1. This strategy for identifying risk-loci across a predisposed
population suggests the interaction of multiple genes across a fixed number of loci are likely responsible for FDM
Scientific Reports | (2020) 10:19194 | https://doi.org/10.1038/s41598-020-76166-3 7
Vol.:(0123456789)www.nature.com/scientificreports/
in Australian Burmese cats. The regions reported here characterise a window of FDM association containing
candidate genes for further investigation in larger studies with prospective clinical phenotyping. Detailed char-
acterisation of the genetic risk factors involved in the pathogenesis of FDM, including the allelic variants and
candidate genes presented here, will provide a more comprehensive understanding of the molecular mechanisms
involved and the genetic interaction profiles responsible for this disease, and for T2D in humans. Building on
insights gained from this study, future work can potentially pinpoint population specific allele frequency profiles.
Materials and methods
Clinical diagnosis and sample collection. Eighty-two Burmese cats, comprising 22 diabetic and 60
non-diabetic individuals were submitted for genotyping analysis on the Illumina Infinium iSelect 63 k Cat DNA
genotyping array. Genomic DNA was extracted from whole blood using the DNeasy blood and tissue kit (Qia-
gen GmbH, Germany) or Performagene PG-100 buccal swabs (DNA Genotek, Canada). All cases (15 male, 7
female) had been diagnosed with FDM based on persistent fasting hyperglycaemia, glycosuria with clinical
signs; weight loss, polydipsia and polyphagia by a qualified veterinarian at the University of Sydney Veterinary
Teaching Hospital and Animal Diabetes Australia. Unaffected Burmese were collected from an database of adult
Burmese cats. This included 23 Australian and 24 British Burmese and 13 European Burmese, nine European
cats were members of the same p edigree19. Samples from non-diabetic Burmese (26 male, 34 female) were all
collected by a qualified veterinarian and showed no clinical signs of FDM at the time of their presentation for
clinical examination and sample collection and had never previously been diagnosed with FDM. Veterinary
records of controls were checked for indicators of disease related to diabetes before they were included.
Remapping array variants to feline 9.0 genome assembly. To determine the exact position of feline
array single nucleotide variants (SNV) on the Felis_catus_9.0 genome assembly, we performed a Basic Local
Alignment Search87 using SNV probes available in the feline m anifest88. A FASTA file was created using the SNV
identifier and flanking genomic sequence upstream and downstream of each SNV in top orientation. The long-
est flanking sequence was retained and output in FASTA format. A custom BLAST database was prepared using
BLAST+87 to make the reference FASTA sequence searchable. A nucleotide BLAST search was performed and
output was filtered to collect the single best hit for each sequence, hits that failed to return any result, hits that
failed to reach the base position immediately adjacent to the SNV and those that had an E-value greater than
1e−05 were rejected.
Population structure and quality control. Quality control was carried out for 82 samples and 61,386
SNVs using PLINK 1.989. First, we identified possible duplicate samples and outliers based on pairwise genetic
distances (–genome) and removed one sample from each pair with an identity by descent (IBD) estimate > 0.65.
Population stratification was evaluated using a MDS plot with two dimensions (–mds). Marker-based QC
included pruning the total set of SNVs at a MAF (–maf) of 0.05 and a SNV (–mind) and individual call rate
(–geno) of > 90%.
Case–control genome‑wide association study and haplotype analysis. Testing for association
between FDM and markers on the feline genotyping array was performed in two stages using Efficient Mixed-
Model Association eXpedited (EMMAX)90. Given all cases were of Australian provenance, an initial association
analysis (analysis 1) was performed on samples within the unstratified Australian cluster. To validate the associa-
tions observed in the Australian cluster, a second association analysis (analysis 2) run in EMMAX included an
expanded group of individuals from Australian, UK and EU populations (22 cases, 60 controls) and the top 10%
of association signals from analysis 1. The genome-wide significance threshold in both analyses was calculated
based on empirical 95% confidence intervals (CIs). The probability distribution was determined by running the
GWAS 1000 times with randomly permuted phenotypes. The genome-wide significance threshold was set at the
97.5% upper CI (based on a two-tailed distribution) (P < 7.6 × 10⁻⁵) (Karlsson et al.16).
Regions of association were refined using LD clumping (–clump) in PLINK. First, a region of weak LD
(r2 > 0.2) was defined within 5 Mb of each top SNV and then the region was narrowed to a single locus of high LD
(r2 > 0.8) within 2 Mb of the highest associated SNV per locus. The refined regions were submitted for haplotype
analysis with HAPLOVIEW91. FDM-associated haplotype blocks were examined in all 82 individuals and were
defined using the four-gamete r ule92. Consecutive haplotype blocks with a multiallelic r 2 value of 1 were com-
bined and blocks containing the top associated SNVs were used to define our FDM-associated loci. Significance
of FDM-associated haplotype blocks was measured by running 10,000 permutations.
Runs of homozygosity analysis. ROH analysis was performed to identify FDM-associated regions of
autozygosity using PLINK (–homozyg function). The input settings for minimal density of SNVs, maximal gap
size, scanning window length and threshold settings were determined empirically39. The ROH analysis was run
using a maximal gap size of 300 kb (–homozyg-gap) and scanning window size setting of minimal density (–
homozyg-density) at 80 kb/SNV at a genome coverage of 98.9%. Additional settings were; a scanning window
hit rate of 0.05 (–homozyg-window-threshold), maximum of one heterozygous SNV per final ROH segment
(–homozyg-het) and a minimum of 94 SNVs in each final ROH (–homozyg-SNV) (Table S2). Inbreeding coef-
ficients (FROH) for genotyped individuals were calculated based on the length of the autosomal genome and the
length of the genome covered by feline array markers (Meyermans et al. 2019). Correlations between inbreed-
ing coefficients F ROHcov and FROHaut were measured using a Pearson’s correlation test. We did not prune SNVs
based on MAF or LD. ROH on chromosomes B1, B3, D1 and D4 were examined for syntenic regions using the
Ensembl Bioinformatics database and a database search was performed using the BLAST algorithm. Compara-
Scientific Reports | (2020) 10:19194 | https://doi.org/10.1038/s41598-020-76166-3 8
Vol:.(1234567890)www.nature.com/scientificreports/
tive genome analyses of ROH on chromosomes B1 and B3 were undertaken. ROH distributions were compared
between the Australian cluster and the expanded group of Burmese and between cases and controls across all
autosomes to identify any regions associated with FDM.
Risk variant discovery and annotation. Genomic DNA was extracted from whole blood samples of five
Australian Burmese cats (3 cases, 2 controls) included in GWAS analysis, using a phenol–chloroform extraction
protocol. DNA samples were submitted for whole genome sequencing (WGS). Illumina paired-end libraries were
prepared and sequenced on the Illumina HiSeq 2000 platform with 150 bp paired-end reads (~ 12–21 × cover-
age). An additional three WGS samples, of unknown diabetic phenotype, available on Sequence Read Archive
(SRA) were downloaded (SRX2376210, SRX2669131, SRX2376201) (~ 12–27 × coverage). All samples were
aligned to the Felis_catus_9.0 reference assembly using BWA-mem93. Base quality score recalibration, indel
realignment and duplicate removal was performed using Genome Analysis ToolKit (GATK)94. Genome-wide
variant detection was performed using GATK’s HaplotypeCaller according to best practices and variants filtered
for sequence depth (DP > 10), quality of alignment (GQ > 20) and strand bias95. Given the complex phenotypic
presentation of FDM and the unknown clinical phenotype of the SRA samples, associated haplotype blocks were
filtered according to presence or absence of risk haplotypes across the eight WGS samples, rather than clinical
information of each individual. ROH were examined for FDM risk variants segregating in affected WGS samples
and potential risk factors across the breed. Filtered variants were analysed with Ensembl’s Variant Effect Predic-
tor (VEP) tool96. Sequence variants were further filtered for genic variants and annotated variants with Sort
Intolerant From Tolerant (SIFT) tool97.
Ethical approval. Recommendations from the Australian Code for the Care and Use of Animals for Scien-
tific Purposes was strictly adhered to throughout this study. Research was conducted at The University of Sydney,
under Animal Ethics Committee approval no: N00/9–2009/3/5109, 24 September 2009. Blood and buccal swab
samples were all collected a veterinarian or donated by owners and breeders.
Data availability
Genotyping array data is available at 10.6084/m9.figshare.12561815 and 10.6084/m9.figshare.12561770. Whole
genome sequence data for five phenotyped Australian Burmese samples can be accessed freely upon request to
the 99Lives Consortium Coordinator, L. A. Lyons (lyonsla@missouri.edu). Whole genome sequence data for three
Burmese samples of unknown clinical status can be accessed via NCBI Sequence Read Archive under accession
codes: SRX2376208, SRX2376209 and SRX2376210.
Received: 29 June 2020; Accepted: 22 October 2020
References
1. Henson, M. S. & O’Brien, T. D. Feline models of type 2 diabetes mellitus. ILAR J. 47, 234–242. https: //doi.org/10.1093/ilar.47.3.234
(2006).
2. Osto, M., Zini, E., Reusch, C. E. & Lutz, T. A. Diabetes from humans to cats. Gen. Comp. Endocrinol. 182, 48–53. https://doi.
org/10.1016/j.ygcen.2012.11.019 (2013).
3. Hoenig, M. Comparative aspects of human, canine, and feline obesity and factors predicting progression to diabetes. Vet. Sci. https
://doi.org/10.3390/vetsci1020121 (2014).
4. Samaha, G., Beatty, J., Wade, C. M. & Haase, B. The Burmese cat as a genetic model of type 2 diabetes in humans. Anim. Genet.
50, 319–325. https://doi.org/10.1111/age.12799 (2019).
5. Slingerland, L. I., Fazilova, V. V., Plantinga, E. A., Kooistra, H. S. & Beynen, A. C. Indoor confinement and physical inactivity
rather than the proportion of dry food are risk factors in the development of feline type 2 diabetes mellitus. Vet. J. 179, 247–253.
https://doi.org/10.1016/j.tvjl.2007.08.035 (2009).
6. Öhlund, M. et al. Environmental risk factors for diabetes mellitus in cats. J. Vet. Intern. Med. 31, 29–35. https://doi.org/10.1111/
jvim.14618(2017).
7. DIAbetes Genetics Replication And Meta-analysis (DIAGRAM) Consortium. et al. Genome-wide trans-ancestry meta-analysis
provides insight into the genetic architecture of type 2 diabetes susceptibility. Nat. Genet. 46, 234–244. https://doi.org/10.1038/
ng.2897 (2014).
8. Xue, A. et al. Genome-wide association analyses identify 143 risk variants and putative regulatory mechanisms for type 2 diabetes.
Nat. Commun. 9, 2941. https://doi.org/10.1038/s41467-018-04951-w (2018).
9. Baral, R., Rand, J., Catt, M. & Farrow, H. Prevalence of feline diabetes mellitus in a feline private practice [abstract]. J. Vet. Intern.
Med. 17, 433–434 (2003).
10. McCann, T. M., Simpson, K. E., Shaw, D. J., Butt, J. A. & Gunn-Moore, D. A. Feline diabetes mellitus in the UK: the prevalence
within an insured cat population and a questionnaire-based putative risk factor analysis. J. Feline Med. Surg. 9, 289–299. https://
doi.org/10.1016/j.jfms.2007.02.001 (2007).
11. Lederer, R., Rand, J. S., Jonsson, N. N., Hughes, I. P. & Morton, J. M. Frequency of feline diabetes mellitus and breed predisposition
in domestic cats in Australia. Vet. J. 179, 254–258. https://doi.org/10.1016/j.tvjl.2007.09.019 (2009).
12. Panciera, D. L., Thomas, C. B., Eicker, S. W. & Atkins, C. E. Epizootiologic patterns of diabetes mellitus in cats: 333 cases (1980–
1986). J. Am. Vet. Med. Assoc. 197, 1504–1508 (1990).
13. Prahl, A., Guptill, L., Glickman, N. W., Tetrick, M. & Glickman, L. T. Time trends and risk factors for diabetes mellitus in cats
presented to veterinary teaching hospitals. J. Feline Med. Surg. 9, 351–358. https://doi.org/10.1016/j.jfms.2007.02.004 (2007).
14. Lipinski, M. J. et al. The ascent of cat breeds: Genetic evaluations of breeds and worldwide random-bred populations. Genomics
91, 12–21. https://doi.org/10.1016/j.ygeno.2007.10.009 (2008).
15. Gandolfi, B. et al. A dominant TRPV4 variant underlies osteochondrodysplasia in Scottish fold cats. Osteoarthr. Cartil. 24, 1441–
1450. https://doi.org/10.1016/j.joca.2016.03.019 (2016).
16. Karlsson, E. K. et al. Genome-wide analyses implicate 33 loci in heritable dog osteosarcoma, including regulatory variants near
CDKN2A/B. Genome Biol. 14, R132. https://doi.org/10.1186/gb-2013-14-12-r132 (2013).
Scientific Reports | (2020) 10:19194 | https://doi.org/10.1038/s41598-020-76166-3 9
Vol.:(0123456789)www.nature.com/scientificreports/
17. King, A. J. F. The use of animal models in diabetes research. Br. J. Pharmacol. 166, 877–894. https: //doi.org/10.111
1/j.1476-5381.2012.01911.x (2012).
18. Lyons, L. A. et al. Aristaless-like homeobox protein 1 (ALX1) variant associated with craniofacial structure and frontonasal dys-
plasia in Burmese cats. Dev. Biol. 409, 451–458. https://doi.org/10.1016/j.ydbio.2015.11.015 (2016).
19. Gandolfi, B. et al. First WNK4-hypokalemia animal model identified by genome-wide association in Burmese cats. PLoS ONE 7,
e53173–e53173. https://doi.org/10.1371/journal.pone.0053173 (2012).
20. Kluger, E. K., Caslake, M., Baral, R. M., Malik, R. & Govendir, M. Preliminary post-prandial studies of Burmese cats with ele-
vated triglyceride concentrations and/or presumed lipid aqueous. J. Feline Med. Surg. 12, 621–630. https://doi.org/10.1016/j.
jfms.2010.04.002 (2010).
21. Rusbridge, C. et al. Feline orofacial pain syndrome (FOPS): a retrospective study of 113 cases. J. Feline Med. Surg. 12, 498–508.
https://doi.org/10.1016/j.jfms.2010.03.005 (2010).
22. Rand, J. S., Bobbermien, L. M., Hendrikz, J. K. & Copland, M. Over representation of Burmese cats with diabetes mellitus. Aust.
Vet. J. 75, 402–405. https://doi.org/10.1111/j.1751-0813.1997.tb14340.x (1997).
23. Alhaddad, H. et al. Extent of linkage disequilibrium in the domestic cat, Felis silvestris catus, and its breeds. PLoS ONE 8, e53537–
e53537. https://doi.org/10.1371/journal.pone.0053537 (2013).
24. Gandolfi, B. et al. Applications and efficiencies of the first cat 63K DNA array. Sci. Rep. 8, 7024. https://doi.org/10.1038/s4159
8-018-25438-0 (2018).
25. Aramburu, O. et al. Genomic signatures after five generations of intensive selective breeding: runs of homozygosity and genetic
diversity in representative domestic and wild populations of turbot (Scophthalmus maximus). Front. Genet. https: //doi.org/10.3389/
fgene.2020.00296 (2020).
26. Gibson, J., Morton, N. E. & Collins, A. Extended tracts of homozygosity in outbred human populations. Hum. Mol. Genet. 15,
789–795. https://doi.org/10.1093/hmg/ddi493 (2006).
27. Purfield, D. C., McParland, S., Wall, E. & Berry, D. P. The distribution of runs of homozygosity and selection signatures in six
commercial meat sheep breeds. PLoS ONE 12, e0176780–e0176780. https://doi.org/10.1371/journal.pone.0176780 (2017).
28. Metzger, J. et al. Runs of homozygosity reveal signatures of positive selection for reproduction traits in breed and non-breed horses.
BMC Genom. 16, 764. https://doi.org/10.1186/s12864-015-1977-3 (2015).
29. Xie, R. et al. Genome-wide scan for runs of homozygosity identifies candidate genes in three pig breeds. Animals (Basel) 9, 518.
https://doi.org/10.3390/ani9080518 (2019).
30. Lencz, T. et al. Runs of homozygosity reveal highly penetrant recessive loci in schizophrenia. Proc. Natl. Acad. Sci. 104, 19942–
19947. https://doi.org/10.1073/pnas.0710021104 (2007).
31. Nalls, M. A. et al. Extended tracts of homozygosity identify novel candidate genes associated with late-onset Alzheimer’s disease.
Neurogenetics 10, 183–190. https://doi.org/10.1007/s10048-009-0182-4 (2009).
32. Alkuraya, F. S. The application of next-generation sequencing in the autozygosity mapping of human recessive diseases. Hum.
Genet. 132, 1197–1211. https://doi.org/10.1007/s00439-013-1344-x (2013).
33. Sams, A. J. & Boyko, A. R. Fine-scale resolution of runs of homozygosity reveal patterns of inbreeding and substantial overlap with
recessive disease genotypes in domestic dogs. G3 Genes Genom. Genet. 9, 117–123. https://doi.org/10.1534/g3.118.200836 (2019).
34. Marsden, C. D. et al. Bottlenecks and selective sweeps during domestication have increased deleterious genetic variation in dogs.
Proc. Natl. Acad. Sci. USA 113, 152–157. https://doi.org/10.1073/pnas.1512501113 (2016).
35. Derks, M. F. L. et al. A survey of functional genomic variation in domesticated chickens. Genet. Sel. Evol. 50, 17. https://doi.
org/10.1186/s12711-018-0390-1 (2018).
36. Kanai, M., Tanaka, T. & Okada, Y. Empirical estimation of genome-wide significance thresholds based on the 1000 genomes project
data set. J. Hum. Genet. 61, 861–866. https://doi.org/10.1038/jhg.2016.72 (2016).
37. Tian, C., Gregersen, P. K. & Seldin, M. F. Accounting for ancestry: population substructure and genome-wide association studies.
Hum. Mol. Genet. 17, R143-150. https://doi.org/10.1093/hmg/ddn268 (2008).
38. Eu-ahsunthornwattana, J. et al. Comparison of methods to account for relatedness in genome-wide association studies with family-
based data. PLoS Genet. 10, e1004445. https://doi.org/10.1371/journal.pgen.1004445 (2014).
39. Meyermans, R., Gorssen, W., Buys, N. & Janssens, S. How to study runs of homozygosity using PLINK? A guide for analyzing
medium density SNP data in livestock and pet species. BMC Genom. 21, 94. https://doi.org/10.1186/s12864-020-6463-x (2020).
40. Ceballos, F. C., Hazelhurst, S. & Ramsay, M. Assessing runs of Homozygosity: a comparison of SNV array and whole genome
sequence low coverage data. BMC Genom. 19, 106–106. https://doi.org/10.1186/s12864-018-4489-0 (2018).
41. Dajani, R. et al. Diabetes mellitus in genetically isolated populations in Jordan: prevalence, awareness, glycemic control, and
associated factors. J. Diabetes Complicat. 26, 175–180. https://doi.org/10.1016/j.jdiacomp.2012.03.009 (2012).
42. Saxena, R. et al. Genome-wide association study identifies a novel locus contributing to type 2 diabetes susceptibility in Sikhs of
Punjabi origin From India. Diabetes 62, 1746. https://doi.org/10.2337/db12-1077 (2013).
43. Gosadi, I. M., Goyder, E. C. & Teare, M. D. Investigating the potential effect of consanguinity on type 2 diabetes susceptibility in
a Saudi population. Hum. Hered. 77, 197–206. https://doi.org/10.1159/000362447 (2014).
44. Smith, J. M. & Haigh, J. The hitch-hiking effect of a favourable gene. Genet. Res. 23, 23–35 (1974).
45. Lyons, L. A., Foe, I. T., Rah, H. C. & Grahn, R. A. Chocolate coated cats: TYRP1 mutations for brown color in domestic cats.
Mamm. Genome Off. J. Int. Mamm. Genome Soc. 16, 356–366. https://doi.org/10.1007/s00335-004-2455-4 (2005).
46. Schmidt-Küntzel, A., Eizirik, E., O’Brien, S. J. & Menotti-Raymond, M. Tyrosinase and tyrosinase related protein 1 alleles specify
domestic cat coat color phenotypes of the albino and brown Loci. J. Hered. 96, 289–301. https://doi.org/10.1093/jhered/esi066
(2005).
47. Eizirik, E. et al. Defining and mapping mammalian coat pattern genes: multiple genomic regions implicated in domestic cat stripes
and spots. Genetics 184, 267–275. https://doi.org/10.1534/genetics.109.109629 (2010).
48. D’Mello, S. A., Finlay, G. J., Baguley, B. C. & Askarian-Amiri, M. E. Signaling pathways in melanogenesis. Int. J. Mol. Sci. https://
doi.org/10.3390/ijms17071144 (2016).
49. Acosta, J. L. et al. Rare intronic variants of TCF7L2 arising by selective sweeps in an indigenous population from Mexico. BMC
Genet. 17, 68–68. https://doi.org/10.1186/s12863-016-0372-7 (2016).
50. Maedler, K. Beta cells in type 2 diabetes—a crucial contribution to pathogenesis. Diabetes Obes. Metab. 10, 408–420. https://doi.
org/10.1111/j.1463-1326.2007.00718.x (2008).
51. Zini, E. et al. Endocrine pancreas in cats with diabetes mellitus. Vet. Pathol. 53, 136–144. https://doi.org/10.1177/0300985815
591078 (2016).
52. Brice, N. L., Varadi, A., Ashcroft, S. J. & Molnar, E. Metabotropic glutamate and GABA(B) receptors contribute to the modulation
of glucose-stimulated insulin secretion in pancreatic beta cells. Diabetologia 45, 242–252. https://doi.org/10.1007/s00125-001-
0750-0 (2002).
53. Storto, M. et al. Insulin secretion is controlled by mGlu5 metabotropic glutamate receptors. Mol. Pharmacol. 69, 1234–1241. https
://doi.org/10.1124/mol.105.018390 (2006).
54. Yang, C. H. et al. E2f8 and Dlg2 genes have independent effects on impaired insulin secretion associated with hyperglycaemia.
Diabetologia 63, 1333–1348. https://doi.org/10.1007/s00125-020-05137-0 (2020).
55. Tsai, F. J. et al. A genome-wide association study identifies susceptibility variants for type 2 diabetes in Han Chinese. PLoS Genet.
6, e1000847. https://doi.org/10.1371/journal.pgen.1000847 (2010).
Scientific Reports | (2020) 10:19194 | https://doi.org/10.1038/s41598-020-76166-3 10
Vol:.(1234567890)www.nature.com/scientificreports/
56. Chang, Y. C. et al. Replication of genome-wide association signals of type 2 diabetes in Han Chinese in a prospective cohort. Clin.
Endocrinol. 76, 365–372. https://doi.org/10.1111/j.1365-2265.2011.04175.x (2012).
57. Vogels, A. & Fryns, J. P. Age at diagnosis, body mass index and physical morbidity in children and adults with the Prader-Willi
syndrome. Genet. Couns. (Geneva, Switzerland) 15, 397–404 (2004).
58. Sinnema, M. et al. Physical health problems in adults with Prader-Willi syndrome. Am. J. Med. Genet. Part A 155a, 2112–2124.
https://doi.org/10.1002/ajmg.a.34171 (2011).
59. Stefan, M. et al. Global deficits in development, function, and gene expression in the endocrine pancreas in a deletion mouse
model of Prader–Willi syndrome. Am. J. Physiol. Endocrinol. Metab. 300, E909–E922. https://doi.org/10.1152/ajpendo.00185.2010
(2011).
60. Goldstone, A. P., Holland, A. J., Butler, J. V. & Whittington, J. E. Appetite hormones and the transition to hyperphagia in children
with Prader–Willi syndrome. Int. J. Obes. 36, 1564–1570. https://doi.org/10.1038/ijo.2011.274 (2012).
61. Goytain, A., Hines, R. M., El-Husseini, A. & Quamme, G. A. NIPA1(SPG6), the basis for autosomal dominant form of hereditary
spastic paraplegia, encodes a functional Mg2+ transporter. J. Biol. Chem. 282, 8060–8068. https: //doi.org/10.1074/jbc.M61031 4200
(2007).
62. Chan, K. H. K. et al. Genetic variations in magnesium-related ion channels may affect diabetes risk among African American and
Hispanic American women. J. Nutr. 145, 418–424. https://doi.org/10.3945/jn.114.203489 (2015).
63. Ebert, M. H., Schmidt, D. E., Thompson, T. & Butler, M. G. Elevated plasma gamma-aminobutyric acid (GABA) levels in individuals
with either Prader–Willi syndrome or Angelman syndrome. J. Neuropsychiatry Clin. Neurosci. 9, 75–80. https://doi.org/10.1176/
jnp.9.1.75 (1997).
64. Morris, A. P. et al. Large-scale association analysis provides insights into the genetic architecture and pathophysiology of type 2
diabetes. Nat. Genet. 44, 981–990. https://doi.org/10.1038/ng.2383 (2012).
65. Harder, M. N. et al. Type 2 diabetes risk alleles near BCAR1 and in ANK1 associate with decreased β-cell function whereas risk
alleles near ANKRD55 and GRB14 associate with decreased insulin sensitivity in the Danish Inter99 cohort. J. Clin. Endocrinol.
Metab. 98, E801–E806. https://doi.org/10.1210/jc.2012-4169 (2013).
66. Gallagher, P. G. & Forget, B. G. An alternate promoter directs expression of a truncated, muscle-specific isoform of the human
Ankyrin 1 gene. J. Biol. Chem. 273, 1339–1348. https://doi.org/10.1074/jbc.273.3.1339 (1998).
67. Gallagher, P. G., Tse, W. T., Scarpa, A. L., Lux, S. E. & Forget, B. G. Structure and organization of the human Ankyrin-1 gene: basis
for complexity of pre-mRNA Processing. J. Biol. Chem. 272, 19220–19228. https://doi.org/10.1074/jbc.272.31.19220 (1997).
68. Rubtsov, A. M. & Lopina, O. D. Ankyrins. FEBS Lett. 482, 1–5. https://doi.org/10.1016/s0014-5793(00)01924-4 (2000).
69. Sun, L., Zhang, X., Wang, T., Chen, M. & Qiao, H. Association of ANK1 variants with new-onset type 2 diabetes in a Han Chinese
population from northeast China. Exp. Ther. Med. 14, 3184–3190. https://doi.org/10.3892/etm.2017.4866 (2017).
70. Imamura, M. et al. A single-nucleotide polymorphism in ANK1 is associated with susceptibility to type 2 diabetes in Japanese
populations. Hum. Mol. Genet. 21, 3042–3049. https://doi.org/10.1093/hmg/dds113 (2012).
71. Yan, R. et al. A novel type 2 diabetes risk allele increases the promoter activity of the muscle-specific small ankyrin 1 gene. Sci.
Rep. 6, 25105. https://doi.org/10.1038/srep25105 (2016).
72. Kline, C. F. et al. Dual role of KATP channel C-terminal motif in membrane targeting and metabolic regulation. Proc.
Natl. Acad. Sci. 106, 16669–16674. https://doi.org/10.1073/pnas.0907138106 (2009).
73. Aslan, O. et al. Association between promoter polymorphisms in a key cytoskeletal gene (Ankyrin 1) and intramuscular fat and
water-holding capacity in porcine muscle. Mol. Biol. Rep. 39, 3903–3914. https://doi.org/10.1007/s11033-011-1169-4 (2012).
74. Chen, J., Ren, J., Loo, W. T. Y., Hao, L. & Wang, M. Lysyl oxidases expression and histopathological changes of the diabetic rat
nephron. Mol. Med. Rep. 17, 2431–2441. https://doi.org/10.3892/mmr.2017.8182 (2018).
75. Subramanian, M. L. et al. Upregulation of lysyl oxidase expression in vitreous of diabetic subjects: implications for diabetic retin-
opathy. Cells 8, 1122. https://doi.org/10.3390/cells8101122 (2019).
76. Linsenmeier, R. A. et al. Retinal hypoxia in long-term diabetic cats. Invest. Ophthalmol. Vis. Sci. 39, 1647–1657 (1998).
77. Al-Shabrawey, M., Ibrahim, A., Beasley, S., Wang, F. & Tawfik, A. Bioactive lipids and early inflammatory response in diabetic
retinopathy. Acta Ophthalmol. https://doi.org/10.1111/j.1755-3768.2015.0061 (2015).
78. Li, Z. et al. Overexpression of 15-lipoxygenase-1 in oxygen-induced ischemic retinopathy inhibits retinal neovascularization via
downregulation of vascular endothelial growth factor-A expression. Mol. Vis. 18, 2847–2859 (2012).
79. Lee, P. et al. Potential predictive biomarkers of obesity in Burmese cats. Vet. J. 195, 221–227. https://doi.org/10.1016/j.
tvjl.2012.06.027 (2013).
80. Takada, D. et al. Interaction between the LDL-receptor gene bearing a novel mutation and a variant in the apolipoprotein A-II
promoter: molecular study in a 1135-member familial hypercholesterolemia kindred. J. Hum. Genet. 47, 656–664. https://doi.
org/10.1007/s100380200101 (2002).
81. Sato, K. et al. Soluble epoxide hydrolase variant (Glu287Arg) modifies plasma total cholesterol and triglyceride phenotype in
familial hypercholesterolemia: intrafamilial association study in an eight-generation hyperlipidemic kindred. J. Hum. Genet. 49,
29–34. https://doi.org/10.1007/s10038-003-0103-6 (2004).
82. Ohtoshi, K. et al. Association of soluble epoxide hydrolase gene polymorphism with insulin resistance in type 2 diabetic patients.
Biochem. Biophys. Res. Commun. 331, 347–350. https://doi.org/10.1016/j.bbrc.2005.03.171 (2005).
83. Crispin, S. Ocular lipid deposition and hyperlipoproteinaemia. Prog. Retin. Eye Res. 21, 169–224. https://doi.org/10.1016/S1350
-9462(02)00004-6 (2002).
84. Hardman, C. Lipid aqueous as a sign of hyperlipidaemia in Burmese cats. 261 (1999).
85. Kluger, E. K. et al. Triglyceride response following an oral fat tolerance test in Burmese cats, other pedigree cats and domestic
crossbred cats. J. Feline Med. Surg. 11, 82–90. https://doi.org/10.1016/j.jfms.2008.05.005 (2009).
86. Ginzinger, D. G. et al. A mutation in the lipoprotein lipase gene is the molecular basis of chylomicronemia in a colony of domestic
cats. J. Clin. Investig. 97, 1257–1266. https://doi.org/10.1172/JCI118541 (1996).
87. Camacho, C. et al. BLAST+: architecture and applications. BMC Bioinform. 10, 421. https://doi.org/10.1186/1471-2105-10-421
(2009).
88. Willet, C. E. & Haase, B. An updated felCat5 SNP manifest for the Illumina Feline 63k SNP genotyping array. Anim. Genet. 45,
614–615. https://doi.org/10.1111/age.12169 (2014).
89. Chang, C. C. et al. Second-generation PLINK: rising to the challenge of larger and richer datasets. GigaScience 4, 7. https://doi.
org/10.1186/s13742-015-0047-8 (2015).
90. Kang, H. M. et al. Variance component model to account for sample structure in genome-wide association studies. Nat. Genet.
42, 348–354. https://doi.org/10.1038/ng.548 (2010).
91. Barrett, J. C., Fry, B., Maller, J. & Daly, M. J. Haploview: analysis and visualization of LD and haplotype maps. Bioinformatics 21,
263–265. https://doi.org/10.1093/bioinformatics/bth457 (2004).
92. Wang, N., Akey, J. M., Zhang, K., Chakraborty, R. & Jin, L. Distribution of recombination crossovers and the origin of haplo-
type blocks: the interplay of population history, recombination, and mutation. Am. J. Hum. Genet. 71, 1227–1234. https://doi.
org/10.1086/344398 (2002).
93. Li, H. & Durbin, R. Fast and accurate short read alignment with Burrows-Wheeler transform. Bioinformatics (Oxford, England)
25, 1754–1760. https://doi.org/10.1093/bioinformatics/btp324 (2009).
Scientific Reports | (2020) 10:19194 | https://doi.org/10.1038/s41598-020-76166-3 11
Vol.:(0123456789)You can also read