Marine Environment Report 2014 - Benguela ...
←
→
Page content transcription
If your browser does not render page correctly, please read the page content below
BCLME State of the
Marine Environment
             Report

                            2014

         CU R R E N T COM M I S S IO N
DAVIES, S., HJORT, A., BOYER, D & H.BOYER. 2015.
        Benguela Current Large Marine Ecosystem:
            State of the Marine Environment, 2014.
        1st Edition. Benguela Current Commission,
                            Swakopmund, Namibia.

             Any opinions, findings, conclusions or
recommendations expressed in this report are those
    of the authors and do not necessary reflect the
        views of the Benguela Current Commission.
Foreword

By Dr Hashali Hamukuaya
Executive Secretary to the Benguela Current Commission

For over two decades – spurred on by the landmark 1992 Earth Summit held in Rio de Janeiro, Brazil –
the Benguela Current Large Marine Ecosystem (BCLME) region has been lauded internationally for
pioneering the implementation of an integrated, multi-sector, multi-country approach to ocean
management. In March 2013, when the countries of Angola, Namibia and South Africa signed the
Benguela Current Convention, we had achieved the greatest milestone to date – that of the formation
of the first multi-lateral Commission in the world to be based on the large marine ecosystem approach
to ocean governance.
The countries of the Benguela Current Commission are now driven by a binding commitment and
are working with increased vigor to collaborate in promoting the long-term conservation, protection,
rehabilitation, enhancement and sustainable utilisation of the BCLME.
Evidence of this increased effort can be seen by the recent endorsement, in August 2014, by 12
ministers of a revitalised and updated Strategic Action Programme and now by the production of this,
the first BCLME State of the Marine Environment Report (SOMER).
Although the process of collecting, collating and publicising key information is still in its infancy,
this SOMER demonstrates an exciting step for the BCLME community in providing comparable
information in a new and standardised manner. This information includes details on the economic
and social contributions of the ecosystem, the current and likely future pressures impacting on the
BCLME, the state and trends of some key ecosystem health indicators, and past, current and probable
future responses to these pressures. Overall the SOMER provides a brief but comprehensive overview
of the BCLME.
The report has been produced for a broad audience with the intention of providing easily accessible
information to anyone with an interest in the marine environment. It will be of particular interest to
those living in the BCLME region with a concern for their surroundings; local communities, private-
or public-sector decision-makers and civil servants, resource managers, private sector employees,
scientists and students, indeed anyone who wishes to become better informed about the BCLME.
The international community, including partners and donors, should find this report useful as an
introduction and guide to the human interactions with this complex and challenging ecosystem.
I hope you will find this first SOMER an interesting summary of human activities taking place within
the BCLME, the impacts these activities have on the ecosystem, how we are addressing these impacts
and what remains to be done.
                 From the Benguela Current Commission Secretariat, we wish you an enjoyable read.

                                                           Dr Hashali Hamukuaya
                                                                                       CU R R E N T CO MMI SSI ON

                                                  1
Contents
1 Introduction           .......................................................................................................................................................................................3
  1.1 How is the report structured and why?......................................................................................................................................3
  1.2 Limitations of the report......................................................................................................................................................................4
  1.3 Acknowledgement..................................................................................................................................................................................4
2 Understanding the BCLME.........................................................................................................................................................................4
  2.1 The Benguela Current ecosystem..................................................................................................................................................5
  2.2 The geographical scope and ecosystem boundaries........................................................................................................6
  2.3 Natural variability......................................................................................................................................................................................6
  2.4 The BCLME inhabitants.........................................................................................................................................................................6
		     2.4.1 Human population distribution in the BCLME.....................................................................................................8
		     2.4.2 The main ports..........................................................................................................................................................................8
3 Economic and social value of the coastal and marine environment.........................................................................9
  3.1 Petroleum and gas...................................................................................................................................................................................9
  3.2 Mineral mining .................................................................................................................................................................................... 10
  3.3 Capture fisheries .................................................................................................................................................................................... 11
  3.4 Tourism and marine recreational activities............................................................................................................................ 12
  3.5 Mariculture        .................................................................................................................................................................................... 13
  3.6 Marine transport .................................................................................................................................................................................... 13
  3.7 Salt production .................................................................................................................................................................................... 13
  3.8 Desalination       .................................................................................................................................................................................... 13
4 Major pressures affecting the coastal and marine environment.............................................................................. 14
  4.1 Unsustainable utilisation of marine living resources....................................................................................................... 15
  4.2 Marine pollution .................................................................................................................................................................................... 16
  4.3 Disturbance and physical modification of coastal and marine habitats............................................................. 18
  4.4 Invasive species .................................................................................................................................................................................... 19
  4.5 Climate change .................................................................................................................................................................................... 19
5 State and trends of the coastal and marine environment.............................................................................................. 21
  5.1 Oceanography: variability, productivity and water quality.......................................................................................... 21
		     5.1.1 Variability and productivity............................................................................................................................................ 21
			            5.1.1.1 Benguela Niños................................................................................................................................................ 21
			            5.1.1.2 Regime shifts..................................................................................................................................................... 22
			            5.1.1.3 Climate change................................................................................................................................................ 22
			            5.1.1.4 Phytoplankton................................................................................................................................................... 22
			            5.1.1.5 Zooplankton....................................................................................................................................................... 23
			            5.1.1.6 Recent changes in oceanographic and biological processes............................................. 23
		     5.1.2 Water quality........................................................................................................................................................................... 24
			            5.1.2.1 Hypoxia................................................................................................................................................................. 24
			            5.1.2.2 Sulphur eruptions........................................................................................................................................... 24
			            5.1.2.3 Harmful algal blooms................................................................................................................................... 24
			            5.1.2.4 Pollution................................................................................................................................................................ 25
  5.2 Biodiversity       .................................................................................................................................................................................... 25
		     5.2.1 Species health........................................................................................................................................................................ 25
			            5.2.1.1 Overall health and diversity...................................................................................................................... 25
			            5.2.1.2 Vulnerable/threatened species.............................................................................................................. 26
			            5.2.1.3 Harvested resources...................................................................................................................................... 33
		     5.2.2 Habitat health......................................................................................................................................................................... 37
			            5.2.2.1 Overall health.................................................................................................................................................... 37
			            5.2.2.2 Fishing impacts................................................................................................................................................ 38
			            5.2.2.3 Mining impacts................................................................................................................................................ 38
			            5.2.2.4 State of estuaries and lagoons................................................................................................................ 39
			            5.2.2.5 Vulnerable habitats........................................................................................................................................ 40
			            5.2.2.6 Marine Protected Areas............................................................................................................................... 42
  5.3 Human dimensions.............................................................................................................................................................................. 42
		     5.3.1 The state of national development.......................................................................................................................... 42
		     5.3.2 General human well-being............................................................................................................................................ 43
6 Responses		            .................................................................................................................................................................................... 44
  6.1 Unsustainable utilisation of marine living resources....................................................................................................... 45
  6.2 Marine pollution .................................................................................................................................................................................... 45
  6.3 Physical modification of coastal and marine habitats.................................................................................................... 47
  6.4 Invasive species .................................................................................................................................................................................... 47
  6.5 Climate change .................................................................................................................................................................................... 47
  6.6 Interactions between pressures................................................................................................................................................... 48
  6.7 Gaps in response.................................................................................................................................................................................... 48
7 Future outlook of the coastal and marine environment.................................................................................................. 51

                         B C C S TAT E O F T H E MAR I N E E N V I R O N M E N T R E P O R T 2 0 1 4
1       Introduction

This is the first State of the Marine Environment Report (SOMER) for the Benguela Current Large Marine Ecosystem
(BCLME). While it builds on a multitude of environmental studies, impact assessments and scientific reports on the
health of the various components of the ecosystem, it also begins a new and standardised process of collecting,
collating and publicising key information about the economic and social contributions of the ecosystem, the current
and potential future pressures impacting on the BCLME, the state and trends of some key ecosystem health indicators,
and past, current and potential future responses to these pressures. It also reflects on the future of the BCLME.

1.1     How is the report structured and why?

The structure of this report is adapted from the Pressure-State-Response framework developed by OECD and applied
globally since the 1970s for environmental reporting and more recently for work with environmental indicators.
The Pressure-State-Response framework is founded on the concept of causality, whereby human activities exert
pressure on the environment that results in changes to the quality and quantity of its natural resources (the state).
Society responds to these changes through environmental, economic and sectoral responses (societal responses).
The Pressure-State-Response framework provides a means to select and organise data and indicators with an emphasis
on the relationships between the environmental, economic and social dimensions of sustainable development. This
enables decision-makers and the public to better track the state of the marine environment over time.

             PRESSURE                                STATE                              RESPONSE

                                                    Information

      Human Activities                             State of the                                Economic and
                              Pressures         Environment and          Information       Environmental Agents
        Unsustainable                           Natural Resources
      utilization of MUR                                                                      Administrations
                                                  Oceanography                                Households and
      Marine pollution
                                                                                               communities
                                                    Biodiversity                Social
      Disturbance and                                                       responses             Business
    physical modification     Resources         Human dimension             (Decision –
                                                                                                 Academics
       Invasive species                                                        Action)
                                                                                                International
       Climate change                                                                             NGO/IGO

                                          Social Responses (Decision – Action)

Figure 1. The Pressure-State-Response framework adapted for the BCLME

The SOMER begins with a general account of the BCLME in Chapter 2, followed by a description of the key
economic and social contributions of the BCLME in Chapter 3, highlighting the benefits derived from the ecosystem.
Unfortunately when humans enjoy these benefits they often put pressure on the ecosystem in various ways such as
through overfishing, marine pollution and disturbance of habitats – these pressures are described in Chapter 4. The
pressures impact on the health of the ecosystem, affecting the state and trends of certain key indicators including
water quality and biodiversity, as described in Chapter 5. Society’s responses to the pressures and their impacts are
summarised in Chapter 6, while Chapter 7 provides a discussion on future challenges and possibilities.

                                                         3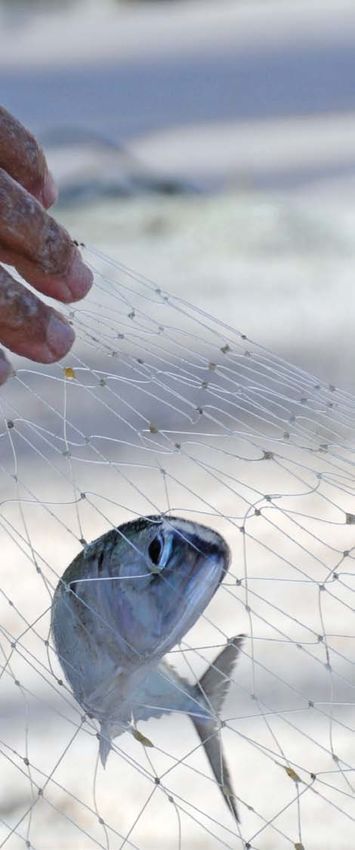
1.2    Limitations of the report

 Since this report is the first of its kind for the BCLME, at the time of writing the data and information collection and
 sharing procedures were still being established. This resulted in some gaps in information and data, primarily in
 relation to Chapter 3 (on economic and social contributions) and Chapter 5 (on state and trends). In some cases
 the data exist but a lack of agreed and implemented sharing protocols limited their availability. This limitation is a
 common obstacle and Chapter 6 (on responses) elaborates on this general problem in the BCLME. Establishing a
‘SOMER process’ – that is, a regular update of this report – will hopefully create a smooth, standardised and consistent
 procedure for data and information collection and sharing. This first SOMER is the beginning of this process.

1.3    Acknowledgement

The preparation of this SOMER has been coordinated by the Benguela Current Commission (BCC) with funding
support provided by the Government of Norway. The report was compiled and written by an NFDS Africa team
consisting of Sandy Davies, Antonia Hjort, David Boyer and Helen Boyer with support from Per Erik Bergh, Mark
Ssemakula, Peter Manning and Elsa da Gloria Pátria.

2      Understanding the BCLME

This Chapter provides a brief overview of the geographical scope, natural variability and features of the BCLME, as
well as its inhabitants and resources. Understanding the complexity of the BCLME is important for appreciating the
challenges and opportunities relating to this unique ecosystem.

2.1    The Benguela Current ecosystem

The Benguela Current ecosystem, also known as the “current of plenty”, is situated along the coast of south-western
Africa and stretches across the waters of Angola, Namibia and South Africa. It encompasses one of the four major
eastern coastal upwelling ecosystems of the world; the other three are the Humboldt, California and Canary systems. In
these ecosystems, due to interaction between wind movement and the rotation of the earth, surface waters are pushed
offshore causing deeper, colder, nutrient-rich waters to rise towards the surface to replace them. This is called upwelling;
a process that leads to high primary productivity that in turn supports large populations of marine organisms including
fish, marine mammals and seabirds. The mean annual primary productivity in the BCLME is 1.25 grams of carbon per
square metre per year – about six times higher than the North Sea ecosystem.

The upwelling system, in its current form, is about two million years old. It is the only major upwelling system bound
at both northern and southern ends by warm water systems, producing complex horizontal gradients or fronts. The
principal upwelling centre of the Benguela Current, situated near Lüderitz in southern Namibia, is regarded as the
most intense upwelling area in the world. The Benguela Current plays a role within the global climatic system as, for
example, it is connected to the Indo-Pacific Oceans through the El Niño southern oscillation, and it is positioned
at a major choke point in the global climate conveyor belt; a system that over centuries relocates cold, dense, high
salinity polar waters around the oceans of the world.

                         B C C S TAT E O F T H E MAR I N E E N V I R O N M E N T R E P O R T 2 0 1 4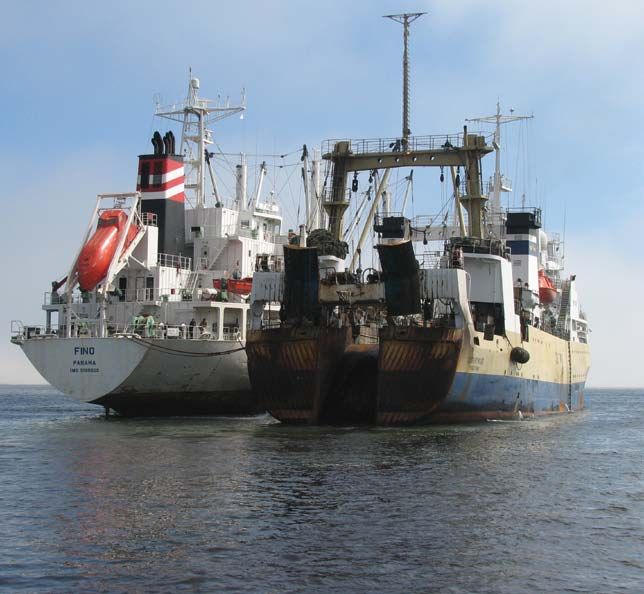
Non-living resources are also important elements of the Benguela Current ecosystem, with near-shore and off-shore
sediments holding rich deposits of precious minerals, particularly diamonds, as well as oil and gas reserves. Along
the coast, areas of outstanding natural beauty, such as the Namib Desert, one of the oldest deserts in the world, offer
opportunities for world class tourism.

It is not only natural forces that have shaped the Benguela Current ecosystem, human activities have also been
significant. Probably the most severe effect of human activity has been the decline in abundance of many of the
major living resources, primarily due to overfishing. This has been particularly severe in the northern Benguela,
where the once abundant small pelagic fish have been virtually removed from the system, resulting in major and
possibly irreversible shifts in community structure. Pollution from industries, poorly planned and managed coastal
developments, coastal and deepwater mining activities and marine transport, particularly of oil products, have, and
are, resulting in rapid changes and in some cases degradation of some of the more vulnerable coastal habitats.

                       Key:
                              Warm current
                              Cold current

Figure 2: The BCLME and some of its major physical dynamics illustrating the complexity of this system

                                                            5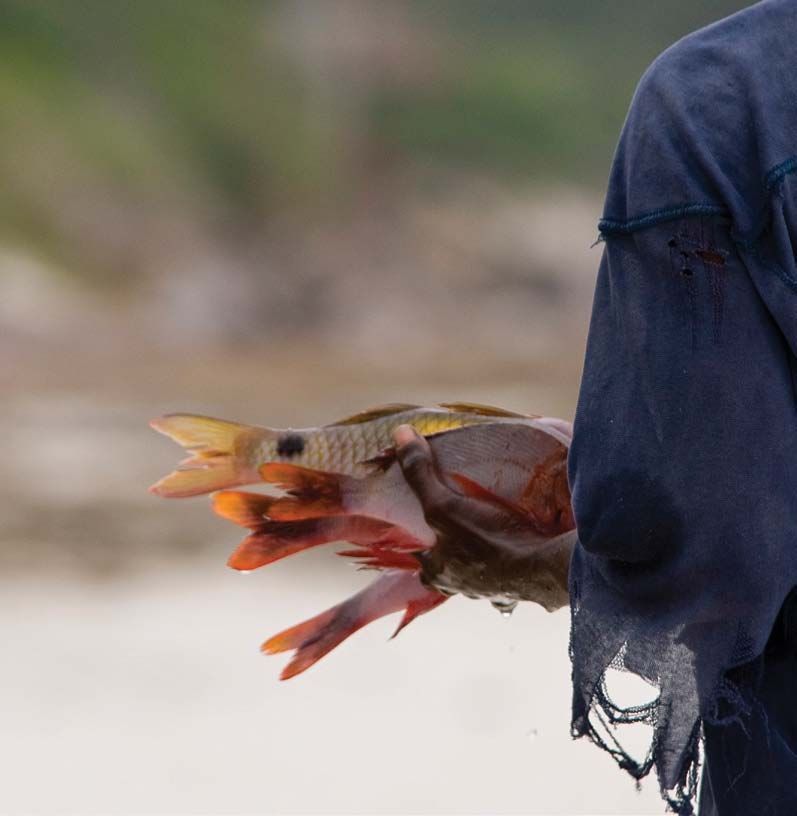
2.2       The geographical scope and ecosystem boundaries

The geographical boundaries of the BCLME are:
•      Landward boundary is the high water mark at the coast.
•      Offshore boundary is, for practical management purposes, the outward boundary of the Exclusive Economic
       Zones (EEZs) of the three countries, which extend to 200 nautical miles seaward from the land, although from an
       oceanographic perspective the Benguela Current extends beyond the EEZs.
•      Northern boundary is the well-defined sub-surface Angola Front at 5°S, which is in the vicinity of the northern
       border of Angola (Cabinda) and the southern extent of the Guinea Current Large Marine Ecosystem.
•      Southern/eastern boundary extends around the Cape of Good Hope to 27°E longitude, approximately Port
       Elizabeth. This part of the ecosystem interacts with the warm Agulhas Current, which is part of the Agulhas-
       Somali Current Large Marine Ecosystem.

2.3       Natural variability

The biota of the BCLME is naturally adapted to its highly variable environment, although compared with the
equivalent upwelling system in the Pacific, the inter-annual variability in the Benguela is relatively small and major
environmental anomalies are less frequent but less predictable. Many of the large-scale environmental events within
the BCLME originate from outside of the region but they often affect the ecosystem as a whole, compounding the
effects of fishing and other anthropogenic activities.

There are three major types of variability and change in the Benguela oceanographic system:

•      Sustained intrusions of unusually warm and nutrient-poor equatorial/tropical water across the northern and
       southern boundaries of the ecosystem.

•      Large scale changes in wind intensity, direction and frequency, leading to changes in the intensity and spatial
       distribution of upwelling, including the position of the upwelling/oceanic fronts, warming or cooling of large
       areas of the system, altered stratification of the water column, as well as changes in advection1.

•      Changes in the composition and advection of subsurface waters, particularly changes in the concentrations of
       dissolved oxygen in the poleward undercurrent.

This large-scale variability is further exacerbated by localised smaller-scale events:

•      Natural hypoxia, which is primarily linked to upwelling systems and occurs when high rates of primary production
       result in blooms of phytoplankton which subsequently die, with the process of decomposition stripping dissolved
       oxygen from the water. Hypoxia is further exacerbated by the influx of oxygen-poor water from the Angola Dome
       region. In inshore waters this can lead to massive mortalities of marine organisms. Although the impacts of hypoxia
       have long been recognised in coastal upwelling systems, the underlying triggers and responses remain largely
       unpredictable.

•      Harmful algal blooms (HABs), which are dense blooms of toxic phytoplankton, often dinoflagellate species. The
       harmful effects of these blooms are manifested in two main ways: production of toxins which cause mortalities
       of shellfish, fish and other organisms (including occasionally humans); and hypoxia as described above.

2.4       The BCLME inhabitants

As one of the most productive areas of ocean in the world, the BCLME supports a large biomass of fish, crustaceans,
sea birds and marine mammals. The BCLME’s highly variable environment favours the presence of few generalist
species, while at the same time high productivity supports large abundances of these species. The overall pattern of
biodiversity is one of low species richness along the South African west coast and in particular the Namibian coast,
with increasing species richness along the Angolan coast and the South African east coast. The number of endemic
species (species found only in a particular locality) is low; for example less than 1 % of Namibia’s marine species are
endemic, although this is undoubtedly somewhat higher in the warmer extremes of the BCLME.

1
    Advection is the horizontal movement of a large body of water, including its properties such as temperature, salinity, oxygen.

                               B C C S TAT E O F T H E MAR I N E E N V I R O N M E N T R E P O R T 2 0 1 4
1 200

                                 1 000

                                  800
             Number of species

                                  600

                                  400

                                  200

                                    0    1   2   3 4   5   6 7   8   9 10 11 12 13 14 15 16 17 18 19 20 21 22 23 24 25 26 27 28

                                                                     100 km units around the coast

Figure 3: Number of species recorded from each 100 km unit around the coast of South Africa from the Orange
River (1) bordering with Namibia to the Mozambique border (28) Cape Town is in unit 9

                                                 THE MAIN FISHERY SPECIES OF THE BCLME

     The high productivity of the Benguela Current                                for orange roughy (Hoplostethus atlanticus).
     supports abundant fish stocks. Pelagic fisheries                             Angolan demersal fisheries are largely based on
     in the region target anchovy (Engraulis capensis),                           Cape and Benguela hakes (M. capensis and M. polli),
     sardine (Sardinops sagax), Cape and Cunene                                   Dentex spp. and red pandora (Pagellus belloti). Red
     horse mackerels (Trachurus capensis and T. trecae)                           crab (Chacean maritae), deep-water rose prawn
     and round herring (Etrumeus whiteheadi), while                               (Parapenaeus longirostris) and striped red prawn
     Angolan fisheries additionally target sardinellas                            (Aristeus varidens) are important components of
     (Sardinella aurita and S. maderensis). The demersal                          the Angolan crustacean fishery. Red crab is also
     fisheries of Namibia and South Africa are largely                            taken in Namibian waters. A large fishery exists for
     based on Cape and deep-water hakes (Merluccius                               west coast rock lobster (Jasus lalandii) in Namibia
     capensis and M. paradoxus). A number of bycatch                              and South Africa. The line-fishery in the Benguela
     species are also important components of the hake                            Current region includes an enormous array of
     fisheries, including adult horse mackerel, monkfish                          species, from highly resident and range-restricted
     (Lophius vomerinus and L. vaillanti), kingklip                               reef-associated fishes to large, highly-migratory
     (Genypterus capensis), west coast sole (Austroglossus                        species such as tunas and billfishes. The line-fishery
     microlepis) and snoek (Thyrsites atun). Some of                              consists of a number of “sectors”, ranging from
     these bycatch species, notably monk and kingklip                             subsistence and artisanal fisheries to recreational
     are also targeted. There was also, briefly in the                            and fully commercial fisheries.
     1990s, an important demersal fishery in Namibia

                                                                              7
2.4.1 Human population distribution in the BCLME

Much of the BCLME coastline is sparsely inhabited by a wide range of peoples with different cultural backgrounds.
The area also hosts two of the largest cities in Africa; Cape Town with around three and a half million people and
Luanda with over five million, making it the sixth largest city in Africa and the 42nd largest city in the world. These
two cities, situated at opposite ends of the BCLME, together with some of the smaller communities, such as Walvis
Bay in Namibia, offer access to the region for tourism and the utilisation of both the living and non-living resources.
The BCLME countries have in the past suffered colonialism, civil war and apartheid but in recent decades have made
significant economic and social progress; they are however at different stages of human and economic development.
The south coast from Port Elizabeth to Cape Town is the most densely developed part of the BCLME coastline, with
two cities (Port Elizabeth and Cape Town), six major towns and over 66 small towns, villages and resort developments.
The west coast from Cape Town to Luanda is relatively sparsely populated due to a combination of the aridity of
the climate, topography and access restrictions due to mining or conservation. There are three exceptions: in the
extreme south-west, where there is an almost continuous strip of coastal development for 150 km from Cape Town
north to Velddrif, along the 40 km section of coast between Walvis Bay and Swakopmund, and around Luanda. These
metropolitan areas are all experiencing growth, with Luanda expecting a 50 % increase in population in the next decade;
the other cities and towns are growing at relatively slower rates (e.g. Saldanha Bay 7 %, Walvis Bay 5 %, Cape Town 2 %).
Outside of these urban centres the density of coastal development decreases as one moves northwards from the
Cape up to southern Angola, reflecting the increasingly arid conditions. There are approximately 28 villages and
resorts along the South African west coast, at a density of one every 23 km. In Namibia, there are only four towns and
two villages along the entire 1 570 km of coast, giving a density of one every 260 km. This low settlement density
persists into southern Angola, but as one moves northwards, and as the environment becomes less arid, the density
increases. Along the approximately 1 060 km coastline between the Kunene River mouth and Luanda, there are five
towns with a population of over 50 000, three smaller towns (population between 10 000 and 50 000) and more than
20 small villages, giving a density of approximately one settlement every 37 km.

      2.4.2        The main ports

Cape Town is situated on one of the world’s busiest trade routes and therefore has strategic and economic importance
for South Africa and the BCLME as a whole. It is a busy container port, and fishing is also a significant economic activity,
affecting the ship repair industry in particular, with large Asian fishing fleets using Cape Town as a transhipment,
logistics and repair base and for bunkering. The emerging oil industry in West Africa (including Angola) uses Cape Town
extensively for rig repair and maintenance, while the port also provides the main logistical services for the deep sea
diamond mining vessels. Cape Town is also a popular call for cruise ships, despite the port lacking a dedicated passenger
receiving facility.
The next main port along the Benguela coastline is Walvis Bay in Namibia. Walvis Bay is Namibia’s largest commercial
port, receiving approximately 3 000 vessel calls each year and handling about five million tonnes of cargo. It is a
sheltered deepwater harbour and it is regarded as one of the most efficiently operated ports on the continent. The
facilities are being upgraded and the channel is being deepened to cater for larger vessels and to strengthen access to

                         B C C S TAT E O F T H E MAR I N E E N V I R O N M E N T R E P O R T 2 0 1 4
the road and rail corridors such as the Trans-Kalahari and the Trans-Caprivi Highways which connect the Atlantic to the
interior of southern Africa. Luanda has an excellent natural harbour, with the depth exceeding 20 m when dredging
takes place regularly, although currently the draught is only 10.5 m, allowing a maximum vessel size of about 30 000
deadweight tonnes. Even though the port has recently undergone an expansion, it experiences serious congestion
and with high port-handling charges this makes it costly to use, resulting in much potential traffic using Walvis Bay.
3 Economic and social value of the coastal and marine environment
This chapter provides a general overview of the relative economic and social contributions of each of the sectors and
industries active in the BCLME. Economic analysis of the BCLME is poorly developed and data are sparse for many
sectors. Values that do exist often differ considerably and are rarely well supported with information on how values
were derived. Therefore, limited figures have been included in this Chapter and any data included should be used
with caution. Even without figures, it is evident that the BCLME is of great economic value to the region. The main
economic activities of the BCLME and the key countries benefiting from the economic benefit/income are:
• Petroleum: dominated by Angola.
• Coastal mining: dominated by Namibia.
• Fisheries: dominated by Namibia and South Africa.
• Mariculture: dominated by South Africa.
• Marine recreational activities: dominated by South Africa.
The petroleum sector is by far the largest in terms of total economic income, resulting in Angola enjoying the largest
proportion of the economic benefits from the resources of the BCLME. However given that petroleum is a non-
renewable resource – unlike e.g. fisheries – this relative contribution may change in the future. Below follows a brief
overview of how the different sectors benefit the BCLME countries.
3.1 Petroleum and gas
Angola economy is largely dependent on
VALUATION OF
oil production with oil revenue accounting
SOUTH AFRICA’S COASTAL RESOURCES
for almost 80 % of total government revenue
and grants in 2011. Oil production currently
comes almost entirely from offshore fields off South Africa’s coastal resources were valued at nearly
the coast of Cabinda and deepwater fields in 4 % of the country’s gross domestic product (GDP)
the Lower Congo basin. There is currently only in 2011 (ZAR 85 billion). This included contributions
small-scale production from onshore fields due from fishing, coastal tourism, ports and harbours. For
to past conflict, which has limited exploration example, the beaches around Cape Town had an
and production. From 2002 to 2008, Angola’s oil estimated recreational value of between ZAR 70 and
production grew by an annual average of more ZAR 86 million per year (in 2009), and each year ZAR
than 15 %. In 2013, Angola produced 1.8 million 6 billion worth of fish is harvested, providing 27 000
barrels per day of petroleum and other liquids, of jobs to people in the commercial sector, while another
which more than 1.7 million barrels per day was 28 000 households are involved in subsistence fishing.
crude oil. The net oil export revenues in 2012
were estimated at USD 68 billion.
Angola has the second-largest amount of proven natural gas reserves in Sub-Saharan Africa, however, in terms of
actual production it ranked eighth in the region in dry natural gas production in 2012. The majority of Angola’s natural
gas production is associated with oil fields and is vented, flared (burned off ) or re-injected into oil wells. Angola’s first
liquefied natural gas plant started operations in 2013 to commercialise the country’s natural gas resources, but it is
currently producing well below its capacity of 5.2 million tonnes per year due to technical difficulties.
The Orange River Basin, at the border between Namibia and South Africa, is believed to hold substantial oil and
gas reserves, but despite several decades of exploration in Namibia no commercial oil or natural gas production has
occurred to date.
9South Africa has no significant crude oil production and synthetic fuels represent almost all of South Africa’s domestic
liquid fuel production, amounting to 192 100 barrels per day of non-conventional synthetic liquids from coal and
natural gas in 2010. South Africa has very limited natural gas reserves, mostly from the offshore fields in the vicinity of
Mossel Bay, although the infrastructure for new fields is currently being developed. Furthermore, South Africa could
contain significant shale gas resources, though the sector is currently only in the early stages of development and
exploration plans have been put on hold due to environmental concerns (resulting in a moratorium on licensing and
exploration in 2011).
3.2 Mineral mining
The only coastal mining currently occurring is in Namibia and South Africa for alluvial diamonds. In Namibia, since
the early part of the twentieth century, beach terraces have been mined for diamonds along with small-scale shallow
water operations, while offshore industrial mining operations, underway since the 1960s, have recently ceased.
Namibian offshore concessions cover the entire length of the coastline, from the Orange River in the south to the
Kunene in the north, and offshore to the shelf-break, although all mining is currently limited to the Lüderitz region
and southwards to the Orange River mouth. In South Africa, coastal alluvial mining is undertaken in the Northern
Cape and Western Cape provinces and offshore mining on the west coast with diamond concessions stretching from
the border with Namibia to an area just south of Saldanha Bay and from low water to 500 m depth. In 2010, South
Africa produced 33 000 carats compared to an annual yield of around 2 million carats in Namibia.
Phosphate mining involves the extraction
of ores with a high composition of phosphate
for use in chemical fertilizers, animal feed
supplements, phosphoric acid and additives NAMIBIA’S DIAMONDS
in products such as toothpaste and soft drinks.
Offshore phosphate deposits occur on the Namibia’s coastal area contains the world’s richest
continental shelf stretching from Port Elizabeth marine diamond deposits and is estimated to hold
to northern Namibia and beyond. These deposits 80 million carats of diamonds. These are alluvial
consist of scattered nodules lying at depths of diamonds, washed into the sea by the Orange
100 to 1 000 m. The nodules are of low grade River. The sector contributed more than NAD
compared to land-based deposits and were 2.5 billion in royalties, taxes and dividends in 2013
until recently deemed uneconomic to mine. and is Namibia’s biggest foreign exchange generator,
However, due to the growing global demand contributing 20 % of foreign earnings. NamDeb –
for food and the resultant recent expansion the main diamond producing company co-owned
of the agricultural sectors in China, South-east by the Namibian Government and De Beers –
Asia and Latin America, the demand for fertilizer, is the country’s second largest employer and the
and hence phosphate, has increased. Between largest taxpayer (the Namibian Government is the
2007 and 2008 the price of phosphate rock largest employer). In 2013, it produced 1.76 million
concentrate increased from USD 80 to USD 430 carats, the majority of which came from the marine
per tonne, resulting in the reappraisal of known mining unit, Debmarine (contributing 1.16 million
marine deposits. Although the market has carats). Namibia produces about 2 % of the world’s
stabilised at USD 200 per tonne this has made gem quality diamonds.
the mining of phosphates more economically
attractive, with proposals for bulk seabed mining
of phosphates along the central Namibian
coastline being submitted and interest in
marine phosphate mining being aired in South
Africa. One area of interest is the Sandpiper
Deposit, located on the Namibian continental
shelf, approximately 120 km south-south-west
of Walvis Bay. Namibian Marine Phosphate
(Pty) Ltd (NMP) has obtained a Mining Licence
for the Sandpiper Project, however due to lack
of clarity about the environmental impacts, an
18 months moratorium was imposed on marine
phosphate mining in Namibia in September
2013, pending the results of an environmental
impact study.
B C C S TAT E O F T H E MAR I N E E N V I R O N M E N T R E P O R T 2 0 1 4Kunene River Phosphorite
Cape Fria (weight %)
>20.0%
20°S
Palgrave Point 5.0 - 19.9%
0.0 - 4.9%
Walvis Bay
Meob Bay
25°S
Lüderitz
Orange River
30°S
Hondeklip Bay
Oli
fan
ts R
ive
r
Cape Columbine
Atlantic Ocean
Cape Town
35°S
10°E 15°E 20°E
Figure 4. The abundance of phosphorite on the middle to outer shelf (from Rogers & Bremner 1991; in Namibian
Marine Phosphate (Pty) Ltd., Environmental Impact Assessment Report – Dredging of marine phosphates from
ML 170, Chapter 4: Description of the Environment)
3.3 Capture fisheries
The fisheries sectors of Angola and Namibia are of high national importance, in Angola for local food production and
in Namibia for export from the industrial fishery. In South Africa fisheries are locally important in terms of revenue,
food and employment, especially along the coastal area of the Western Cape Province.
In Angola, fisheries represented about 1.7 % of the GDP in 2012 with total production estimated at about 277 000
tonnes (mainly from the southern coastal provinces of Namibe and Benguela which benefit from the Benguela
Current). A little more than half of the marine catch came from the industrial and semi-industrial sectors in 2009,
while the remainder was caught by artisanal fisheries. It has been estimated that around 100 000 persons derive a
living, directly or indirectly, from fisheries or aquaculture in Angola, although this is likely to be an underestimate
due to a lack of data in some regions. Angola relies on imports of fish and fish products to supplement domestic
production; in 2011 these imports were estimated at about USD 180 million while exports were USD 12 million.
Angolan per capita consumption of fish is relatively high at around 15 kg while the contribution of fish to total animal
protein intake is about 22 % compared with a global average of 17 %.
11Namibia’s marine fisheries catch was 411 140 tonnes in 2011 and this provided about 13 400 jobs, with fish exports
valued at USD 393 million. Namibian per capita consumption of fish in 2011 was 12 kg, while the contribution of fish
to total animal protein intake was 16 %.
The reported South African marine catch for 2011 was 526 450 tonnes and exports that year were valued at
USD 518 million. The dominating South African fisheries in terms of volume and value are the demersal hake trawl
fishery and the small pelagic purse seine fishery for anchovy and sardine. These are primarily based on the South
African west coast, operating from the ports of Cape Town, Saldanha and St. Helena Bay, thus approximately 90 %
of the contribution to the national fishing industry is derived from the Western Cape region. The contribution of
fisheries to the South African economy (GDP) was approximately USD 323 million in 2008. Employment in the coastal
communities, including subsistence and artisanal fisheries, is also significant. Although fish does not play a major
role in food security in South Africa, some local coastal communities depend on fishing as a subsistence activity. Per
capita consumption of fish in 2011 was relatively low at 6 kg, while the contribution of fish to total animal protein
intake in South Africa was 5 %, although for coastal communities these figures will doubtless be much higher as fish
for consumption is more readily available.
3.4 Tourism and marine recreational activities
Tourism is a significant generator of revenue and employment for Namibia and South Africa, while Angola’s tourism
industry is relatively new and underdeveloped. In 2012 the number of international tourists visiting South Africa
surpassed nine million, the majority of whom visit the Cape region. The Western Cape tourism industry, which is
concentrated along the coastal area, is a major employer and driver of economic growth, contributing around
USD 1.3 billion to the region’s economy and employing over 150 000 people. Tourism in Namibia is also a major
industry, contributing USD 0.5 billion to the country’s GDP, with nearly one million tourists visiting Namibia annually.
Data on the proportion of tourists visiting the Namibian coastline are not readily available, but clearly this sector is an
important contributor to the Namibian coastal economy. The relevance of tourism to the BCLME is mainly related to
conservation of the biodiversity and health of the ecosystem that underpin the attraction for tourists to the region.
Tourism is likely to continue to increase throughout the region especially along the Angolan coast. The emerging
recreational fishing sector, aimed primarily at adventure anglers wanting to catch the giant tarpon, a powerful game
fish which can weigh more than 100 kg, is already developing, and other tourism sectors will undoubtedly follow.
Marine recreational activities in the BCLME primarily revolves around recreational fishing and general appreciation
of the ocean and the seascape, although marine mammal watching, and snorkelling and scuba diving are becoming
increasingly popular, especially in South Africa. A recent study estimated the economic and social contributions of
recreational fisheries in the region and suggested that South Africa gains the majority of the economic benefits,
USD 94 of the total USD 125 million of total economic impact. The sector employs nearly 1 300 people in the region,
and almost half a million people participate in the activity each year.
B C C S TAT E O F T H E MAR I N E E N V I R O N M E N T R E P O R T 2 0 1 43.5 Mariculture
Whereas freshwater aquaculture is mainly seen as a potential source of food security in the region, and is mainly
targeted at rural communities, mariculture (marine aquaculture) is primarily being promoted as a source of high
value fishery products for export as it is capital and technologically intensive.
Aquaculture production is modest in Angola and the only current production is based inland. Yet the Angolan coast’s
potential is extensive and favourable for mariculture, with the most suitable areas being lagoons and mangroves.
Native species of coastal prawn and lobster are likely to prove suitable for mariculture while non-native oysters
and mussels may have potential, with the testing of cultured mussels already showing promising results. Prawn
mariculture projects are planned in coastal provinces, in some cases using exotic species.
In Namibia, the Government is encouraging the industry to diversify fishing operations into fish farming. However
the potential for large scale mariculture is not certain and to date projects have focussed on high value marine species
intended for export markets. The Namibian Government estimated that the value of the industry would grow to
NAD 250 million in 2009, with direct employment of more than 1 640 people. There are four well established oyster
farms with Pacific (Crassostrea gigas) and European (Ostrea edulis) oysters in the Walvis Bay/Swakopmund area. In 2004
the estimated production of the Namibian oyster industry was six million oysters, worth approximately NAD 12 million.
Mussel and abalone (Haliotis midae) are farmed in Lüderitz. New techniques are being developed; for example, in
Oranjemund in southern Namibia, the Namdeb mining company and the NovaNam fishing company have established
a land-based fish farm that uses seawater in abandoned beach diamond mining ponds.
Although the South African industry is still considered to be in its infancy, it is the most established of the three
BCLME countries. Species with the greatest future potential are considered to be abalone, oysters and mussels.
Currently, the majority of mariculture activities are concentrated in the Western Cape Province. As in Namibia, other
sectors are getting involved in diversifying the local economy. For example, De Beers has developed an experimental
oyster farm within the Namaqualand mining area. This type of project has the potential to provide employment to
local communities as well as to stimulate downstream investment and economic multiplier effects. Such projects
offer opportunities of alternative livelihoods in areas where some diamond mines are nearing the end of their
productive lifespan. These mining operations will leave infrastructure that in some cases could be converted for
marine aquaculture operations. Other projects include two aquaculture initiatives involving local communities on the
west coast that support fishermen who can no longer make a living by going to sea.
Estimates regarding the current economic and social contribution of the mariculture sector in the BCLME region
suggest that South Africa again enjoys the greatest share of the economic benefits – namely USD 36 million of the
USD 50 million of total economic impact in the region in a year.
3.6 Marine transport
Marine transport is a major industry for South Africa with an annual container throughput of three million twenty-
foot equivalent units (TEUs). Namibia has an annual container throughput of 250 000 TEUs while Angola does not
record this information. South Africa’s Cape of Good Hope is a significant transit point for oil tanker shipments across
the globe; in 2011 the Cape route accounted for roughly 11 % of global seaborne traded oil, or 6 % of oil traded
worldwide, with approximately five million barrels of oil moving through the Cape each day in 2012. The emergence
of Angola as a leading African oil producer is likely to increase the number of large tankers traversing the BCLME.
3.7 Salt production
All three countries produce salt to a varying degree. In Namibia, two companies harvest salt near Walvis Bay and
Swakopmund. In South Africa, the main seawater salt producers are located at the mouth of the Sout Rivier and
Velddrif in the Western Cape. In Angola, there are numerous small coastal salt works along the coast, although
satellite images suggest that some may have been abandoned.
3.8 Desalination
In South Africa, a desalination plant was completed in Mossel Bay in 2011 at a cost of ZAR 200 million in response to
recent droughts. It has the capacity to desalinate 15 million litres of sea water a day. It is not currently being used due
to sufficient rains but it provides a security against future droughts. In Namibia, one desalination plant is in place
and a second is planned for Namibia’s coastal region. Both are situated to the north of Swakopmund and provide
13water for nearby uranium mines. South Africa and Namibia are expected to experience shortages of freshwater in
the next decade and therefore may require more seawater desalination projects in the short to medium term. For
example, a plant is proposed for Saldanha Bay, while others have been discussed for all of Namibia’s coastal towns.
4 Major pressures affecting the coastal and marine environment
The purpose of this Chapter is to describe how different human activities in the BCLME put pressure on the overall
ecosystem health in different ways. Different activities may also interact in ways that potentially exacerbate or reduce
the overall pressure. Five key man-made pressures affecting the BCLME are described: unsustainable utilisation of
living marine resources, marine pollution, disturbance and physical modification of coastal and marine habitats,
invasive species, and climate change. Each of the economic activities described in the previous chapter contributes
to at least one of these pressures.
EXAMPLES OF THE T YPES OF PRESSURES RELATED TO DIFFERENT HUMAN AC TIVITIES
Petroleum and gas Marine transport
• Marine pollution • Invasive species
• Disturbance and physical modification • Marine pollution
of coastal and marine habitats • Disturbance and physical modification
• Climate change of coastal and marine habitats
• Climate change
Mineral mining
• Marine pollution Salt production
• Disturbance and physical modification • Marine pollution
of coastal and marine habitats • Disturbance and physical modification
• Climate change of coastal and marine habitats
Capture fisheries Mariculture
• Unsustainable utilisation of • Invasive species
marine living resources • Marine pollution
• Disturbance and physical modification
of coastal and marine habitats Tourism
• Climate change • Marine pollution
• Disturbance and physical modification
Desalination of coastal and marine habitats
• Marine pollution • Unsustainable utilisation of
marine living resources
• Climate change
B C C S TAT E O F T H E MAR I N E E N V I R O N M E N T R E P O R T 2 0 1 44.1 Unsustainable utilisation of marine living resources
Overexploitation of fish and other living resources has been severe in the region, such that many fishery resources
are well below their maximum level of productivity, with some stocks so severely depleted that they may never
recover. Of all the human activities in the BCLME, overexploitation has had the largest impact and remains a pressure
of considerable concern.
Commercial fishing in the region started around 1900 with a rapid expansion in the 1960s and 1970s, especially by
foreign fleets. There was a peak in catches of more than three million tonnes in 1968, a figure that fell to around one
million tonnes per year by the 1990s. At this time, in the late 1980s and early 1990s, the three countries of the BCLME
underwent enormous political transformations, with civil war ending in Angola, the war of independence ending in
Namibia and the apartheid policy ending in South Africa, resulting in democratically elected governments in all three
countries. While South Africa already had a well-developed fisheries research and management structure, this was
the first time that Namibia and Angola were able to attain full management control of their living marine resources.
This new opportunity to take control of their fisheries and reduce fishing pressure was supported by policies, laws
and regulations adapted from internationally accepted best-practice. One of the main aims was to limit fishing effort
to be in line with stock sizes through an approach known as setting total allowable catches. This approach largely
followed scientific advice, as did other measures implemented, to reduce bycatch (of small fish and other species),
to protect breeding fish and to minimise impacts on the wider ecosystem. The assessment of stocks developed,
both in terms of direct research surveys and mathematical modelling, often assisted by countries with recognised
expertise in fisheries research, while management structures were strengthened, once again with the support of the
global community. Capacity building (training) became the cornerstone of developing research and management
capabilities. With greatly improved means of stock assessment and quota setting, as well as stricter enforcement to
reduce incidences of illegal fishing, especially poaching, many of the fisheries of the BCLME are now well managed.
However, despite initial optimism, recovery of many of the overfished stocks has not occurred, and indeed some
stocks have continued to decline with commercial overfishing still remaining a concern and pressure to the BCLME.
Recreational fishers target many species in common with the commercial line-fisheries, and the recreational catch
per unit of effort has also undergone a marked decline over the past two decades. In spite of this, recreational
angling has been one of the fastest growing sports in the last decade, thus producing an increasing pressure on the
fish stocks. Although fishing pressure exerted by recreational anglers may to some degree be reduced if catch rates
go down, in general they are not greatly affected by overall stock condition as there is no need to make a profit or to
supply food. Fishing effort, mostly comprising leisure time, carries very little cost to recreational anglers, a situation
that invites overfishing.
Subsistence fishers generally live close to where they harvest and harvest over relatively short sections of coast. In
fisheries with a large number of participants and/or where starting to fish doesn’t require a large capital investment,
perhaps only a hook or homemade trap basket, the situation is prone to overfishing. Although local indigenous
management systems were in place in pre-conflict times, many of these community driven management systems
have now broken down and the centralised government management approaches are not adequately implemented,
resulting in many subsistence fisheries operating outside of sustainable limits or with limited knowledge on the
status of the stocks.
15You can also read