Market and Trade Profile: Southeast Asia - Focus on Singapore, Malaysia, Indonesia, Thailand, and other Southeast Asian countries - Visit Britain ...
←
→
Page content transcription
If your browser does not render page correctly, please read the page content below
Market and Trade Profile Southeast Asia

Market and Trade Profile:
Southeast Asia

Focus on Singapore, Malaysia,
Indonesia, Thailand, and other
Southeast Asian countries
Market and Trade Profile Southeast Asia

Overview

•      This market profile provides topline statistics about visitors from Southeast Asia, and
       more details about VisitBritain’s main markets in that area: Singapore, Malaysia,
       Thailand, Indonesia, and also the Philippines and Vietnam for some sections.
•      Chapter 1: Inbound market statistics provides insights on key statistics about
       Southeast Asian travellers and who they are. It takes a look at Britain and its
       competitive set as well as activities of Southeast Asian visitors in the UK.
•      Chapter 2: Understanding the market takes a close look at Southeast Asian
       consumer trends, booking, planning and further travel behaviour of this source
       market. Perceptions of Britain held in Southeast Asia are also highlighted.
•      Chapter 3: Access and travel trade shows how Southeast Asian residents travel
       to the UK, how to best cater for their needs and wants during their stay and gives
       insights into the Southeast Asian travel trade. Further ways of working with
       VisitBritain and other useful research resources are pointed out.

*Southeast Asia refers to Brunei, Cambodia, Indonesia, Laos, Malaysia, Myanmar (Burma), Philippines, Singapore, Thailand, Timor Leste (East Timor) and Vietnam. Data on inbound
visits to the UK from Southeast Asia aggregates these markets together unless otherwise stated.
                                                                                                                                                                                  2
Market and Trade Profile Southeast Asia

Contents
Chapter 1:
Market statistics
   1.1 Key statistics                  6
   1.2 Visitor demographics           18
   1.3 Britain & competitors          21
   1.4 Inbound activities             24

Chapter 2:
Understanding the Market
   2.1 Structural drivers             31
   2.2 Consumer trends                35
   2.3 Booking and planning           40
   2.4 Reaching the consumer          43
   2.5 Perceptions of Britain         47

Chapter 3:
Access and Travel Trade
   3.1 Access                         53
   3.2 Travel trade                   57
   3.3 Caring for the consumer        63
   3.4 Working with VisitBritain      66
   3.5 Useful resources               67

Appendix
Individual inbound market overviews   69

                                                                                     3
Market and Trade Profile Southeast Asia
Chapter 1:
Inbound market
statistics
4Market and Trade Profile Southeast Asia
Chapter 1: Inbound market statistics
Chapter summary
• Southeast Asia is a valuable source market for the UK’s
tourism. This region is diverse, though, and some of its 2016:
differences can show up in visits to the UK. For example, a
higher share of visits from residents of Thailand and
Singapore were made by British nationals coming back to
£768m
the UK, which influences the journey purpose pattern.
• Visitors from Southeast Asia stay longer on average and
spent in
boast relatively good seasonal and regional spread. The
summer months from July to September are still the most
the UK
popular and London remains the most visited city though.
• The main activities undertaken in the UK include dining in
restaurants, shopping and visiting parks or gardens.
• The United Kingdom is overall the most visited country in
Europe from Southeast Asia. However, despite good growth
prospects for visits, the UK’s share of outbound visits is
forecast to decrease slightly. Visits from one Southeast
Asian country to another account for around two thirds of all
outbound tourism from this region.
Source: International Passenger Survey by ONS, Oxford Economics (outbound overnight trips)
5Market and Trade Profile Southeast Asia
Chapter 1.1: Key statistics
Key insights
• Inbound visits, spend and nights from Southeast Asia to the
UK have all showed strong growth over the last ten years,
with visits growing each year since 2009.
• Considered all together as one source market, Southeast
9th
Asian countries would be in the top 10 most valuable most valuable
inbound markets to the UK in 2016: those markets are inbound market
valuable visitor markets with spend per visit over twice the for the UK (2015)*
all-market average in 2014-2016.
• Most Southeast Asians who visit the UK come for holidays
(about 4-in-10 visits in 2014-2016), or for visiting friends and
relatives (about 3-in-10). Holidaymakers tend to spend more
per night than the average Southeast Asian visitor. Some
markets, though, show a slightly different split: visitors from
Thailand are the most likely to be British nationals and also
have a higher propensity to be visiting friends and relatives.
• Visits to the UK from Southeast Asia tend to be well spread
between April and December mainly. They are also more
likely to explore around the UK, spending more time than the
all-market average in Northern England and the Midlands,
although London is still the most visited city in the UK.
Source: International Passenger Survey by ONS, Oxford Economics (outbound overnight trips)
*If considered as a single market (as standard, inbound rankings do not consider Southeast Asia as a single market)
6Market and Trade Profile Southeast Asia
1.1 Key statistics: global context
Global context (2016)
Measure Southeast Singapore Malaysia Thailand Indonesia Philippines Vietnam
Asia
International tourism
n/a 22.1 10.5 9.1 7.7 11.2 4.6
expenditure (US$bn)
Global rank for
international tourism n/a 12 27 32 36 26 45
expenditure
Number of outbound
69.0 20.8 11.2 10.1 9.7 7.0 4.6
overnight visits (m)
Most visited
outbound destination Malaysia Malaysia Thailand Malaysia Malaysia China Cambodia
overall
Most visited
United United United United
destination in Switzerland Netherlands France
Kingdom Kingdom Kingdom Kingdom
Europe
Source: UNWTO, Oxford Economics
7Market and Trade Profile Southeast Asia
1.1 Key statistics: 10 year trend
Inbound travel to the UK overview
Measure Visits Nights Spend
(000s) (000s) (£m)
10 year trend
2007 327 4,958 289
2008 303 4,271 264
2009 355 5,936 438
2010 386 6,029 457
2011 407 6,304 486
2012 416 6,283 523
2013 473 6,269 683
2014 526 6,753 643
2015 564 7,402 786
2016 570 7,752 768
Share of UK total in 2016 1.5% 2.8% 3.4%
Source: International Passenger Survey by ONS
8Market and Trade Profile Southeast Asia
1.1 Key statistics: latest figures
Inbound travel to the UK overview
Measure Southeast Singapore Malaysia Thailand Indonesia
Asia
Visits (000s, 2016) 570 188 183 77 52
• Rank out of UK top markets • 17th* • 34th • 37th • 51st • 55th
Nights (000s, 2016) 7,752 2,355 2,033 1,235 837
• Rank out of UK top markets • 13th* • 28th • 33rd • 42nd • 50th
Spend (£m, 2016) 768 277 198 88 79
• Rank out of UK top markets • 9th* • 21st • 27th • 44th • 47th
Nights per visit (2014-2016)
• Overall • 13 • 10 • 13 • 16 • 14
• Holiday • 8 • 8 • 7 • 11 • 7**
Spend per night (2014-2016)
• Overall • £100 • £148 • £85 • £75 • £101
• Holiday • £129 • £142 • £123 • £126 • £131**
Spend per visit (2014-2016)
• Overall • £1,323 • £1,516 • £1,079 • £1,188 • £1,406
• Holiday • £1,041 • £1,111 • £843 • £1,414 • £965**
Source: International Passenger Survey by ONS
*If considered as a single market (as standard, inbound rankings do not consider Southeast Asia as a single market)
** Lower sample size (70)
9Market and Trade Profile Southeast Asia
1.1 Key statistics: journey purpose
Journey purpose 2014-2016 Journey purpose trend (visits 000s)
Share of Holiday Business VFR Study Misc. 300
visits for…
250 249
Singapore 41% 25% 27% 2% 5% 200
179
Malaysia 47% 9% 33% 2% 8% 150
Thailand 34% 13% 42% 3% 8% 100
87
Indonesia 45% 17% 29% 2% 7% 50 43
12
Southeast 0
42% 17% 32% 2% 7% 2007 2008 2009 2010 2011 2012 2013 2014 2015 2016
Asia
All markets 38% 24% 29% 2% 6% Holiday Business VFR Study Misc.
• More visits to the UK from Southeast Asia are made for • Overall, visits have increased over the last ten years for every
holidays than for any other purpose. However, visits from main journey purpose. However, holiday visits have grown the
Thailand are more likely to be visiting friends and relatives. most in volume.
• Overall, visiting friends and relatives is the second most • In 2010 holiday visits overtook visits to friends and relatives
frequent reason why Southeast Asian visitors came to the as the reason why most visits from Southeast Asia to the UK
UK, followed by business visits in third. were made.
• Shares of holiday and VFR visits from Southeast Asia to the • Visits from this region for business and visiting friends and
UK are higher than the all-market average, while there are relatives decreased slightly in 2016. Business visits have
proportionally fewer business visits from Southeast Asia than been challenged over the last ten years, with visits decreasing
the global average. between 2007 and 2010, and then since 2015.
Source: International Passenger Survey by ONS; repeat / first time visitors question asked in 2015
10Market and Trade Profile Southeast Asia
1.1 Key statistics: seasonality
Seasonality 2016 • Summer months are the most popular time for Southeast
Asian residents to visit the UK: in 2016 30% of all visits from
35% 30% Southeast Asia happened between July and September.
28%
30% 28% 27% 27%
• Shoulder seasons in April-June and October-December are
Share of visits
25%
25% 20% also more popular than the all-market average, with 28%
20%
14%
and 27% of the visits from the area in 2016 made then
15%
respectively.
10%
5%
• This is consistent with the last ten years’ trend. Visits
0% between October and December grew the most while those
Jan-Mar Apr-Jun Jul-Sep Oct-Dec between January and March remained at a similar level,
South East Asia All markets progressively representing a smaller share of visits.
Seasonality trend (visits 000s)
200
173
160
150 156
100
80
50
0
2007 2008 2009 2010 2011 2012 2013 2014 2015 2016
Jan - Mar Apr - Jun Jul - Sep Oct - Dec
Source: International Passenger Survey by ONS
11Market and Trade Profile Southeast Asia
1.1 Key statistics: length of stay and accommodation
Accommodation stayed Duration of stay trend
(2014-2016 average % share of nights spent in the UK) (visits 000s, average on 3 rolling years ending…)
All markets Singapore Malaysia Thailand 200
184
All staying visits 100% 100% 100% 100%
150 133
Hotel/guest house 27% 33% 28% 25%
133
Free guest with
43% 35% 37% 50% 100 100
relatives or friends
Rented house/flat 10% 5% 8% 3% 50
Bed & Breakfast 3% 3% 1% 1%
Hostel/university/school 7% 20% 18% 6% 0 3
Paying guest family or
3%Market and Trade Profile Southeast Asia
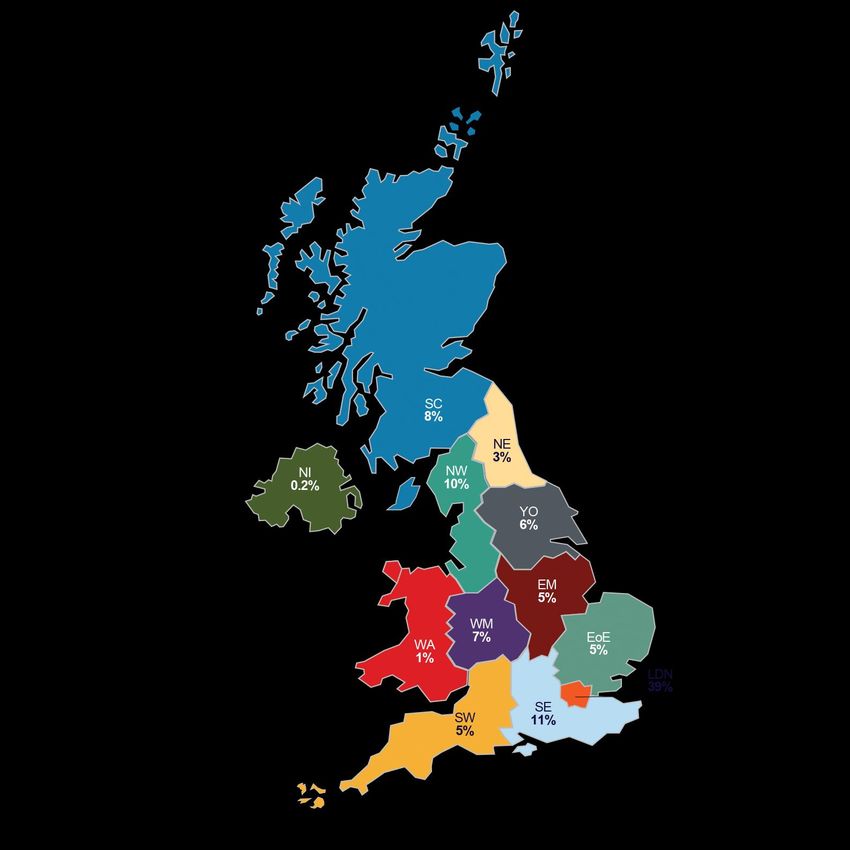
1.1 Key statistics: regional spread
Visits to the UK (2014-2016 average) Nights
Region Nights stayed Visits Spend (% share, 2014-2016)
(000) (000) (£m)
Total 7,348 552 731
Scotland (SC) 576 51 47
Wales (WA) 105 14 9
Northern Ireland (NI) 17 3 1
London (LDN) 2,877 371 399
North East (NE) 227 12 13
North West (NW) 735 59 59
Yorkshire (YO) 422 29 24
West Midlands (WM) 547 27 52
East Midlands (EM) 348 18 17
East of England (EoE) 338 32 33
South West (SW) 346 35 24
South East (SE) 805 73 52
Nil nights (Nil) n/a 3Market and Trade Profile Southeast Asia
1.1 Key statistics: regional spread and top towns and cities
Top towns and cities visited (2014-2016)
Town • Just over 1-in-2 nights spent by Southeast Asian visitors in
Average yearly overnight visits (000s)
the UK on average in 2014-2016 was spent in regional
London 371 England (outside of London), which over indexes
Edinburgh 30 compared to the all-market average (48%).
Manchester 29 • However, London is still the most visited city from
Liverpool 14 Southeast Asia. Other popular cities include Edinburgh,
Glasgow 14
Manchester, Liverpool and Glasgow.
• Overall, visitors from Southeast Asia spend more nights on
average in Northern England and the Midlands than the all-
Regional spread 2014-2016 market average, but fewer in Wales, Northern Ireland,
Share of Scotland Wales London Rest of Northern London, Southern England, and the East of England.
nights… England Ireland • Visitors from Southeast Asia, and in particular
Singapore 14% 1% 41% 44%Market and Trade Profile Southeast Asia
1.1 Key statistics: visits to coast, countryside and villages
Propensity to visit coast, countryside and villages
7%
Holiday: Went to the coast or beaches
14%
23%
Holiday: Went to countryside or villages
18%
9%
All journey purposes: Went to the coast or beaches
10%
22%
All journey purposes: Went to countryside or villages
13%
0% 5% 10% 15% 20% 25%
Southeast Asia All markets
Source: International Passenger Survey by ONS 2016
15Market and Trade Profile Southeast Asia
1.1 Key statistics: use of internal modes of transport
Propensity to use internal modes of transport
1%
Ferry/boat
2%
Car/vehicle you/group brought 1%
to the UK 15%
12%
Hired self-drive car/vehicle
8%
Private coach/minibus (for 5%
group only) 4%
Public bus/coach (outside 9%
town/city) 8%
45%
Taxi
32%
36%
Train (outside town/city)
28%
Bus, Tube, Tram or Metro Train 64%
(within town/city) 53%
3%
Domestic flight
2%
0% 10% 20% 30% 40% 50% 60% 70%
Southeast Asia All markets
Source: International Passenger Survey by ONS, 2013; Southeast Asia includes Indonesia, Malaysia, the Philippines, Singapore, and Thailand.
16Market and Trade Profile Southeast Asia
1.1 Key statistics: repeat holiday visits and package tours
Proportion of overnight holiday visitors to Proportion of visits that are bought
the UK that have visited the UK before* as part of a package or all-inclusive
tour in 2014-2016***
70% 18%
16%
16%
60%
14%
50%
12%
40% 10% 9%
30% 8% 7%
6%
20% 5%
4%
10%
2% 0.8%
0.4%
0% 0%
Holiday VFR All journey purposes
All markets Singapore Malaysia Thailand**
Southeast Asia Global
International Passenger Survey by ONS; *Excluding British nationals; * 2015 data. **Sample size below 50; ***To be defined as a package, a holiday must be sold at an inclusive price covering both fares to and
from the UK and the cost of at least some accommodation. Neither the respondent nor the travel agent from whom the package was bought will know how much of the inclusive price is accounted for by fares or by
accommodation.
17Market and Trade Profile Southeast Asia
1.2 Visitor demographics
Visitor characteristics
• There are slightly more men than women visiting the UK from
Southeast Asia overall. However, the share of business visits
to the UK made by women from Southeast Asia is larger than
the all-market average. On the contrary, Southeast Asians 94%
visiting friends and relatives in the UK are more likely to be of visitors from
men than the all-market average. Southeast Asia to the
UK in 2015 were either
• 7-in-10 visitors to the UK are 25-54 years old (2014-2016 ‘likely’ or ‘extremely
data). Looking at the age group trend, there has been little likely’ to recommend a
growth in the 0-15 cohort over the last several years. This stay in the UK
hints at fewer families visiting the UK from Southeast Asia, as
a proportion of all visits. The 16-24 and 65+ groups grew the
most in percentage terms from 2007-2009 to 2014-2016:
young adults and retirees therefore account for a bigger
share of visits to the UK than before.
• Most visitors from these countries are also nationals of these
countries. However, about 1-in-2 visits from residents of
Singapore to the UK are not made by a Singapore national,
with 1-in-4 being British. 31% of visits from Thailand in those
years were also made by British expats.*
Source: International Passenger Survey by ONS. Nationality data is for 2014-16.
18Market and Trade Profile Southeast Asia
1.2 Visitor demographics: gender and age groups
Visitor demographics* (2014-2016): Age group trend
gender ratio of visits from Southeast Asia: (3 years rolling ending in…)
45% women, 55% men 160
Women (% share of visits by journey 141
140
purpose) 131
120 121
80%
55% 57% 57%
60% 48% 52% 48%
41% 42%
40% 29% 100
Visits (000s)
20%
20%
80
0%
Business Holiday VFR Study Misc. 67
60
Southeast Asia All markets 54
Men (share of visits by journey purpose) 40
100% 26
79% 20
80% 71% 13
59% 57%
60% 52% 48% 52%
44% 43% 42% 0 1
40% 2009 2010 2011 2012 2013 2014 2015 2016
20%
0% 0 -15 16-24 25-34
Business Holiday VFR Study Misc. 35-44 45-54 55-64
Southeast Asia All markets
65+ Not Known
Source: International Passenger Survey by ONS
* Please note that gender data for ‘Study‘ visits are based on a low sample size (Market and Trade Profile Southeast Asia
1.2 Visitor demographics: recommending Britain
Likelihood to recommend
80%
69%
70%
65%
60%
50%
40%
29%
30%
26%
20%
10%
4% 4%
1% 1% 1% 0%
0%
Extremely Likely Neutral Not likely Not likely at
likely all
Southeast Asia All markets
Source: IPS 2015, Southeast Asia includes visitors from Indonesia, Malaysia, the Philippines, Singapore, and Thailand
20Market and Trade Profile Southeast Asia
1.3 Britain and competitors
Market size, share and growth potential
• A large proportion of outbound trips from Southeast
Asian countries are within Southeast Asia. This pattern is
forecast to be maintained in the next few years.
• Other popular destinations include China, other
Northeast Asian countries and the Gulf destinations
(mainly Saudi Arabia and the UAE). Britain
• Visits from Southeast Asia to some key competitor ranks 1 st
destinations showed double-digit growth rates from 2011 among SE Asia outbound
to 2016, and are forecast to do so from 2016 to 2021, as destinations by volume of
is the UK (+37% and +21% respectively). Looking at the overnight stays in Europe
competitor set, India is forecast to receive noticeably
receive more visits as a proportion of the total from the
Southeast Asian countries in 2021 than in 2016. Other
destinations are forecast to either maintain their share
(e.g. UAE, Turkey) or receive fewer visits (UK, USA and
Australia).
• There are some differences between each source
market, but in total shares of outbound visits to the UK in
2021 are forecast to be fairly similar to those in 2011.
Source: Oxford Economics, Southeast Asia includes Brunei, Cambodia, Indonesia, Lao, Malaysia, Myanmar, Philippines, Singapore, Thailand, Vietnam.
21Market and Trade Profile Southeast Asia
1.3 Britain and competitors
Britain’s market share of total Southeast Britain’s market share of total Southeast
Asian outbound overnight visits Asian outbound visits among competitor set
compared to other destinations (2016)
Other destinations, 7% 25%
Other Europe, 2% Australia 27%
28%
United Arab 17%
UK, 1% 17%
Emirates 13%
15%
United States 17%
18%
22%
India 15%
16%
9%
Other Asia Pacific Intra South East Asia United Kingdom 11%
12%
24% 66% 4.5%
Switzerland 5.6%
5.5%
3.4%
New Zealand 3.8%
3.6%
3.2%
Turkey 3.1%
3.9%
0% 10% 20% 30%
2021 2016 2011
Source: Oxford Economics, based on overnight visit
22Market and Trade Profile Southeast Asia
1.3 Britain and competitors
Historic and potential visits to Historic and potential visits to Britain by
Britain (000s) market in share of total outbound visits (%)
800 0.4%
729
Philippines 0.4%
700 0.5%
0.5%
Indonesia 0.5%
600 0.5%
1.0%
500 Thailand 0.8%
1.1%
1.5%
400 Malaysia 1.6%
1.5%
0.8%
300 Singapore 0.9%
0.7%
200
100 0.7%
Southeast Asia
0.8%
(overall)
0 0.7%
2000 2005 2010 2015 2020 2025 0% 1% 1% 2% 2%
2021 2016 2011
Source: Oxford Economics, based on overnight visit
23Market and Trade Profile Southeast Asia
1.4 Inbound activities
Inbound Britain activities
• Among visitors from Southeast Asian
countries, dining in restaurants is the most
popular activity when they are in the UK,
followed by going shopping, visiting parks
or gardens, and castles or historic houses.
Sightseeing famous monuments and
buildings also often features in visits from
this area to the UK.
• Southeast Asian visitors are more likely
than the all-market average to visit
museums and built heritage sites, as well
as British national parks. They would also
be more likely to go to see a show on
stage while in the UK.
• Around 7,500 Southeast Asian visitors per
year watch a live football match in the UK.
• Finally when shopping in the UK they are
most likely to buy clothes or shoes, food
and drinks, and bags or purses.
Source: International Passenger Survey by ONS, rankings based on 2006-2016 data, only Indonesia, Malaysia, Philippines, Singapore and Thailand considered
24Market and Trade Profile Southeast Asia
1.4 Inbound activities
Propensity to visit museums and Propensity to visit built heritage sites
galleries
Holiday: sightseeing 64% 32%
famous buildings Holiday: visited religious buildings
59% 35%
Holiday: museums and art 50% 48%
galleries Holiday: visited castles/historic houses
48% 48%
All journey purposes: 39%
All journey purposes: visited religious 26%
sightseeing famous
buildings 35% buildings 20%
All journey purposes: 37% 39%
All journey purposes: visited
museums and art galleries 28% castles/historic houses 28%
0% 20% 40% 60% 80%
0% 20% 40% 60%
Southeast Asia All markets Southeast Asia All markets
Source: International Passenger Survey by ONS 2016, only Indonesia, Malaysia, Philippines, Singapore and Thailand considered
25Market and Trade Profile Southeast Asia
1.4 Inbound activities
Propensity to attend the performing arts, Number who went to watch live sports during
and festival* trip from Southeast Asia to the UK (000s)**
4%
All journey purposes: Attended a festival Football 7.5
3%
All journey purposes: Went to the 16% Cricket 1.8
theatre/musical/opera/ballet
9%
Golf 1.7
4%
Holiday: Attended a festival
4%
Horse racing 0.8
Holiday: Went to the 21%
theatre/musical/opera/ballet Rugby
14% 0.8
0% 20% 40% 0 2 4 6 8
Southeast Asia All markets
Source: *International Passenger Survey by ONS 2016, only Indonesia, Malaysia, Philippines, Singapore and Thailand considered
**International Passenger Survey by ONS 2011, only Malaysia, Singapore and Thailand considered
26Market and Trade Profile Southeast Asia
1.4 Inbound activities
Propensity to go for a walk Propensity to visit a park or garden,
or a National park
8% Holiday: 11%
Holiday: Walking along the coast Visiting a
11% National Park 11%
21% Holiday: 50%
Holiday: Walking in the countryside Visiting parks
26% or gardens 50%
All journey
9% 11%
purposes:
All journey purposes: Walking along the coast
Visiting a
8% 7%
National Park
All journey
22% 43%
All journey purposes: Walking in the purposes:
countryside Visiting parks
20% 32%
or gardens
0% 10% 20% 30% 0% 20% 40% 60%
Southeast Asia All markets Southeast Asia All markets
Source: International Passenger Survey by ONS 2007, 2010 and 2016, only Indonesia, Malaysia, Philippines, Singapore and Thailand considered
27Market and Trade Profile Southeast Asia
1.4 Inbound activities
Propensity to go to restaurants, go to Propensity to purchase selected items (%)
pubs, and socialise with locals
9% Clothes or Shoes 61%
Holiday: went to bars or night clubs 41%
14%
15%
Personal accessories e.g. jewellery 10%
72%
Holiday: dining in restaurants 27%
70% Bags, purses etc 9%
31% 22%
Cosmetics or toiletries e.g. perfume
Holiday: socialising with the locals 12%
36%
22%
Books or stationery 13%
28%
Holiday: went to pub 14%
50% Games, toys or gifts for children 9%
All journey purposes: went to bars or night 10% 29%
Food or drink 24%
clubs 12%
10%
CDs, DVDs, computer games etc 5%
71%
All journey purposes: dining in restaurants 5%
61% Electrical or electronic items e.g. camera 3%
37% 6%
Items for your home e.g. furnishing
All journey purposes: socialising with the locals 3%
34%
21%
Other holiday souvenir (not mentioned above)
16%
38%
All journey purposes: went to pub 24%
45% None of these 38%
0% 50% 100% 0% 20% 40% 60%
Southeast Asia All markets
Southeast Asia All markets
Source: International Passenger Survey by ONS 2007, 2008, 2011 and 2013, only Indonesia, Malaysia, Philippines, Singapore and Thailand considered
28Market and Trade Profile Southeast Asia
Chapter 2:
Understanding
the market
29Market and Trade Profile Southeast Asia
2.Understanding the market
Chapter summary
• In 2016 Thai and Indonesian travellers were the most likely to be willing to try
something new during their next holidays among all markets included in Over 8-in-10
TripAdvisor‘s Trip Barometer survey globally. Thai and Indonesian
travellers were
• The Southeast Asian travel market is indeed quite dynamic: this region has planning to try
seen many transformations in the last few years and its young population is something new for the
very curious, ready to embrace new travel trends. first time during their
• Economic indicators are quite positive with economic growth rates well above 2016 holidays
the global average. The Southeast Asian digital economy is attracting more
and more investment. The rise of digital media and services also represents
an opportunity for the travel trade to target the Southeast Asian travellers more
efficiently.
• Key consumer trends in the region include studying in an English-speaking
country, physical activity whilst on holiday, trying new, local food, and also new
activities such as going on a cruise, travelling alone and going shopping. The
latter is interesting as more and more women travel abroad from Southeast
Asian countries to treat themselves, which adds to the existing luxury traveller
segments but also constitutes a new trend in comparison to the family
segment, who will prefer destinations that fit the family‘s values.
• Recommendations and value for money are very important in the planning and
decision process. Booking of accommodation and flights are often separate,
with half of the flight bookings made only within two months of departures.
Source:Trip Advisor‘s Trip Barometer/ 2016 Travel Trends, Oxford Economics, Statista.com, The ‘Journey of Me’ 2017 study by Amadeus
30Market and Trade Profile Southeast Asia
2.1 Structural drivers
Demographics & society
• Southeast Asian countries are mostly linked together by ASEAN, the Association
of Southeast Asian Nations, an intergovernmental organisation created in 1967 to
promote economic, politic, security, military, social-cultural and educational
4th
most populated
cooperation in the area. It is headquartered in Jakarta, Indonesia, and gathers this
country in the
country and Malaysia, the Philippines, Singapore, Thailand, Brunei, Cambodia,
Laos, Myanmar, and Vietnam. Only Timor-Leste (East Timor) is not part of it.
world:
Indonesia
• All these countries have been marked by colonialism and the Cold War. Vietnam
and Laos are comunist states, while Timor-Leste, Indonesia, Myanmar, and
Singapore are republics, Brunei an absolute monarchy and the other nations are
parliamentary constitutional monarchies.
• Southeast Asian culture is diverse with Asian, Arabic and European heritage.
Indonesia is the most populated country in the region and has the largest Muslim
population in the world, which greatly influences travel trends. The urbanisation
rate, demographics and economies of these countries also affect travel patterns.
Singapore has, proportionately, the largest migrant population in this region as
well as (Brunei aside) the highest GDP per capita in the area by far. It also has the
most mature outbound market with people willing to escape the mega city they
live in by travelling abroad.
• The region’s political unrest also affect travel patterns.
Source: Oxford Economics, CIA World Factbook 2017
31Market and Trade Profile Southeast Asia
2.1 Structural drivers: population indicators
Population dynamics
Measure – 2017 estimates Singapore Malaysia Thailand Indonesia Philippines Vietnam
(unless otherwise stated)
Total population (m) 5.6 31.7 69.1 264.3 105.1 95.5
Median age (years) 34.6 28.5 37.7 30.2 23.5 30.5
Population growth rate between
+5.8 +6.6 +0.8 +5.1 +7.6 +4.9
2017-2022 (%)
Proportion of international migrants
46.0% 8.5% 5.2% 0.1% 0.2% 0.1%
(% of total population)
• Indonesia is the most populated country in Southeast Asia, and the 4 th most populated country in the world.
• Overall, the population in Southeast Asia is quite young with all markets’ median age at around 30 years old or less
aside from Singapore and Thailand. Southeast Asian populations are forecast to grow.
• All inhabitants in Singapore live in an urban area, about 3-in-4 in Brunei and Malaysia, and just above 1-in-2 in
Indonesia and Thailand. Thus the main visitor source markets to the UK have the highest urbanisation rate in the area.
• Apart from Brunei and Singapore (25% and 46% in 2017 respectively), immigrants constitute fewer than 1-in-10
inhabitants in Southeast Asian countries (the global average is 3.4%). However, different cultures still cohabite in this
area where Christians, Muslims, and Buddhists are all well represented. For example, in Malaysia alone, the
population is an estimated 61% Muslim, 20% Buddhist, 9% Christian, and 6% Hindu, among other religious groups.
• The population of HNWIs* in both Indonesia and Thailand grew between 2015 and 2016 at an even faster rate than in
Asia Pacific in total (respectively +13.7% and +12.7% compared to 7.4%).
Source: Oxford Economics, CIA World Factbook 2017, UN Migration report 2017 Highlights, Capgemini Asia Pacific Wealth Report 2017
*HNWIs: stands for High Net Worth Individuals, people whose liquid assets are worth US$1m or over
32Market and Trade Profile Southeast Asia
2.1 Structural drivers: general market overview
Economic indicators General market conditions
• The economy of the main markets in Southeast Asia, • Economic growth rates are amongst the highest in the
or the Southeast Asian tigers, has been growing world, though not as rapid as in China and India.
recently as local digital companies attract more and • However, while economies have been growing, the
more foreign investment, from Japan and the USA for political landscape of Southeast Asia is more unstable
Malaysia and Thailand, or China for the others. with recent scandals and protests.
• Trade within the ASEAN zone remains strong. • Rising GDP per capita is set to boost the middle class in
• Raising interest rates in Indonesia, for example, have the region’s main markets, who will look to travel more
also benefitted the rupiah. and further than before to enjoy their holiday allowance
(between 12 and 26 days, including public holidays).
GDP per capita
Market GDP per capita (nominal, US$) GDP yearly growth rate (real, %)
2017 2018 2019 2020 2017 2018 2019 2020
Singapore 57,749 61,889 62,834 65,011 3.6 3.1 2.4 2.6
Malaysia 9,942 11,322 11,844 12,679 5.9 5.3 4.5 4.1
Thailand 6,599 7,501 7,912 8,322 3.9 3.2 3.0 3.0
Indonesia 3,842 4,027 4,356 4,683 5.1 5.1 5.1 5.3
Philippines 2,982 3,166 3,505 3,880 6.7 6.4 6.0 5.6
Vietnam 2,310 2,536 2,774 3,004 6.8 6.6 6.3 6.2
Source: Oxford Economics, CIA World Factbook 2017
33Market and Trade Profile Southeast Asia
2.1 Structural drivers: exchange rate trends
Exchange rate trends (cost of GBP in SGD, MYR, THB, and IDR)
Singapore Dollar Malaysia Ringgit
2.5 7
2.0 6
1.5 5
1.0 4
2011 2012 2013 2014 2015 2016 2017 2018 2011 2012 2013 2014 2015 2016 2017 2018
Thai Baht Indonesian Rupiah
60 26,000
22,000
50
18,000
40
14,000
30 10,000
2011 2012 2013 2014 2015 2016 2017 2018 2011 2012 2013 2014 2015 2016 2017 2018
Please find the most up-to-date exchange rate trend based on monthly averages at visitbritain.org/visitor-economy-facts.
Source: Bank of England
34Market and Trade Profile Southeast Asia
2.2 Consumer trends
• Southeast Asia is a diverse area where trends, and more precisely
travel trends can be quite varied. However, some commonalities
exist across the region.
• As the region has been developing, travel needs have been
3
Southeast Asian
changing too. Higher education can be an important draw for some
parents who want to send their children in English-speaking
markets are in the top
countries to improve their employability in the future. Malaysia, 10 non-EU source
Singapore and Thailand are among the top 10 non-EU source countries for higher
countries of students attending higher education courses in the UK. education
This trend is getting more popular in Indonesia too.
• In those source markets, and in Indonesia in particular, their cultural
heritage is also determinant in terms of holiday trends. By 2020,
Muslims will represent two thirds or more of the population in
Malaysia, Brunei and Indonesia. Therefore destinations that are
seen as Muslim-friendly are among the top preferred destinations in
the region as people know those will be able to better cater for their
needs and suit their values, which is especially important for families
travelling together.
• Finally, as wealth grows in this region, the appetite for luxury travel
grows too, including a particular segment of female sole travellers.
Sources: UKCISA/HESA, Pew Research Center, Oxford Economics, Capgemini Asia-Pacific World Wealth Report, Foresight Factory
35Market and Trade Profile Southeast Asia
2.2 Consumer trends: the UK as a key destination for studying
Focus on education
• Studying in English is often seen as a way to improve employability, and English tests are often taken at high
school level to improve students’ chances of being able to study abroad, in an English-speaking country. Britain is
one of the favourite destinations to study English or in English abroad.
• Three main Southeast Asian markets are in the top non-EU source countries by volume of students sent to the UK
to attend higher education courses: Malaysia, Singapore and Thailand. As a consequence it is not rare to see
family visiting their children at university in Britain, or sending them to visit before applying for those courses, or
even coming to find accommodation all together. Education is thus an important way to promote visits to the UK in
those markets.
Rank among non-EU
Students in the UK sending countries in 2016-2017 2015-2016 2014-2015 2013-2014
2016-2017
2 Malaysia 16,370 17,405 17,060 16,635
8 Singapore 7,300 7,540 7,295 6,790
9 Thailand 6,175 6,095 6,240 6,340
Source: Foresight Factory (Local perspective), UKCISA/HESA
36Market and Trade Profile Southeast Asia
2.2 Consumer trends: Muslim-friendly destinations
Indonesia has the largest Muslim population in Muslim population in Southeast Asia
the world by country in 2020
• Saudi Arabia is Southeast Asia’s first destination by
volume of outbound overnight visits outside of the
immediate region. The UAE is third (after Australia).
• The Muslim culture has a great influence in much of
Southeast Asia, especially in Malaysia, Brunei and
Indonesia (Muslims are forecast to constitute 66%,
75%, and 87% of their respective populations by
2020). Islam’s main celebrations are public holidays in
some Southeast Asian countries such as Indonesia
and Malaysia, but also Singapore and Thailand.
• When it comes to travel, many would prefer going to
destinations that cater for their specific food
requirements and other religious obligations such as
praying. So even outside of pilgrimage, going to other
Muslim-majority country or Muslim-friendly destination
is popular, most of all for families. On their way to
Mecca for pilgrimage, Southeast Asians are also likely
to make stopovers to Istanbul or Dubai.
Indonesia Malaysia Philippines Thailand Myanmar Other
Source: Oxford Economics, Pew Research Center, https://publicholidays.asia/, Google Top Travel Trends
37Market and Trade Profile Southeast Asia
2.2 Consumer trends: luxury travel and shopping
A growing market for luxury goods and experiences
• Thanks to economic growth in these markets, and also thanks to the growth of the High Net Worth Individual
(HNWI) population in the area, the appetite for luxury goods and experiences is growing in Southeast Asia,
especially in Indonesia and Thailand. Singapore also boasts the highest GDP per capita of all Southeast
Asian countries by far (Brunei aside), and has been a key market for luxury for a long time already.
• The desire for experiential luxury, compared to more material luxury, in these markets is shifting slowly. with
the exception of Singapore which is already a mature luxury market. Long-haul travel is a key aspiration for
many, but is still often linked to retail experiences. Many travellers would travel to explore the culture of their
destination, and to see the most famous sites, but also to shop for iconic brands abroad. Shopping, as much
as relaxing away from a stressful life in a busy city, can also be a strong motivator for travel.
• Southeast Asians are no stranger to luxury travel offers: the region itself boasts some key destinations for
luxury travel and shopping. As a consequence Southeast Asians can be quite assertive in the type of luxury
goods and experiences they want to enjoy.
• Most would be attracted to Europe for its culture, and for some brands to an extent. Some would also have
had the possibility to fly to Europe for work and might have been able to extend a business trip there for
leisure. Some might have studied there or sent their children there so visiting them is an important draw, as
well as key sites and destinations within the continent.
Source: Capgemini Asia-Pacific Wealth Report, Oxford Economics, Foresight Factory
38Market and Trade Profile Southeast Asia
2.2 Consumer trends: other travel trends
Growing health concerns and influence on travel trends
• Influenced by Eastern philosophies, but also thanks to the standard of living of the growing middle class, more and
more people have a growing interest in healthy living. It is not just about maintaining appearance or fitness, but also
doing sports to feel well and relax, as well as eating well and using organic products to take care of oneself.
• This might influence travellers to turn to more active holidays, or destinations that can accommodate their lifestyle,
offering visits of local food markets for instance. A regional example of how travel is impacted by this trend is the
Airport Wellness Oasis proposed at Changi Airport and that includes a fish spa, manicure and massage services.
Interests in cruises
• There is a growing interest in cruise trips in Southeast Asia. In 2016 Indonesia and Thailand were both among the
countries with the largest proportion of traveller respondents stating they would take their first cruise during the year
(24% and 23% respectively).
• Royal Caribbean also revealed that Malaysia is their fastest-growing market. The company deployed 3 ships in the
area to accompany the growth in cruise demand.
Family vs solo travellers
• Family is a very important value that affects travel in the region. However, in the last few years demand for solo travel
has been growing.
• Solo women travellers are often looking for safe, pampering holidays away from their busy, stressful city life. Safety is
a very important element for this segment as they want travel to be stress-free, but the thought of going to a long haul
destination can be quite stressful on its own. They need reassurance that what they are booking will make them feel
safe and secure enough, address any special requirements and be convenient for them to truly enjoy it.
Source: Foresight Factory (Local perspectives, and other reports), TTG Asia, Statista.com
39Market and Trade Profile Southeast Asia
2.3 Booking and planning
• Southeast Asian travellers will rely on tips and recommendations from
friends and relatives when they plan an international holiday. The
types of recommendations they would appreciate the most are
different depending on the market, but almost all are looking for tips on
Most popular months for
how to get best value for money. Southeast Asian
• Mature markets such as Singapore would mostly appreciate hearing travellers to book their
about the place and being guided in how to best plan their itinerary. flights to the UK
Meanwhile, less mature outbound markets (Indonesia and the
Philippines for example) would prefer some reassurance on how to February, March
stay safe during their travel, or recommendations on how to have a
more comfortable trip.
and August
• Overall in 2017, most bookings to the UK via an agent were made at a
brick and mortar travel agency. Such bookings made through a
corporate travel agents were also more frequent than those made with
an online travel agent (OTA). This suggests the importance of
business travel to the UK and bleisure in those markets.
• 1-in-2 flight bookings for a trip from Southeast Asia to the UK made
through an agent in 2017 were made within two months of departure,
a rather short lead-in time for long-haul flight booking.
• February, March and August were the favourite months for booking
flights in 2016 and 2017 with at least 10% of flight bookings through all
types of travel agents made in each of those months.
Source: The ‘Journey of Me’ 2017 study by Amadeus, ForwardKeys 2016-2017
40Market and Trade Profile Southeast Asia
2.3 Booking and planning: timings
Favourite order to book trip elements: Lead-times on flight bookings to the UK
accommodation and flight (or transport to destination) through a travel agent
57%
Malaysia
53% Singapore 23% 0-29 days
24%
Philippines 30 to 44 days
47%
Vietnam 45 to 59 days
43% 42% 41%
Thailand 11% 60 to 89 days
15%
Indonesia 90 to 119 days
16% 120 to 364 days
11%
Prefer booking accommodation before Prefer booking accommodation after
flight/transport flight/transport
• Most Asia Pacific markets would prefer booking • Southeast Asian markets tend to have quite short lead-in
accommodation and transport at the same time. times for booking their flight to the UK despite being long-
However, Southeast Asian markets are different. haul markets.
• More mature markets such as Malaysia and Singapore • Just below a quarter of the tickets booked to the UK in
would usually book their accommodation after having 2017 were booked in the month prior to departure, and 1-
booked their flight tickets (or secured other transport). in-2 flights were booked in the two months before the
• Travellers from the other main markets, the Philippines, planned date of arrival. However, 23% of the travellers still
Vietnam, Thailand and Indonesia, would prefer to book over 4 months before travelling.
secure their accommodation before getting their • Most of those bookings (64%) were made via a retail travel
transport arrangements sorted. agent, while 18% were made through a corporate travel
agent, and only 15% through an online agent (OTA).
Source: The ‘Journey of Me’ 2017 study by Amadeus, ForwardKeys 2017
41Market and Trade Profile Southeast Asia
2.3 Booking and planning: recommendations and mobile use
Top 3 preferred recommendation types for leisure travel
• Good value on a trip is a key subject for which Singapore Malaysia Thailand Indonesia Philippines Vietnam
Southeast Asian travellers are looking for
How to save How to save How to save How to save How to save Ensuring
recommendations, and is the most preferred 1
money money money money money safety
recommendation type for a leisure trip in all markets
Finding the
except Vietnam, where safety tips are seen as the Making
Itinerary Itinerary Itinerary Ensuring best
most important. 2 travel more
planning planning planning safety sightseeing
comfortable
• Safety is also present in the top 3 for Indonesian and options
Philippine travellers, suggesting that it is more of a Finding the Finding the Finding the
concern for less mature outbound markets. Making
best best best Ensuring How to save
3 travel more
• More mature markets – Singapore, Malaysia and sightseeing sightseeing sightseeing safety
comfortable
money
Thailand – would prefer tips on itinerary planning and options options options
what is best to visit at their destination.
Top 3 most used apps during a trip
• Across all main Southeast Asian markets localisation, Singapore Malaysia Thailand Indonesia Philippines Vietnam
recommendations from other travellers or locals about
Google Google
where to go, and staying in touch with people at home 1
Maps
WhatsApp
Maps
Traveloka Facebook Facebook
seem to be the most popular reasons why they would
use apps during a trip. Google Google
2 WhatsApp Facebook WhatsApp Zalo
Maps Maps
• Some regional players – Line, Traveloka and Zalo –
have a great importance in some markets – Thailand, 3 Trip Advisor Facebook Line Facebook Trip Advisor
Google
Maps
Indonesia and Vietnam respectively.
Source: The ‘Journey of Me’ 2017 study by Amadeus
42Market and Trade Profile Southeast Asia
2.4 Reaching the consumer
• Online media are becoming more and more important in Southeast
Asia: over 8-in-10 Filipino, Indonesian, Thai, Vietnamese,
Singaporean, and Malaysian people wish to stay connected at all
times. Mobile internet and social media are the two most useful
channels to reach out to the Southeast Asian audience.
• Despite the importance of TV consumption, websites, apps and Trust in social
social media are often more effective platforms as there might be a
trust issue toward the traditional broadcast and print media. Most and digital
Southeast Asian governments tend to influence those media as they platforms
manage some of the most important networks, and laws to protect is key in Southeast Asia
the quality of the information tend to encourage journalists’ self-
censorship.
• On the contrary, social media are often seen as platforms where
opinions can be expressed more freely and where ideas can be
debated. They are more generally trusted and followed.
• YouTube, Facebook and messenger apps and services are among
the favourite platforms in the main Southeast Asian markets.
Source: BBC Media profiles, Hootsuite, Nielsen, statista.com
43Market and Trade Profile Southeast Asia
2.4 Reaching the consumer: overview of the media landscape
• In 2015 a survey by Nielsen across Southeast Asian Top Asian countries, daily media consumption (2014)
countries found out that a key change in media
consumption was happening across the region, and in Newspapers Television Radio Internet
2016 for the first time online media became more popular 1 Singapore: Philippines: Singapore: Taiwan:
than TV for the first time. 81min 290min 271min 175min
• However, TV remains an important medium in most 2 Hong Kong: Indonesia: Thailand: Hong Kong:
Southeast Asian countries, and they are also the top 60min 253min 138min 155min
countries in terms of traditional media consumption within 3 Thailand: Hong Kong: Philippines: Thailand:
Asia. 28min 236min 87min 148min
• Looking at the media landscape in these markets, 4 Philippines: Thailand: Vietnam: China:
amongst the leading players there are both state- or 25min 204min 74min 143min
army-owned and private media players. The role of the 5 Vietnam: Taiwan: Hong Kong: Vietnam:
state (and in some cases the army) in Southeast Asian 23min 172min 60min 109min
broadcast and print media has been increasing recently,
raising some concerns towards the freedom of the press.
This partially explains why some prefer turning to blogs or
social media to get up-to-date with news, as journalists
might often apply self censorship to their writing.
• This also applies to broadcast media. In Indonesia, for example, radio remains a key medium; however, private radios
can carry news but cannot relay live news from international broadcasters. The anti-blasphemy law and the Electronic
and Information Transactions Law might also block online content. In most countries Muslim shows are created to
counterweight the international shows for the youth too.
• Local news agencies exist: state-run Antara in Indonesia, or state-run Bernama in Malaysia, for example.
Source:Nielsen, morningaddiction.co.uk, ZenithOptiMedia 2014, BBC Media profiles, Statista.com
44Market and Trade Profile Southeast Asia
2.4 Reaching the consumer: main traditional media players
Newspapers and magazines Television Radio
• Singapore Press Holdings: One FM
• Singapore Press Holdings (almost
and Kiss 92 in English, UFM in
monopoly in newspaper industry): • Media Corp: Channel News Asia (news),
Mandarin
Singapore The Strait Times, Business Times Channel 5, Channel 8 (entertainment), Suria
• Media Corp owns a dozen stations in
• Media Corp, owned by a state (in Malay), Channel U (in Mandarin)
English (938 Live), Chinese, Malay
investment agency: Today
and Indian
• Owned by RTM (public): TV1, TV2
Daily newspapers in English: • Commercial terrestrial networks: TV3, ntv7,
• RTMC owns about 30 national and
• New Strait Times 8TV, TV9
regional stations
Malaysia • The Star • Astro TV has many different programmes
• Private networks: Era FM, Hot FM,
• The Sun with celebrities travelling to different
Sinar FM, THR FM
• The Malay Mail destinations (KTO and Tourism Australia
partnered up with those shows)
• Thai Public Broadcasting Service (TPBS)
Very competitive environment: over 60
• Daily newspapers in Thai are the manages the public TV service
stations exist in Bangkok, including:
most important in mass circulation, • Owned by MCOT, Mass Communications
• Army Radio
Thailand including: Daily News, Thairath Organisation of Thailand: Thai TV3 and
• MCOT Radio Network
• Main titles in English: Bangkok Post, ModerNine
• Radio Thailand run by the National
The Nation • Owned by the Royal Thai Army: TV5, BBTV
Broadcasting Service of Thailand
Channel7
• TVRI, Televisi Republik Indonesia, state-
• Daily newspapers in English: The
owned, operates two networks
Jakarta Post, The Jakarta Globe
• Private networks: Surya Citra Televisi • RRI, Radio Republik Indonesia,
• Other daily newspapers: Kompaa,
Indonesia Indonesia (SCTV), Rajawali Citra TV state-owned, operates national,
Poa Koba, Indo Poa, Republika
Indonesia (RCTI), Indosiar, MNCTV, Trans 7, regional and local stations
Biana Indonesia
and Metro TV (news)
• Weekly newspapers: Tempo
Source:BBC Nedia profiles
45Market and Trade Profile Southeast Asia
2.4 Reaching the consumer: digital media landscape
• With various laws constraining what can or cannot be Desire for always on connectivity (2015)
published in traditional media, people in Southeast Asia and top social media used (2017)
quickly adopted social media for debating of the news.
Recent investments in developing a 4G network in most
94%
markets, along with good results of digital start-ups and 89% 88% 88%
the influence of nearby Asian social media champions 86%
84%
like WeChat or Line, have influenced the adoption pace 76%
of new technologies.
• In the main Southeast Asian markets the desire to be
always connected to the Internet is higher than the
global average. Mobile technologies that allow
consumption of digital media on the go, such as
smartphones but also tablets, are particularly popular,
especially in the main urban areas.
• E-commerce and mobile payment solutions have also
become popular in markets such as Vietnam, reinforcing
this for mobile connectivity.
• As a consequence Southeast Asian travellers will be
well-connected and keen on searching for travel
information online, or even book their next trip with their Philippines Indonesia Thailand Vietnam Singapore Malaysia Global average
smartphones, when it is straight-forward.
YouTube YouTube Facebook Facebook YouTube YouTube 1
• Traditional media have launched online news portal such
as Says.com by Media Prima in Malaysia, targeting Facebook Facebook YouTube YouTube Facebook Facebook 2
young Malaysian and including travel features. Those MessengerInstagram Line Messenger Whatsapp Whatsapp 3
websites can be in the local language, or in English.
Source:BBC Nedia profile, Nielsen, Hootsuite
46Market and Trade Profile Southeast Asia
2.5 Perceptions of Britain
• Overall, the trade reports that perceptions of Britain in Southeast
Asia are favourable.
• Looking at Singapore and Indonesia, though, we can see some
differences between what they expect from a holiday trip and their Areas of strength for Britain:
perceptions of Britain compared to other destinations. historic sites and
• For example Singaporeans would prefer destinations that offer sports events
good value for money, and provide fun and laughter, while
Indonesians rank higher their need to be physically healthier, and
for peace and quiet in a holiday destination. Australia ranks quite
well in each case, compared to Britain.
• However both markets rank Britain highly for the possibility to
watch some sporting events live while visiting. Both clearly have a
higher interest in the Premier League football matches than in
other top European football leagues.
• Both markets also rank the UK highly for the historic and iconic
sites they might be able to visit there.
Source: Arkenford 2013, Statista.com from YouGov 2014
47Market and Trade Profile Southeast Asia
2.5 Perceptions of Britain: Singapore
Holiday wants and % saying destination is best place for…
Importance GB FR IT AU US GE
5.87 Offers good value for money 14% 17% 17% 28% 22% 12%
5.84 Have fun and laughter 14% 12% 9% 31% 26% 8%
5.81 Enjoy the beauty of the landscape 39% 42% 45% 50% 33% 30%
5.75 See world famous sites and places 46% 48% 51% 28% 37% 31%
5.70 Enjoy peace & quiet 21% 24% 23% 42% 14% 20%
5.70 Enjoy local specialities (food and drink) 12% 39% 34% 18% 18% 19%
5.66 Explore the place 28% 33% 32% 37% 27% 20%
5.66 Easy to get around by public transport 31% 21% 17% 26% 28% 18%
5.66 The people are friendly and welcoming 21% 18% 20% 29% 25% 14%
5.66 It offers unique holiday experiences 31% 36% 37% 37% 33% 27%
5.64 Do something the children would really enjoy 27% 23% 20% 53% 50% 17%
5.64 Provides a wide range of holiday experiences 29% 30% 29% 41% 43% 22%
5.63 Experience things that are new to me 18% 28% 29% 27% 25% 23%
5.60 Chill/ slow down to a different pace of life 15% 24% 23% 39% 17% 12%
5.56 Broaden my mind/ Stimulate my thinking 28% 29% 31% 31% 31% 27%
5.51 Experience activities/places with a wow factor 26% 27% 24% 32% 28% 20%
5.48 Do what I want when I want spontaneously 9% 6% 18% 23% 25% 11%
5.48 A good place to visit at any time of year 20% 22% 21% 31% 25% 15%
5.46 Have dedicated time with my other half 34% 46% 42% 39% 29% 26%
5.44 Be physically healthier 22% 21% 23% 34% 17% 18%
5.44 Feel connected to nature 28% 27% 33% 55% 33% 22%
5.41 Enjoy high quality food and drink (gourmet food) 21% 55% 43% 30% 30% 22%
5.39 Soak up the atmosphere 39% 35% 44% 45% 24% 23%
5.24 Good shopping 20% 30% 30% 27% 46% 12%
5.19 Visit a place with a lot of history/historic sites 53% 49% 51% 25% 30% 39%
5.15 Feel special or spoilt 17% 36% 26% 27% 20% 17%
5.15 Revisit places of nostalgic importance to me 22% 27% 22% 21% 22% 16%
4.86 Meet the locals 12% 19% 37% 30% 30% 7%
4.83 Get off the beaten track 19% 29% 19% 40% 25% 11%
4.76 Do something environmentally sustainable/ green 9% 19% 17% 44% 9% 24%
4.75 Experience adrenalin filled adventures 5% 18% 13% 49% 41% 17%
4.73 Get some sun 23% 25% 26% 52% 38% 12%
4.62 Fashionable destination 28% 51% 45% 22% 39% 18%
4.53 Meet and have fun with other tourists 10% 31% 32% 48% 54% 15%
4.52 To participate in an active pastime or sport 29% 24% 21% 38% 27% 26%
4.51 Visit places important to my family's history 22% 27% 27% 27% 23% 21%
4.45 Go somewhere that provided lots of laid on entertainment/nightlife 32% 29% 33% 33% 46% 25%
4.26 Do something useful like volunteering to help on a project 16% 35% 18% 23% 33% 28%
4.18 Party 32% 25% 14% 47% 33% 24%
3.87 Watch a sporting event 41% 14% 22% 21% 28% 23%
Source: VisitBritain/Arkenford 2013
48Market and Trade Profile Southeast Asia
2.5 Perceptions of Britain: Indonesia
Holiday wants and % saying destination is best place for…
Importance GB FR IT AU US GE
6.35 Be physically healthier 32% 41% 37% 45% 29% 32%
6.34 Enjoy peace & quiet 24% 39% 43% 40% 16% 21%
6.32 Enjoy the beauty of the landscape 37% 46% 45% 61% 30% 23%
6.31 See world famous sites and places 50% 70% 59% 42% 49% 43%
6.29 Broaden my mind/ Stimulate my thinking 43% 60% 53% 45% 45% 44%
6.26 The people are friendly and welcoming 36% 44% 42% 43% 28% 27%
6.24 Have dedicated time with my other half 37% 74% 63% 47% 34% 34%
6.23 It offers unique holiday experiences 44% 61% 60% 50% 40% 38%
6.21 Experience activities/places with a wow factor 29% 63% 53% 42% 30% 29%
6.21 Enjoy local specialities (food and drink) 28% 59% 68% 34% 25% 32%
6.20 Experience things that are new to me 30% 52% 41% 40% 47% 28%
6.15 Provides a wide range of holiday experiences 42% 58% 57% 50% 47% 38%
6.13 A good place to visit at any time of year 33% 53% 48% 51% 38% 27%
6.10 Have fun and laughter 33% 45% 31% 41% 36% 28%
6.10 Feel connected to nature 24% 25% 21% 65% 16% 19%
6.06 Explore the place 30% 46% 49% 46% 26% 27%
6.06 Do something the children would really enjoy 35% 41% 39% 58% 48% 30%
6.01 Chill/ slow down to a different pace of life 29% 47% 37% 37% 25% 23%
5.99 Easy to get around by public transport 47% 52% 46% 47% 50% 44%
5.93 Revisit places of nostalgic importance to me 26% 49% 45% 35% 21% 26%
5.89 Offers good value for money 33% 56% 50% 33% 36% 30%
5.88 Do something environmentally sustainable/ green 34% 43% 34% 33% 39% 42%
5.85 Visit a place with a lot of history/historic sites 50% 67% 67% 28% 27% 48%
5.80 Good shopping 29% 51% 43% 36% 40% 19%
5.75 Enjoy high quality food and drink (gourmet food) 20% 77% 65% 31% 33% 26%
5.64 Do what I want when I want spontaneously 25% 48% 36% 45% 30% 45%
5.57 Visit places important to my family's history 17% 30% 25% 29% 25% 24%
5.55 Get off the beaten track 31% 21% 50% 33% 21% 25%
5.46 Feel special or spoilt 19% 47% 45% 34% 21% 14%
5.41 To participate in an active pastime or sport 43% 34% 44% 42% 36% 30%
5.38 Meet the locals 39% 26% 28% 73% 32% 41%
5.38 Meet and have fun with other tourists 28% 27% 35% 54% 27% 5%
5.29 Experience adrenalin filled adventures 28% 36% 31% 44% 30% 28%
5.29 Get some sun 16% 37% 36% 51% 25% 19%
5.17 Fashionable destination 29% 79% 67% 19% 38% 19%
5.04 Soak up the atmosphere 67% 45% 45% 22% 55% 0%
4.97 Do something useful like volunteering to help on a project 37% 39% 33% 21% 38% 26%
4.76 Go somewhere that provided lots of laid on entertainment/nightlife 42% 67% 52% 49% 62% 31%
4.62 Party 51% 68% 42% 56% 47% 34%
4.61 Watch a sporting event 44% 41% 47% 26% 33% 32%
Source: VisitBritain/Arkenford 2013
49You can also read