MARKET READINESS PROPOSAL: INDONESIA
IDENTIFYING SUITABLE MARKET INSTRUMENTS
←
→
Page content transcription
If your browser does not render page correctly, please read the page content below
MARKET READINESS PROPOSAL: INDONESIA IDENTIFYING SUITABLE MARKET INSTRUMENTS
FOREWORD

Excellent members of the Participants Assembly:
It’s my pleasure to attend the annual meeting of the Partnership for Market Readiness (PMR) and its
Participants Assembly (PA). We in Indonesia are looking forward to obtaining fruitful results from
this meeting and from our involvement in the PMR generally.
As the Head Secretary of the National Council on Climate Change (NCCC) of Indonesia, I cordially
submit the “Market Readiness Proposal (MRP): Indonesia” for consideration by the PA. We have
welcomed the development of the global carbon market, and we welcome the assistance that the
PMR provides us in developing a carbon market in Indonesia through which more and more people
in Indonesia get to understand the positive role that carbon markets can play in achieving our
greenhouse gas (GHG) mitigation targets. This growing understanding is manifest in the actions to
reduce emissions that we are undertaking, particularly with regard to urban life styles and energy
savings in the area of transportation and industry. As the country’s economy grows, emissions also
increase. This problem, of course, is not limited to Indonesia, but affects all economies and people in
the world. In Indonesia, people have become more aware of the need to combat climate change.
And we are becoming more appreciative of the need and activities related to greening the country.
Indonesia looks to the PMR for help in developing a low-carbon economy. Indonesia prepares itself
to expand our present modest carbon market to become one of the large contributors to combating
climate change; and for this reason the support provided by PMR is highly appreciated. The mission
to green the country has a long way to go. However, we optimistically face the challenge by stepping
up to take the early first steps. Joining PMR reflected a first step. Currently, more and more steps are
coming into perspective: Creating a blue print for implementing a market approach through an in
depth assessment of Market Based Instruments (MBI) for mitigation actions.
Our market readiness proposal (MRP) encompasses the following activities: the Development of an
Emissions Profile and MRV System in Power Generation and Energy-Intensive Industries, and the
Development of a Framework for Market-Based Instruments (MBI) in Indonesia. Our experience
with the CDM, its operation in Indonesia and the many related discussions, as well as with other
carbon market mechanisms internationally, in the East Asia region, and domestically affirms our
intention to expand the carbon market to more sectors. We hope that the approval by the PA of our
MRP will bring us closer to scaling up our current work towards the utilization of market approaches
for mitigation actions.
The team that prepared this proposal received the support of many stakeholders, from high ranking
officials of several ministries to experts from consulting firms and from the academic field. Our
appreciation also goes to the World Bank for its support.
Thank you.
Mr. Agus Purnomo, Head Secretary of the National Council on Climate Change of Indonesia

                                                                                                       i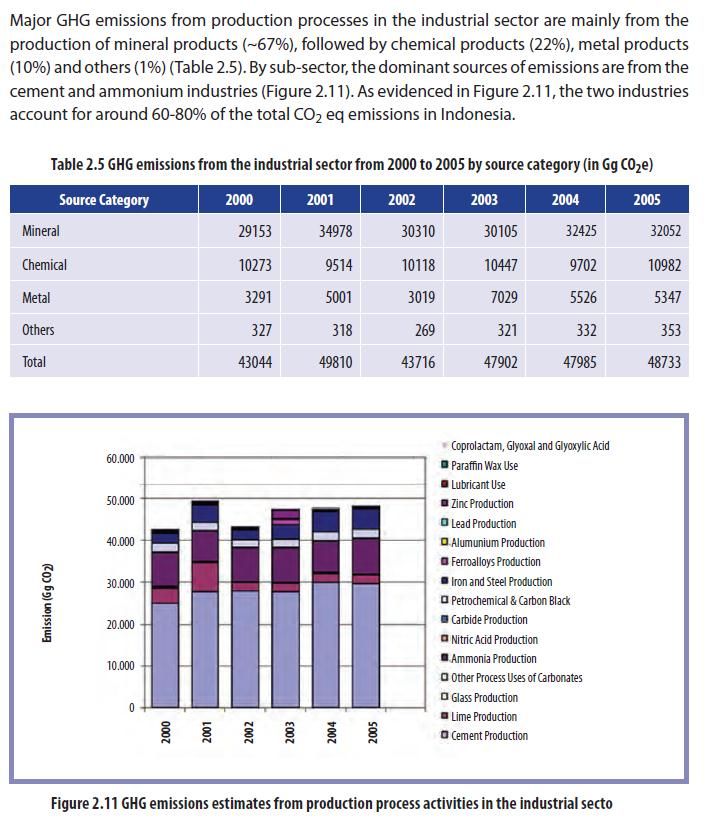
EXECUTIVE SUMMARY

Indonesia, though a developing country, considers climate change as an important issue. Indonesia is
aware of the negative impacts of climate change and is taking mitigation actions seriously. Since
Indonesia ratified the Kyoto Protocol in 2004, Indonesia has been active in promoting the Clean
Development Mechanism (CDM) and helped to establish its requirements. Indonesia’s Designated
National Authority (DNA) carries-out many capacity building activities by the Government as well as
by Non-Government Organizations (NGO), and informs stakeholders about the importance of
reducing greenhouse gas (GHG) concentration in the atmosphere to mitigate the impacts from
climate change. Currently, 7.9 million certified emission reductions (CER) have been issued from
Indonesian CDM projects.

Furthermore, Indonesia is aware of the fact that extra efforts are needed to reduce the
concentration of GHG in the atmosphere if the World were to cap GHG levels at 450 parts per million
(ppm). At the Bali Conference of Parties (COP) in 2007, Indonesia proposed enlarging the mitigation
effort beyond CDM by allowing countries to reduce GHG emissions in a way appropriate to the
country, through the Nationally Approved Mitigation Actions (NAMA) initiative.

In 2008, Indonesia established the National Council on Climate Change (NCCC) or Dewan Nasional
Perubahan Iklim (DNPI), to specifically handle overarching issues of climate change mitigation and
adaptation. The President of Indonesia chairs the NCCC Indonesia (Presidential Regulation No.
46/2008).

In 2009 during the G20 meeting in Pittsburgh, the President announced that Indonesia is aiming at
reducing GHG emission levels down to 26% of its business as usual (BAU) level by 2020 through its
own efforts, and reducing up to 41% with international assistance. It is our goal to integrate
economic development and GHG emission reduction through our National Action Plan on GHG
Emissions Reduction, or RAN-GRK, which was institutionalized in Presidential Regulation No.
61/2011.

In the context of stabilizing the global GHG concentration in the atmosphere, Indonesia welcomes
the concept of scaling-up mitigation efforts by facilitating a market-based approach to incentivize
emission reduction within developing countries, or between developed and developing countries.
Indonesia is aware that developing countries will soon be the main GHG emitters. Therefore, it is
necessary for all countries to seek and implement ways, approaches, and instruments to support
mitigation actions in developing countries.

Indonesia welcomes the effort of contributing countries to support, through the PMR, activities
needed to formulate the nationally appropriate market-based instruments to support mitigation
actions in Indonesia, as one of the PMR’s implementing countries. Indonesia announced, on May 7,
2012, the start of its activities under the PMR’s Preparation Phase. This initial activity led to the
preparation of this MRP document as a milestone deliverable.

This proposal has been constructed under the guidance of the Terms of Reference (TOR) for the
Market Readiness Preparation phase together with the Tool provided for it. This proposal responds,
whenever possible, to every step indicated in the Tool. The approach applied has been to establish
consensus among all relevant stakeholders on the concept of Indonesia having its own market-based

                                                                                                   ii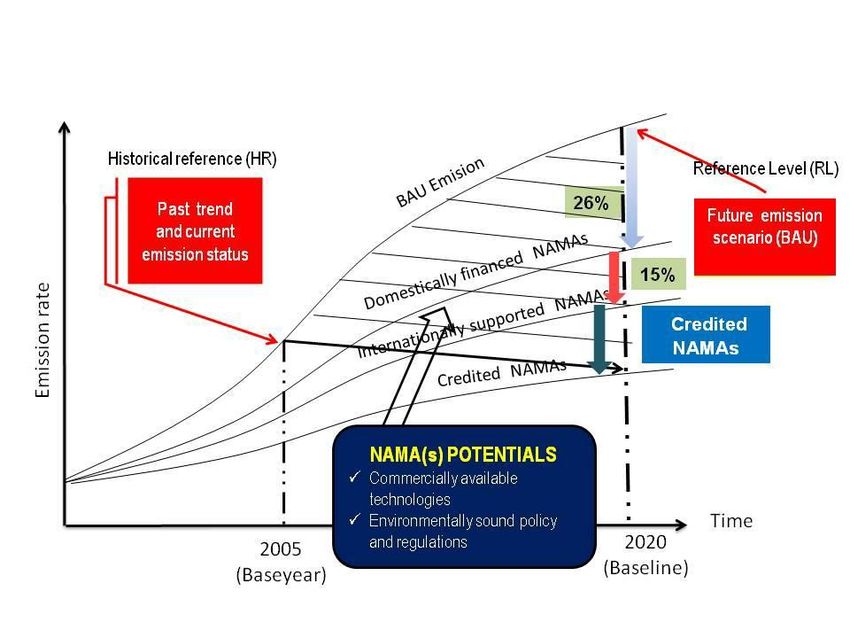
instrument for mitigation actions, and seeking commitments of the related ministries to participate
in the forthcoming exercises through activities that are their core responsibilities. There are six
chapters in the proposal in line with the description of information required by the TOR as stipulated
in the Tool.

Chapter 1 portrays a macro picture of Indonesia through a policy lens pertaining to GHG mitigation
actions. The chapter portrays the degree of seriousness of Indonesia to participate in reducing GHG
emissions domestically. The policy frameworks, such as RAN-GRK, and the market-related
implementation activities, such as the CDM and the work under the Verified Carbon Standard (VCS),
serve to demonstrate Indonesia’s seriousness in pursuing its commitments.

Chapter 2 focuses on activities that can be configured for a market system. The targeted sectors
were primarily chosen based on the probability that the activities will be carried-out in a sustainable
way. For this reason, the proposed activities were assessed on the basis of existing policy
instruments, such as ministerial decrees, activities being carried out currently, planned or waiting for
implementation, as well as the institutional set up and the methods of measurement and reporting.
This chapter also discusses the effectiveness of activities as a means of reducing GHG emissions.

The steps taken in developing the proposal consisted of a workshop and four National Consultation
Meetings (NCM) interspaced by intensive assessments of proposed activities in the various
ministries. The NCM opted to propose two sectors as target areas for introducing market
instruments and readiness building: the power sector (electricity generation) and the industrial
sector under the authority of the Ministry of Energy and Mineral Resources (MEMR) and the
Ministry of Industry (MoI) respectively.

Targeting electricity generation seemed feasible due to the entry of renewable energy as stipulated
by the Presidential Regulation No. 5/2006, according to which renewable energy will contribute 17%
to the energy scenario by 2020 in a subsector heavily dominated by fossil fuels, mainly coal.
Therefore, to achieve this objective, it is important to incentivize clean energy electricity to ensure
its competitiveness against the least-cost high emitting options. A market approach can be deemed
a promising alternative to further incentivize this shift. Such an approach will need reliable data on
GHG emissions from electricity generation activities. As a case study, the largest electricity grid in
Indonesia, the Java-Madura-Bali (JAMALI) electricity system, was chosen as it encompasses 67
power plants that consist of 212 units with different types of technology such as condensing
turbines, gas turbines, combined cycle, geothermal, diesel powered power plants, and fuel uses,
such as coal, oil, natural gas, and diesel oil. JAMALI’s GHG emissions were 83,000 ktCO2 in 2009 and
86,000 ktCO2 in 2010.

From a policy point of view, it is important to implement Government Regulation No. 70/2009 on
Energy Conservation, further detailed by Ministerial Regulation of the Ministry of Energy and
Mineral Resources (PerMenESDM) No. 14/2012, which aims to reduce energy use of large energy
consumers (energy use > 6,000 TOE/year). This policy is important, because it has the potential to
significantly reduce GHG emissions from industries dominated by the use of energy from fossil fuels.
This policy is expected to start functioning in 2013, and it is related to the energy conservation policy
in the Ministerial Regulation of the Ministry of Industry (PerMenPerind) No. 12/2012. The Regulation
stipulates that the cement production subsector voluntarily reduces its GHG emission intensity by
2% over the years 2011 – 2015; and the Regulation will become a mandatory obligation to reduce

                                                                                                       iii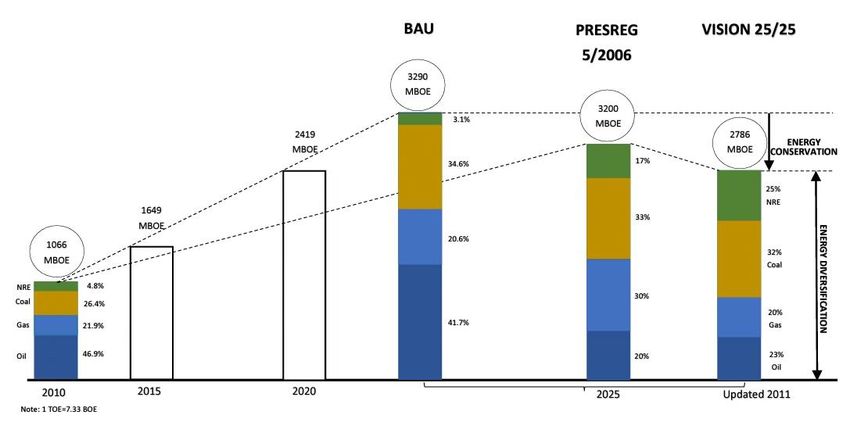
GHG emission by 3% from 2016 – 2020 below the GHG emission level in 2009 of 0.85 tCO2/t cement
(AFD study). This effort may reduce GHG emission by an amount of 0.7-1.9 MtCO2/year. Taking into
account the opportunities to develop a market instrument for GHG emission reductions starting
from existing regulations, the next chapter focuses on electricity generation and cement production
as target sectors.

Chapter 3 deals with the reliability of data. Reliable data is an absolute requirement for market-
based instruments to work correctly. Indonesia is seeking support from the PMR to establish a
robust system that will allow Indonesia to obtain data that can be monitored, reported and verified
(MRV). Presently, data generation, reporting, and verification are carried-out under the guidance of
the respective ministries. However, there is scope for improving data availability, accuracy and
timeliness for market readiness. An MRV system is expected to make measurement, recording,
archiving, validation, verification, and reporting of data consistent and transparent. An MRV system
is therefore proposed for the power and industry sectors, and piloted for the JAMALI grid and the
cement production sub-sector, which are managed by MEMR and MoI respectively. In addition, the
GHG emission profile and the abatement estimates for these pilot areas will be determined using
appropriate measurements.

Chapter 4 deals with the design of the market instruments in the target areas. Indonesia has an
interest to employ market instruments to support its mitigation actions. Indonesia views market
instruments as a complete system, in which emissions units are properly issued and/or distributed,
units are properly recorded and tracked, and double counting is avoided, all of which is ensured by
an administrative body that runs the mechanism efficiently and smoothly. Thus, forthcoming market
instruments need to be properly defined and designed to take into account Indonesia’s national
context, the latest development in international climate change negotiations, and the various
market mechanisms that are emerging around the globe.

It is therefore necessary to carry out in-depth studies and stakeholder consultations on a possible
Indonesian GHG market. As stated in its expression of interest for the PMR, Indonesia looks forward
to PMR support to answer questions on costs and benefits of market options, policy and capacity
gaps that need to be bridged, supporting instruments that need to be built, and institutional
arrangements that will make the market instrument as good as possible. The result of these PMR-
supported activities would be a comprehensive description of a nationally appropriate market
instrument, which will support further decision making within and by the Government of Indonesia
(GoI).

Chapter 5 deals with the organization and implementation of the proposed tasks, as well as with
communication, consultations and engagement of the lead ministries in the PMR. Finally, Chapter 6
summarizes Indonesia’s market readiness proposal and the timeline from 2014 until 2019 for
carrying out the proposed tasks.

                                                                                                  iv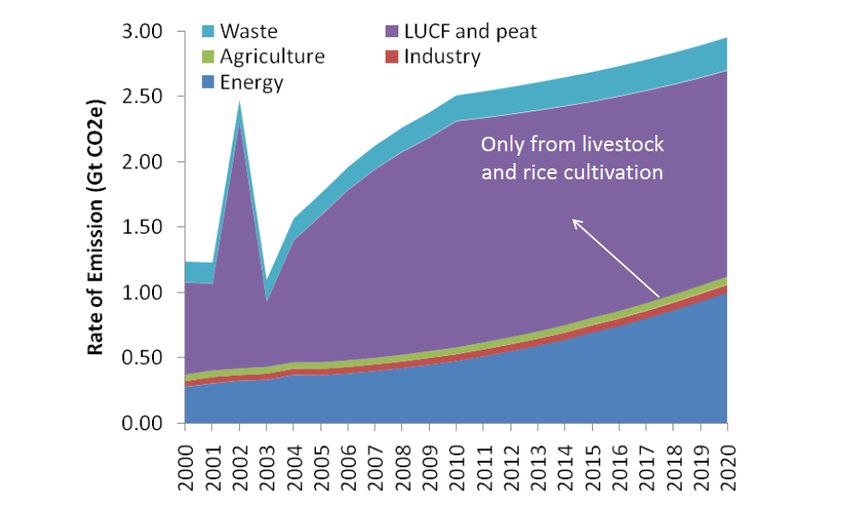
TABLE OF CONTENTS

FOREWORD i
EXECUTIVE SUMMARY .................................................................................................................................. ii
TABLE OF CONTENTS..................................................................................................................................... v
LIST OF TABLES ............................................................................................................................................ vii
LIST OF FIGURES ........................................................................................................................................... xi
LIST OF ABBREVIATIONS ............................................................................................................................. xii
INTRODUCTION ............................................................................................................................................. 1
CHAPTER 1. THE BIG PICTURE, POLICY CONTEXT ...................................................................................... 2
     1.1 Country Information ...................................................................................................................... 2
         1.1.1 Geographical Features.............................................................................................................. 2
         1.1.2 Demography ............................................................................................................................. 3
         1.1.3 Economic Features and Trend .................................................................................................. 3
       1.2 Combating Climate Change ........................................................................................................... 4
       1.3 Overview and composition of Indonesia’ GHG emissions and trends by sector .......................... 5
         1.3.1 Sectoral Emissions - Energy ...................................................................................................... 6
         1.3.2 Sectoral Emissions - Industry.................................................................................................... 9
       1.4 Indonesia’s pledge on mitigation actions ...................................................................................... 9
       1.5 Climate change policy framework ............................................................................................... 11
       1.6 Combating climate change while ensuring growth ..................................................................... 13
       1.7 Some barriers toward the low carbon pathway.......................................................................... 14
       1.8 Indonesia’s experience with market-based instruments ............................................................ 15
       1.9 Conclusions: the big picture ........................................................................................................ 17
CHAPTER 2. RATIONALE FOR FOCUSING ON TARGET AREAS .................................................................. 19
   2.1 Methodology for Selecting the Target Areas .............................................................................. 19
       2.2 Overview of the Target Areas ...................................................................................................... 22
         2.2.1 Energy Sector Overview ......................................................................................................... 22
         2.2.2 Key energy policies related to climate change mitigation ..................................................... 23
         2.2.3 Electricity Generation ............................................................................................................. 26
         2.2.4 Energy-Intensive Industry: Cement Production ..................................................................... 29
       2.3 Opportunities for Market Instruments........................................................................................ 34
CHAPTER 3.      CORE TECHNICAL AND INSTITUTIONAL/REGULATORY MARKET READINESS
                COMPONENTS...................................................................................................................... 37
       3.1 Reliable Data................................................................................................................................ 37
       3.2 Target and goal setting for market instruments ......................................................................... 37

                                                                                                                                                       v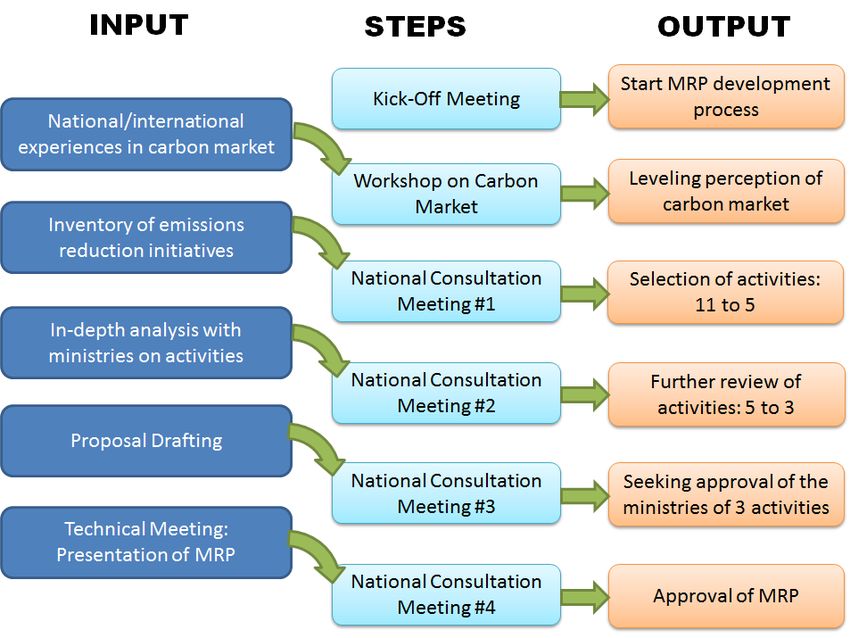
3.3 Monitoring, Reporting and Verification (MRV) ........................................................................... 39
      3.3. Regulatory and Institutional Framework..................................................................................... 47
CHAPTER 4. PLANNING FOR MARKET-BASED INSTRUMENT ................................................................... 49
   4.1. Market Based Instrument for mitigation of GHG emissions ....................................................... 49
CHAPTER 5. ORGANIZATION, COMMUNICATION, CONSULTATION, AND ENGAGEMENT ...................... 55
   5.1 Project Steering Committee ........................................................................................................ 55
      5.2 Project Implementation Unit (PIU) .............................................................................................. 55
      5.3 Expert Group ............................................................................................................................... 56
CHAPTER 6. SUMMARY OF IMPLEMENTATION SCHEDULE & BUDGET ................................................... 58
   6.1 Timelines of Planned Activities.................................................................................................... 58
      6.2 Budget ......................................................................................................................................... 60

                                                                                                                                                    vi
LIST OF TABLES
Table 1. Type of final energy consumption by sector ........................................................................ 7
Table 2. Seven Key Sectors of NAMAs .............................................................................................. 11
Table 3. Emission Reduction Targets and Action Plan by Sector in 2020 ......................................... 12
Table 4. Criteria and Scoring for Selection from 11 Activities .......................................................... 21
Table 5. Energy potential and production (2011)............................................................................. 28
Table 6. Emissions Reduction Road Map of Cement Industry .......................................................... 32
Table 7. Registered CDM projects in the cement sector .................................................................. 33
Table 8. TOR for profiling emissions in Power and Industry Sector ................................................. 38
Table 9. TOR for MRV system development in the governance track ............................................. 44
Table 10. TOR for MRV system development in the installation track.............................................. 45
Table 11. TOR for development of market based instrument framework ......................................... 52
Table 12. TOR for Organization, Communication, Consultation and Engagement ............................ 56
Table 13. Timeline for profiling emissions in Power and Industry Sector .......................................... 58
Table 14. Timeline for the MRV system development in institutional track ...................................... 58
Table 15. Timeline for the MRV system development in piloting track ............................................. 58
Table 16. Timeline for framework for market based instrument....................................................... 59
Table 17. Timeline for Organization, Communication, Consultation and Engagement ..................... 59
Table 18. Proposed Budget................................................................................................................. 60
Table 19. Budget Recapitulation......................................................................................................... 61
viiLIST OF FIGURES
Figure 1. Map of Indonesia ................................................................................................................... 2
Figure 2. Growth of Indonesian Various Indicator, 1990-2007 ............................................................ 4
Figure 3. Historical and Projection of GHG emission under BAU scenario ........................................... 6
Figure 4. Final energy consumption in Indonesia (2000-2008) ............................................................ 7
Figure 5. Estimated GHG Emission from fossil fuel .............................................................................. 8
Figure 6. Energy mix from 2010-2050 .................................................................................................. 8
Figure 7. GHG emissions estimates from production process activities .............................................. 9
Figure 8. Indonesia’s National Emission Reduction ............................................................................ 10
Figure 9. Indonesian CERs by project types ........................................................................................ 16
Figure 10. Steps in developing the MRP ............................................................................................... 19
Figure 11. Projection of total energy consumption (2010-2030) ......................................................... 22
Figure 12. Energy Policy Direction ........................................................................................................ 23
Figure 13. Energy Mix according to Presidential Regulation No.5/2006 .............................................. 25
Figure 14. Electricity demands 2010 to 2030 according to user sector (low scenario) ........................ 26
Figure 15. Energy Mix in 2007- 2011 .................................................................................................... 27
Figure 16. Indonesia Interconected Grids............................................................................................. 27
Figure 17. Power sector reduction potential in 2030 ........................................................................... 28
Figure 18. Energy consumption proportion in energy-intensive industries ......................................... 29
Figure 19. Cement Supply and Demand ............................................................................................... 30
Figure 20. Projection of cement demand and related GHG emissions (DNPI) ..................................... 30
Figure 21. Projection of cement demand and related GHG emissions (GHD)...................................... 31
Figure 22. Indonesia GHG abatement cost curve for cement sector in 2030 ...................................... 31
Figure 23. From Readiness to MBI Implementation ............................................................................. 36
Figure 24. MRV design flow chart ......................................................................................................... 43
Figure 25. Organizational framework of PMR implementation phase ................................................. 55
Figure 26. Schedule of Implementation ............................................................................................... 60
xiLIST OF ABBREVIATIONS
AAU Assignment Amount Unit
ACM Agriculture, Construction, Mining
AD Activity Data
ADB Asian Development Bank
ADPC Asian Disaster Preparedness Centre
ADRC Asian Disaster Reduction Centre
AFC Asian Financial Crisis
AFD Agence Francaise de Developpment
Al Aluminum
APBD Anggaran Pendapatan dan Belanja Daerah
(Regional Expenditure and Revenue Budget)
APBN Anggaran Pendapatan dan Belanja Negara
(State Expenditure and Revenue Budget)
APL Area Penggunaan Lain (area for other use)
APPI Association of Fertilizer Producers
AR Afforestation and Reforestation
AS Ammonium Sulfate
AWS Automatic Weather Stations
BALITKILIMAT Badan Penelitian Klimatologi dan Hidrologi
(Research Agency on Agro-climatology and Hydrology)
BAPLAN Badan Planologi Kehutanan
(ForestryPlanology Agency)
BAPPEBTI Badan Pengawas Perdagangan Berjangka Komoditi
(Indonesia’s Commodity Futures Trading Regulator)
BAPPENAS Badan Perencanaandan Pembangunan Nasional
(National Development Planning Agency)
BAU Business as Usual
BBM Bahan Bakar Minyak (Fuel Oil)
BBN Bahan Bakar Nabati (Biofuel)
BBSLDA Centre for Agriculture Land Resources and Development
BIM Basis Industri Manufaktur
(Industry Manufacture Base)
BKF Badan Kebijakan Fiskal
(Fiscal Policy Office)
BKPM Badan Koordinasi Penanaman Modal
(Investment Coordinating Board)
BMKG Badan Meteorologi, Klimatologi dan Geofisika
(Meteorology, Climatology and Geophysical Agency)
BOCM Bilateral Offset Credit Mechanism
BOD Biological Oxygen Demand
Bpd barrels per day
BPPT Badan Pengkajian dan Penerapan Teknologi
xii(Agency for Technology Assessment and Application)
BPS Badan Pusat Statistik
(Indonesian Bureau of Statistic)
BPSDA Balai Pengelolaan Sumber Daya Air
(Water Resources Management Center)
BtCO2 billion ton of carbon dioxide
C Confidential
CAIT Climate Analysis Indicators Tool
CBM Coal Bed Methane
CCROM-IPB Centre for Climate Risk and Opportunity Management-Bogor Agriculture
University
CCS Carbon Capture and Storage
CDM Clean Development Mechanism
CER Certified Emission Reduction
CFBC Coal Fluidized Bed Combustion
CGE Consultative Group of Experts
CH4 Methane
CI Cement Industry
CI Cropping Index
CIFOR Center for International Forestry Research
CL Crops Land
CO2 Carbon Dioxide
CO2e Carbon Dioxide Equivalent
COP Conference of Parties
CP Cement Production
CWPB Center-Worked Prebake
DEN Dewan Energi Nasional
(National Energy Council)
DJK/DGE Direktorat Jenderal Ketenagalistrikan
DGE/DJK Directorate General of Electricity
DNA/KOMNAS MPB Designated National Authority
DNPI Dewan Nasional Perubahan Iklim (NCCC Indonesia)
EBTKE Energi BaruTerbarukan dan Konservasi Energi
(New and Renewable Energy and Energy Conservation)
EB Executive Board
EC Energy Conservation
EE Energy Efficiency
EG Electricity Generation
EG Expert Group
ESC Energy Saving Certificate
ET Emission Trading
ETS Emission Trading Systems/Scheme
EU European Union
EU ETS European Union Emission Trading System
FIT Feed in Tariff
xiiiFGD Focused Group Discussion
GDP Gross Domestic Product
GGFR Global Gas Flaring
GHG Green House Gas
GoI Government of Indonesia
GRK Gas Rumah Kaca
(GHG- Green House Gas)
HR Hutan Rakyat
(Community Forest)
HSD High Speed Diesel
HTO Industrial Plantation Forest
ICCSR Indonesia Climate Change Sectoral Road Map
ICCTF Indonesia Climate Change Trust Fund
IDO Industrial Diesel Oil
IEO Indonesia Energy Outlook
IPCC Intergovernmental Panel on Climate Change
IPP Independent Power Producer
IT Implementing Team
JAMALI Jawa Madura Bali – Electricity Interconnected System
JI Joint Implementation
J VER Japan Verified Emission Reduction
JVET Japan Verified Emission Trading
KEN Kebijakan Energi Nasional
(National Energy Policy)
KOMNAS MPB Komisi Nasional Mekanisme Pembangunan Bersih, (Indonesia DNA)
KP Kyoto Protocol
K VER Korean Verified Emission Reduction
LoA Letter of Approval
LUCF Land Use Change and Forestry
LULUCF Land Use, Land Use Change, and Forestry
M Monitoring
MBI Market Based Instrument
MBOE Million Barrel of Oil Equivalent
MEMR Ministry of Energy and Mineral Resources
MFO Marine Fuel Oil
MIC mineral in cement
MMSCFD million metric standard cubic feet per day
MoE Ministry of Environment
MoF Ministry of Forestry
MoI Ministry of Industry
MoPW Ministry of Public Work
MoT Ministry of Transportation
MP3EI Masterplan Percepatan dan Perluasan Pembangunan Ekonomi
(Masterplan on Acceleration and Extension of Economic Development)
MRP Market Readiness Proposal
xivMRV Measurable, Reportable and Verifiable
(Measurement, Reporting, Verification)
MtCO2 Million ton carbon dioxide
NAMA Nationally Appropriate Mitigation Action
NAPCC National Action Plan on Climate Change
NCCC National Council on Climate Change
NCM National Consultation Meetings
NDP/BAPPENAS National Development Planning Agency
(Badan Perencanaan dan Pembangunan Nasional)
NEC (DEN) National Energy Council
(Dewan Energi Nasional)
NGO Non-Government Organization
NMM New Market Mechanism
NRE New and Renewable Energy
NZ ETS New Zealand Emission Trading Scheme
PC Project Coordinator
PDD Project Design Document
PermenESDM Ministerial Regulation of the Ministry of Energy and Mineral Resources
PermenPerind Ministerial Regulation of the Ministry of Industry
PFC Perfluorocarbon
PoA Program of Activity
P3B Penyaluran dan Pusat Pengaturan Beban
(Distribution and Load Control Center)
PIU Project Implementation Unit
PLN Perusahaan Listrik Negara
(State Electricity Enterprise)
PLTM Pusat Listrik Tenaga Mikrohidro
(Micro-hydro Power Plant)
PLTP Pusat Listrik Tenaga Panas Bumi
(Geothermal Power Plant)
PLTU Pusat Listrik Tenaga Uap Batubara (Coal-fired Power Plant)
PMR Partnership for Market Readiness
PPA Power Purchase Agreement
ppm Parts per Million
PPP Purchasing Power Parity
R Reporting
RE Renewable Energy
REDD Reducing Emission from Deforestation and Degradation
RGGI Regional Greenhouse Gas Initiative
RPJM Rencana Pembangunan Jangka Menengah
(National Medium-term Development Plan)
RPJP Rencana Pembangunan Jangka Panjang
(National Long-term Development Plan)
SBM Setara Bahan Bakar Minyak
(TOE – ton of oil equivalent)
xvSC Steering Committee
SF6 sulfur hexafluoride
SKN Skema Karbon Nusantara
(Nusantara Carbon Scheme)
SNC 2010 Second National Communication 2010
SCP Second Crash Program
SOP Standard of Procedure
TDM Transportation Demand Management
TOR Terms of Reference
TOE Ton Oil Equivalent
UNFCCC United Nations Frameworks Convention on Climate Change
USD United States Dollars
V Verification
VCM Voluntary Carbon Market
VCS Verified Carbon Standard
VER Verified Emission Reduction
WB World Bank
WT Working Team
YBUL Yayasan Bina Usaha Lingkungan
xviMARKET READINESS PROPOSAL (MRP) FOR INDONESIA:
IDENTIFYING SUITABLE MARKET INSTRUMENTS
INTRODUCTION
The Partnership for Market Readiness (PMR) is a capacity building trust fund that provides grant
funding and technical assistance for the collective innovation and piloting of market-based
instruments for GHG emission reductions. As indicated in “The Tool for Market Readiness Proposal”
(Final Version 1, December 17, 2011, page 4), one of the main purposes of the PMR is to help
countries identify suitable market instruments to scale up mitigation efforts in line with their climate
change mitigation goals and development objectives. “Market instruments” refer to domestic
instruments, such as emissions trading schemes (ETS), and scaled-up market-based mechanisms,
such as offset systems, which may have domestic and international elements. The first step toward
implementing a market-based instrument is to build market readiness capacity (policy, technical and
institutional). The project will also propose to develop MRV systems and other efforts toward the
creation of a regulatory framework for the implementation of market-based instruments.
As many countries do, Indonesia seeks to establish and enhance market-based mitigation action and
use carbon pricing to achieve climate related objectives. Emission reductions in the form of carbon
credits can be used to meet climate commitments while simultaneously contributing to low-
emissions economic development. Indonesia is looking forward to having a well-developed carbon
market by virtue of positive cooperation with international institutions including the PMR.
This paper formulates Indonesia’s market readiness and capacity proposal, which involves assessing
and identifying suitable market instruments and sectors, technical, policy, and institutional
components, and piloting market instruments. This Market Readiness Proposal (MRP) consists of
three programs for consideration by the Partnership Assembly (PA), namely emission profiling and
MRV system development in the power sector and in energy intensive industries, and development
of a framework for implementation of market-based instruments.
The approach pursued by this paper includes the following goal, objectives, and purpose:
The Long Term Goal: The establishment of a new mechanism or market based instrument for
mitigation actions in Indonesia based on country-specific conditions and international carbon market
situations.
The Objectives: To understand and identify the type and scope of suitable market-based
instruments, drafting and establishment of new regulation needed, design and establishment of the
market infrastructure, identification of methodologies and market-based instruments, and building
the required human resources capacity.
The Purpose: To develop and encourage consensus and commitment, knowledge, competence,
ideas, and recommendations of the ministries and other stakeholders which may be involved in the
forthcoming market instrument.
1CHAPTER 1. THE BIG PICTURE, POLICY CONTEXT
1.1 Country Information
1.1.1 Geographical Features
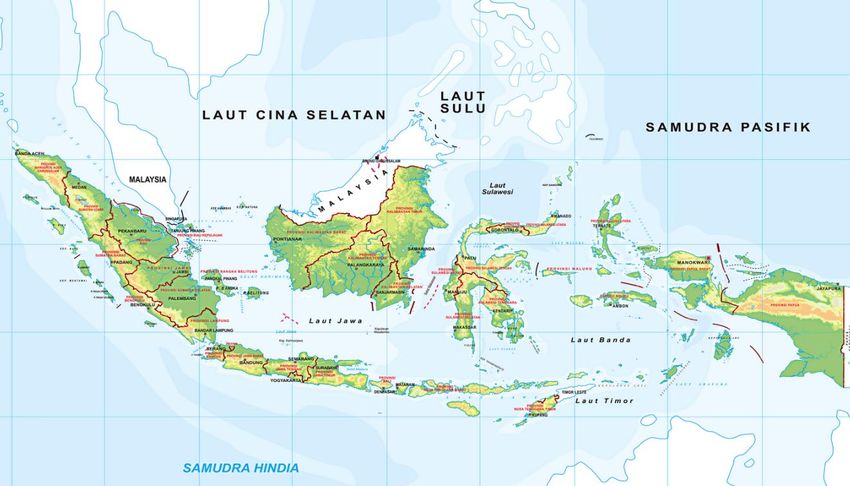
1. Indonesia is located between 6o08’ North latitude and 11o15’ South latitude, from 94o45’ to
141o05’ East longitude. It is an archipelago with five big islands (Sumatera, Java, Kalimantan,
Sulawesi, and Papua) and 13.7 thousand small islands. Among the small islands, 56% are
nameless and 7% are inhabited. Indonesia has 7.9 million km2 maritime areas (81% total area,
1.86 million km2 land area, 81,000 km coastline, 0.220 million km2 arable lands, 40% wetland
(rice fields), 40% dry land, 15% shifting cultivation).
2. Indonesia shares land borders with Malaysia on the islands of Borneo and Sebatik; Papua New
Guinea on the island of New Guinea; and East Timor on the island of Timor. Indonesia also
shares borders with Singapore, Malaysia, and the Philippines to the north, and Australia to the
south across narrow straits of water.
Figure 1. Map of Indonesia
3. The country has two seasons: dry and rainy with three rainfall peak patterns, i.e. monsoon
(December), local (July-August), equatorial rainfall (March and October). Based on location,
the pattern can be further categorized into two groups indicated by a clear distinction
between dry and wet throughout the year, namely the eastern part (East Nusa Tenggara) with
drier and longer periods, and the western part (Java, South Sumatra, South Sulawesi). In
general, rainfall variation is larger during the dry season (April-September) compared to the
wet season (October-March).
24. These features give Indonesia a special condition in regards to climate change. The country
needs multiple transportation modes to distribute goods as well as distributed power plants to
electrify its small islands, both of which are heavy emitters. Within the climate change
adaptation context, its small islands are vulnerable to sea level rise, extreme weather events,
and many other climate change impacts.
1.1.2 Demography
5. Indonesia’s population has risen from 179.4 million (1990) to 242 million (2011), or around
3.5% of the world's population. The population growth rate is 1.3% per year. Demographic
composition is dominated by a productive age group (15-64 years old) comprising 68% of the
total population with an approximate balanced portion of male and female.
6. The National Agency for Statistics (BPS) has made projections to predict the country’s
demographic patterns through 2025. It reported that population is predicted to continue
growing with a rate of 1.1% and 0.9% between 2010-2020 and 2020-2025, respectively. This
means population is predicted to reach 273.2 million people by 2025. Most of the population
will be in the productive age group (69%). This demographic composition is advantageous to
Indonesia in accelerating its development.
7. About 58% of the population lives in Java, while the land area of Java is only 7% of the total
area of the country. Most people (60%) live in rural areas. The remaining 40% live in urban and
peri-urban areas. On average, there are 3.65 members per household.
1.1.3 Economic Features and Trend
8. Indonesia has made significant economic advances in the past decade, but faces challenges
stemming from the global financial crisis and the global economic downturn. Indonesia's debt-
to-Gross Domestic Product (GDP) ratio in recent years has declined steadily because of
increasingly robust GDP growth and sound fiscal stewardship. The government has introduced
significant reforms in the financial sector, including in the areas of taxation and customs, the
use of treasury bills, and capital market supervision. Indonesia's investment law, passed in
March 2007, seeks to address some of the concerns of foreign and domestic investors.
9. In 2011, the GDP of Indonesia was 846 billion US dollars (USD) with income per capita of 3,500
USD. The major contributors to GDP are the manufacturing (24.3%), agriculture (14.7%), and
trading, hotels and restaurants (13.8%) sector. During 2000-2011, the GDP growth was in the
range of 5.6-6 % per year with an inflation rate of around 6–7%. It is expected that Indonesia’s
future economy will remain in moderate growth of around 5 – 7% per year. From 2007–2008,
the growth rate averaged 6.34%, while between 2010 – 2011 (2nd quarter) it averaged 6.08%.
10. The energy sector remains crucial to the Indonesian economy, both in terms of its contribution
to economic activities and in trade earnings. However, as the economy has matured and
broadened from resources extraction and trade into a stronger manufacturing and services
base, the contribution of the oil and gas sectors to GDP has declined. In 2000, the oil and gas
sector accounted for 12.4% of GDP, but this has rapidly declined in both absolute terms and as
a focus of the Indonesian economy. In 2011, it contributed only around 3.5%.
311. In general, Indonesian economic growth is still coupled with its GHG emissions growth rate.
The figure below is from the World Resources Institute’s Climate Analysis Indicators Tool
(CAIT) that shows such coupling. Indonesia’s high population density (132.41 people per km2 in
2010, the 76th of 214 countries as reported by World Bank 2012) also contributes to significant
emissions.
Figure 2. Growth of Indonesian Various Indicator, 1990-2007
1.2 Combating Climate Change
12. It is recognized that developed countries should take the lead in combating climate change
(Para. 1 of Art.3 UNFCCC), but there are opportunities for developing countries to also do their
part. However, in terms of cooperation and policy development, contributions from
developing countries have not been insignificant. International negotiations on climate change
have been, to a large degree, focusing on giving place and encouraging developing countries to
negotiate a comprehensive framework for enhanced action on mitigation, adaptation, and
other key elements.
13. Indonesia is doing its part to reduce GHG emission concentration in the atmosphere as
evidenced by its ratification of the UNFCCC through Indonesian Law No. 6/1994 and the Kyoto
Protocol through the Indonesian Law No. 17/2004. Following these two ratifications, Indonesia
endorsed the CDM project scheme, established a DNA (KOMNAS MPB), established the
Sustainable Development Criteria as required by CDM, and performed many capacity building
activities on CDM for government officials, the private sector, academia, and other related
sectors. These capacity building activities helped to enhance CDM and the design of CDM
projects by the private sector. The 2007 Bali Action Plan, for example, produced a decision
4proposed by Indonesia to adopt the Nationally Appropriate Mitigation Actions (NAMA) by
developing countries containing key elements: (i) promote sustainable development; (ii)
supported and enabled by technology, financing, and capacity building; and (iii) in a
measurable, reportable, and verifiable manner.
14. Climate change is an important issue in Indonesia. The country consists of thousands of islands
with low-lying coastal areas liable to floods as well as arid lands and a fragile mountainous
ecosystem. The country is also densely populated, making it the world’s fourth largest
populated country. The country's GHG emissions are large and continue to increase rapidly
not only because of a growing population, but also because of the increasing growth rate of
the economy. Indonesia needs to act to face the climate change threat, to prevent man-made
natural disasters, and to make every effort to cope with problems through climate change
mitigation and adaptation actions. The country continues to actively participate in
international negotiations on formulating effective efforts in combating global GHG emissions.
Indonesia presented its First National Communication to the UNFCCC in 1999, while the
Second National Communication (SNC) was completed in year 2011.
15. The national focal point to the UNFCCC is the National Council for Climate Change (Dewan
Nasional Perubahan Iklim - DNPI), an institution established with the Presidential Regulation
No.46/2008 chaired by the President, and hence reports directly to the President. The tasks of
DNPI are to coordinate the implementation of climate change activities, facilitate policy
placement, and strengthen Indonesia’s position in international forums.
1.3 Overview and composition of Indonesia’ GHG emissions and trends by sector
16. According to Indonesia’s Second National Communication (SNC), the total estimate of
Indonesia’s annual emission in 2005 came to 1,791.37 MtCO2 to which the energy sector
contributed 369.8 MtCO2 and industrial processes contributed 48.73 MtCO2. As depicted in
Figure 3 below, while the land-based sectors, including forestry, peat-land, agriculture, and
other land-based activities contributed 67% to the total national GHG emissions, the
contribution of these sectors to total GDP was only 27%. The GHG emission of the land-based
sectors has become a heavy burden to the non-land-based sectors. The size of Indonesia’s
GHG emissions, based on a BAU scenario, is predicted to continue rising over the next ten to
fifteen years. This is due to: (i) population size (242 million people in 2011); (ii) the high
annual growth rate of the population, ranging from 1.8% to 2.0% over the last ten years; (iii)
the relatively high economic growth rate (ranging from 6% to 7% over the past five years); and
(iv) the rapidly increasing size of the medium-income class segment whose lifestyles can be
characterized by high income and consumption levels.
17. The land use change and forestry (LUCF) and peat sector will still dominate Indonesia’s
emissions trend until 2020, with emissions from the energy sector following closely behind.
Contribution of the agriculture and industrial sectors are relatively stable. There is, however, a
slight increase in the contribution of emissions from the waste sector in 2020 as depicted in
Figure 3. The figure shows historical emissions until 2005 where the spike in LUCF and peat
emission in 2002 was due to the El Nino phenomenon causing more forest and peat fires.
5Year
Source: Second National Communication (SNC), 2010
Figure 3. Historical and Projection of GHG emission under BAU scenario
18. Even though Indonesia’s GHG emissions are mostly from LUCF and peat, this proposal focuses
on emissions from the energy and industry sectors. LUCF and peat emissions are excluded
from the PMR initiative. The rationale for focusing on energy and industry will be elaborated
upon in Building Block 2.
1.3.1 Sectoral Emissions - Energy
19. Emission from the energy sector contributed about 21% of Indonesia’s total emissions, which
mainly come from energy production, manufacturing, construction, and transportation. These
emissions could also be derived from Indonesia’s final energy consumption, which for example
in 2008 totaled 658.38 million of barrels of oil equivalent (MBOE), as can be seen in the chart
below (Figure 4). The industry dominated the final energy consumption at almost 50%,
followed by the transportation sector at 31%, and households at 13%. The rest is comprised of
the commercial and agriculture, construction, and mining (ACM) sectors.
6Year
Source: SNC, 2010
Figure 4. Final energy consumption in Indonesia (2000-2008)
20. The type of final energy consumed was mainly oil products and coal, both contributing to
about 72% of final energy consumption.
Table 1. Type of final energy consumption by sector
Oil Natural
Sector LPG Coal Electricity
Products Gas
Industry 15% 0% 27% 49% 9%
Transportation 100% - 0% - 0%
Household 47% 16% 0% - 36%
Commercial 25% 4% 0% - 68%
Others 100% - - - -
Total Percentage 47% 2% 14% 24% 12%
Source: SNC, 2010
21. Energy related emission is projected to increase with the highest growth rate. This is mainly
because energy supply needs to keep-up with the demands of development. The fastest and
least-cost options were sought, such as with the Fast-Track 10,000 MW Power Plant Program
Phase I and Phase II, which promotes the utilization of coal-fired power plants, but eventually
leads to the increase of CO2 emissions from coal, as can be seen in Figure 5 below.
7Source: ICCSR, 2010
Figure 5. Estimated GHG Emission from fossil fuel
22. There are initiatives to reduce the dependency on the fossil fuels, as well as reduce associated
GHG emissions, such as through the 2006 National Energy Plan that targeted the 2025 energy
mix having 17% of primary energy coming from new and renewable energy sources and a
national energy elasticity of GDP of less than 1. Furthermore, the working paper from the
National Energy Council (NEC) shows the more optimistic draft of the energy mix scenario
from 2010 to 2050 (Figure 6), which expects an increase in the contribution of new and
renewable energy reducing the contribution of oil, coal, and gas in the national energy mix.
This should also reduce emission from the energy sector as long as growth does not
significantly outpace energy supplied by renewables.
Source: DEN
Figure 6. Energy mix from 2010-2050
81.3.2 Sectoral Emissions - Industry
23. From industrial processes, Indonesia’s emission profile and trend increased from 43.04 MtCO2
in 2000 to 48.73 MtCO2 in 2005, amounting to an increase of about 13.2% (or 2.2% per year).
GHG emissions from the industry sector are comprised of CO2, CH4, N2O, and perfluorocarbon
(PFC). PFC is emitted from the production of aluminum (Al) from a single smelter company,
which uses Centre-Worked Prebake (CWPB) technology.
24. Major GHG emissions from production processes in the industry sector are mainly from the
production of mineral products (67%); followed by chemical products (22%), metal products
(10%), and others (1%). By subsector, the dominant sources of emissions are from the cement
and ammonium industries. As evidenced in Figure 7 below, the two industries account for
around 60-80% of the total CO2 emissions of all the industry subsectors.
Figure 7. GHG emissions estimates from production process activities
25. As the co-benefit of reducing GHG emissions from industrial processes is not yet well-known,
industries may need additional incentive to reduce emissions. This should be considered in the
PMR implementation phase.
1.4 Indonesia’s pledge on mitigation actions
26. COP 16 in Cancun, Mexico, again emphasized the need for deep cuts in GHG emissions, and
agreed that developing countries will undertake NAMAs in the context of sustainable
development, supported and enabled by technology, financing, and capacity building, aimed
at achieving a reduction in emissions relative to BAU in 2020 (paragraph 48 of Decision
1/CP.16). In addition, Decision 1/CP reaffirmed the two categories of NAMAs by developing
countries: (i) domestically supported mitigation actions as unilateral or voluntarily NAMAs; (ii)
internationally supported mitigation actions as supported NAMAs. In addition, in COP 16 in
9Cancun, PMR was initiated and organized by the World Bank aiming at supporting developing
countries in enhancing their readiness for the carbon market.
27. The emission reduction measures by developing countries through NAMAs to be reported by
national governments to the UNFCCC are thought to provide a new opportunity for developing
countries to take action in reducing emissions while still allowing for growth to meet their
social and development needs.
28. Indonesia’s President Susilo Bambang Yudhoyono in his statement at the G20 Leaders’ Summit
in Pittsburg, USA (September 2009) firmly said: “We must tell the world it is possible to cure
the global economy and save the planet at the same time.” The President announced
Indonesia’s commitment to devising policies, including for the energy and land use sectors,
that will reduce its emissions by 26% from the “business as usual” (BAU) scenario by 2020, and
with international support to further reduce its emissions by an additional 15% (See Figure 8).
In addition, with credited NAMAs, a further reduction beyond Indonesia’s 41% target would be
possible.
Source: Bappenas
Figure 8. Indonesia’s National Emission Reduction
29. In terms of how the reduction can be achieved, as per the communication delivered by the
Head of DNPI to the UNFCCC Secretariat on January 30, 2010, seven key sectors have been
designated to reduce GHG emission by 26% in 2020 from the BAU baseline scenario, as shown
in Table 2.
10Table 2. Seven Key Sectors of NAMAs
Emissions
Nationally Appropriate Mitigation Actions
Reduction
The reduction will be achieved among them by the following actions:
1. Sustainable peat land management
2. Reduction of deforestation and land degradation
3. Carbon sequestration development 26% by 2020
4. Promoting energy saving
5. Alternative and renewable energy resource development
6. Solid and liquid waste reduction
7. Shift to low-emission transport modes
Source: RAN-GRK
30. The actions listed above are a broad definition of Indonesia’s NAMAs. As depicted in Figure 8
above, credited NAMAs are also considered as a possible mechanism to scale up mitigation
actions in Indonesia. However, for dealing with predicted/emerging market mechanisms, such
as NAMA/sectoral/bilateral crediting, Indonesia would need new capacity and expertise,
partially or wholly, and consequently Indonesia will need to complete significant steps of
preparation and analyses.
1.5 Climate change policy framework
31. To fulfill its commitment, GoI began establishing a national policy framework on climate
change, which included the development of the 2009 Indonesia Climate Change Sectoral
Roadmap (ICCSR). Furthermore, the commitment was strongly reaffirmed by enacting the
Presidential Regulation No. 61/2011 on the National Action Plan for Greenhouse Gas
Reduction (the RAN-GRK). Substantially, RAN-GRK has the following functions and roles:
First, it provides a policy framework for the central government, local governments,
private sectors, and other key stakeholders in implementing actions related directly
and indirectly to GHG emission reduction efforts from 2010 – 2020.
Second, it becomes a reference for the public and for businesses with regard to
planning and reduction of GHG emissions.
Third, RAN-GRK is part of the Long-Term Development Plan (RPJP 2005-2025) and the
Mid-Term Development Plan (RPJM 2010-2014).
32. Both unilateral (26% reduction) and supported (additional 15% reduction) actions are
estimated as amounting to 767 MtCO2 and 477 MtCO2, respectively. This quantitative target
has been established in the annexes of RAN-GRK and can periodically be reviewed according
to national needs and international developments, which can be carried-out by
ministries/institutions coordinated by the National Development Planning Agency (BAPPENAS)
through RAN-GRK, article 9a. The summary of sectoral targets and the associated activities are
listed in Table 3 where the 41% emission reduction target is the combined unilateral and
supported target.
11Table 3. Emission Reduction Targets and Action Plan by Sector in 2020
Emission Reduction
Responsible
Sector (MtCO2eq.) Activities
Ministry(ies)
Unilateral Supported
Forest and land fire control, network system Ministry of Forestry;
management and water management, forestry and Ministry of Public Works
Forestry
land rehabilitation, HTO (Industrial Plantation
and Peat- 672 1,039
Forest), HKm (Community Forest), illegal logging
land
eradication, deforestation prevention, community
empowerment, etc.
Introduction of low emission paddy varieties, Ministry of Agriculture;
Agriculture 8 11 irrigation water efficiency, organic fertilizer use, land Ministry of Public Works
use optimization, waste utilization, etc.
Bio-fuel use, engines with higher fuel efficiency Ministry of Energy and
standard, improvement in TDM (Transportation Mineral Resources;
Demand Management), quality improvement of Ministry of Transport;
Energy and public transport and road, demand side Ministry of Finance;
38 56
Transport management, energy efficiency, renewable energy Ministry of State Owned
development, post-mining replanting, etc. Enterprises; Jakarta
Government; Ministry of
Public Works
Process modification and clean technology Ministry of Industry
implementation, energy management in energy-
Industry 1 5
intensive industries e.g. cement, ozone-depleting
substances eradication, etc.
Waste management by 3R, and urban integrated Ministry of Public Works
Waste 48 78
waste water management
TOTAL 767 1,189
Source: RAN-GRK, 2011
33. To ensure that implementation will reach the goals and targets, several interventions and
action plans will be initiated to align the climate change mitigation program and policy with
the programs and policies of local governments (provincial, district, city mayor) and several
ministries/agencies. BAPPENAS is the agency responsible for coordinating, monitoring, and
evaluating the implementation of RAN-GRK.
34. As specified in Article 11, Presidential Regulation No. 61/2011, the funding of RAN-GRK is
derived from the State Revenues and Expenditures Budget (APBN), Regional Revenues and
Expenditures Budget (APBD), and other legal and unbinding sources in accordance with
prevailing laws and regulations. Roles have been designated for institutions responsible for
GHG emission reduction activities in each sector and responsible stakeholders for GHG
emission reduction supporting activities. For these purposes, the ministers in charge of the
sectors involved may issue the necessary ministerial level regulations, decrees or decisions, for
example Regulation No. 12/2012 of the Ministry of Industry on the road map for emissions
reduction in the cement industry.
35. Another central climate change policy of Indonesia is Presidential Regulation No. 71/2011 on
the implementation of a national GHG inventory. This policy mandates periodic information on
the level, status and trends of GHG emissions by sources, sink, and reservoirs at the national,
provincial, and sectoral level, as well as information regarding achievements related to
national mitigation actions. The focal point of this regulation is the Ministry of Environment
(MoE) to which other ministries and provincial governments must submit their GHG reports.
12You can also read