Max India Limited Investor Presentation - June 2018
←
→
Page content transcription
If your browser does not render page correctly, please read the page content below
Max India Limited
                    Investor Presentation
                          June 2018

www.maxindia.com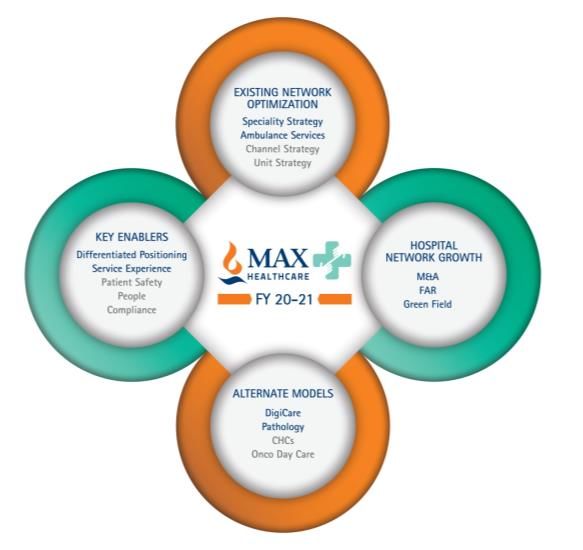
Max Group Vision
“To be the most admired corporate for service excellence”

                       • Positive social impact   • Culture of Service
          Sevabhav
                       • Helpfulness              • Mindfulness

                       • Expertise                • Entrepreneurship
         Excellence
                       • Dependability            • Business performance

                       • Transparency             • Respect
         Credibility
                       • Integrity                • Governance

                                                                           1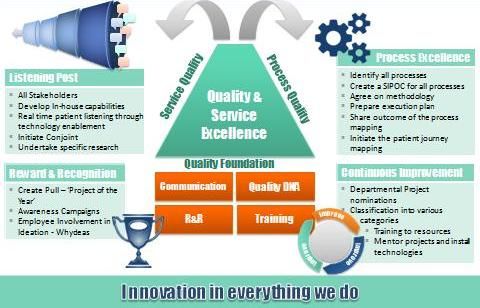
Evolution of Max Group—Strong history of
                      entrepreneurship and nurturing successful businesses
                                                                                NYL exits and JV with               Max India demerged into
                                      Fund raising ~ USD 360 Mn
                                                                                MSI in 2012                         3 listed hold cos
 Enters Telecom in JV                 ● QIP- USD 156 Mn in 2007
                                                                                ● MSI is world’s 7th largest
   with Hutchison                     ● Warburg Pincus - 53 Mn in 2005            general insurance group
                                      ● IFC- 47 Mn(2007) &23 Mn (2009)          ● MSI acquired 26% stake for
   Hutchison                                                                      USD 425 Mn
                                      ● Goldman Sachs 82 Mn in 2011
JV with Gist Brocades
                                                                                ● Max Life valued at USD 1.6
 (Asia’s largest Drug
                                                                                  bn
   manufacturer )

1985      1993 2000             2005 2007             2009    2011       2012           2013          2014           2015           2016

Forays into                                                                                LHC inducted as JV
 Penicillin                                                                                                             Landmark Acquisitions
                                                                                           Partner in MHC               by MHC
bulk pharma
                                                                                           ● LHC is 2nd largest hospital ● Acquired 79% stake for
                 Shift from B2B to                                     Enter Senior          chain in South Africa         USD 40 Mn in 340 bedded
                 B2C businesses:                 Health Insurance,   Living business,      ● 2012 - Acquired 26% stake     Pushpanjali hospital
                 ●Life insurance                                        launch first         for USD 81 Mn in MHC          expandable  upto 540 beds
                                                 JV with Bupa Plc     community in ● 2014 - Equalize stake in           ● Acquired 51% stake for
                 ●Healthcare                                          Dehradun with   MHC invests USD 120 Mn              USD 100 Mn in 230
                                                                         200 units                                        bedded Saket City
                 ●Clinical research                                                                                       hospital, expandable upto
                                                                                                                          1200 beds

  Note: Conversion rate assumed 1 USD = INR 64
                                                                                                                                               2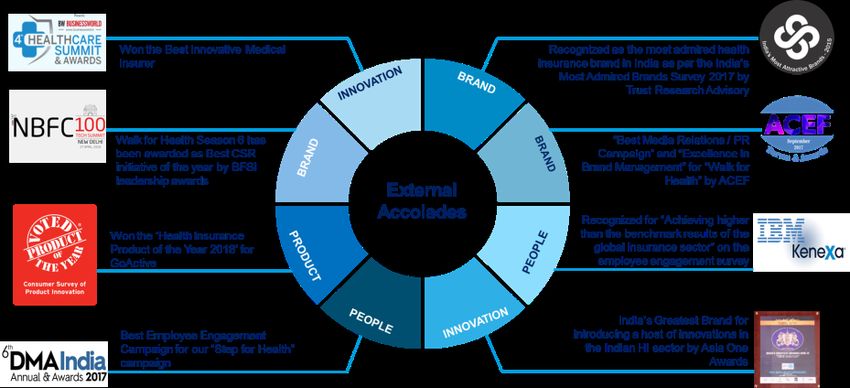
Max Group – Corporate Structure
                                              Max Group - Sponsors

               30.3%                                41.0%                    38.1%
Companies
 Holding

                Life Insurance                      Health & Allied    Manufacturing &
                   Business*                            Business       Other businesses

                                               50%                    51%
            70.75%
Companies
Operating

                                                                      100%
                                               51%

                                                                      100%

                                                100%
                                                                      100%

 Group
CSR Arm
            Sponsors stake in Max Group holding companies
                                                                                          3
Max Group Overview

1   USD 3 billion+… 10 Mn Customers… 25,000 Employees… ~70,000 Agents…
    2,900 Doctors…

2   Strong growth trajectory even in challenging times; a resilient & diversified business model

3   Steady revenue growth and cost rationalization leads to strong financial performance

4   Well established board governance….internationally acclaimed domain experts inducted

5   Diversified ownership…..marquee investor base

6   Superior brand recall with a proven track record of service excellence

7   Strong history of entrepreneurship and nurturing successful business partnerships

                                                                                                   4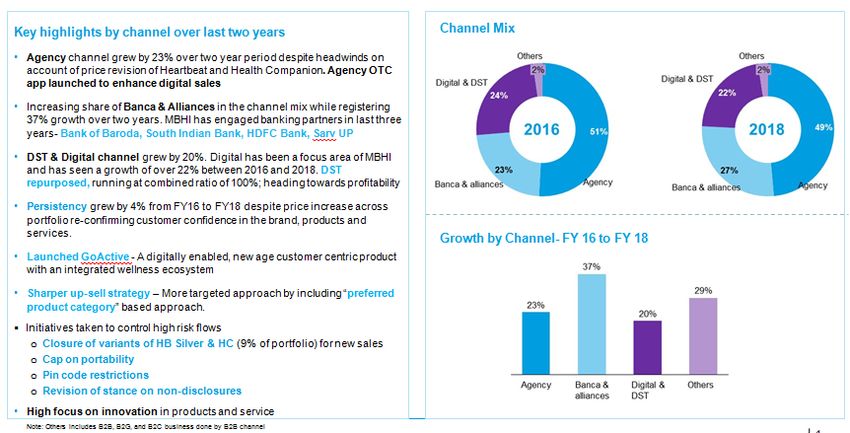
Max Group : Continues to grow from strength to strength
                           Group Revenue (USD Mn)

                                                            2,945
                                                    2,584
                  1,915            2,190
      1,639

     FY'14        FY'15            FY'16            FY'17   FY'18

                            Group EBITDA (USD Mn)

                                                     127     129
                    95              110
       81

      FY'13        FY'14           FY'15            FY'16   FY'17

                                                                    5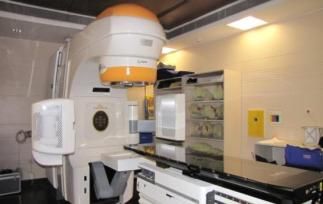
Max India: High pedigree investor base
Shareholding concentrated with Marquee Investors
Shareholding Pattern
Ward Ferry
as on Mar 31, 2018
International Finance Corporation 0.0% 0.0% 0.0% 0.0%
Target Asset management
New York Life Insurance Others
13.9%
Nomura Singapore
Doric Capital
Mutual Promoters
Comgest Funds 41.0%
17.5%
TVF Fund
Government of Singapore
Steinberg Emerging Opportunities Fund
FII/ FPI IFC
Reliance Mutual Fund 24.5% 3.1%
L&T Mutual Fund
HDFC Standard Life Insurance
UTI Mutual Fund
Number of outstanding shares* : 26.84 Cr.
* Max Group Sponsors hold warrants convertible into 4% equity stake, post conversion Sponsor’s stake will increase form 41% to 45%, on fully-diluted equity base will
increase to 28.7 Cr shares post conversion
6
MAX INDIA LIMITED
MAX HEALTHCARE

www.maxhealthcare.in   www.maxindia.com

                                    7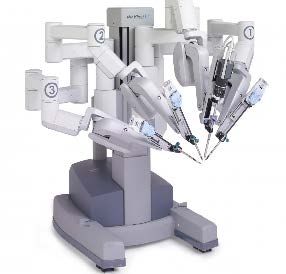
Indian healthcare industry is expected to reach ~$470 billion fuelled by multiple
 demand drivers

 Indian healthcare sector *
 Estimated size, Bn USD
                                                                               CAGR
                                                                              16.5%

                                                                                                            450-470
                           CAGR
                          15.0%                                      280              320-340
                                                160
       60                    79

       2010                2012                 2017                2020                 2025                 2025
                                                                                   Business As Usual        Aspirational

 Demand drivers for growth

              ~500 mn                                  ~134 mn                                   ~320 mn

         additional middle                          population > 60                         at risk of dying due
          class by 2025                              years by 2020                           to NCDs by 2020
               ~45%                                     ~$8 bn                                     ~2 mn

            Insurance                              medical tourism                           beds required by
        penetration by 2020                       market size by 2020                             2025

* Includes hospitals, pharmaceuticals & medical technology / other companies
Sources: India Brand Equity Foundation – Healthcare report, July 2017, BofA Merrill Lynch Global Research                  8
Hospitals constitute ~70% of Indian healthcare market with increasingly
dominant role of private sector

Indian healthcare
                                            Private players have established a dominating presence in tertiary /
   sector*                                  quaternary care
Market share %

                                                   30%                                           22%         20%
                                                                  37%            40%

                                                   70%                                           78%         80%
                                                                  63%            60%
              10%

                                              Market Share       Beds          Inpatients    Outpatients   Doctors
     20%
                                                                    Private sector     Public sector

                                            Market size of private hospitals is expected to reach ~$ 120 bn by 2020
                         70%
                                           Private sector hospitals
                                                                                                           120
                                           Estimated size, Bn USD                                 CAGR
                                                                                                  ~20%
                                                                                            81
                                                                      CAGR
                                                                      ~24%
Hospitals                                                              36
                                                  22
Pharmaceuticals
Medical technology / Others
                                                 2009                 2012               2015              2020

* Includes hospitals, pharmaceuticals & medical technology / other companies
 Sources: BofA Merrill Lynch Global Research, IBEF Mar'15                                                             9
At current level of public sector spending the scenario is not likely to change
India- public spend on Healthcare
% of GDP
8-10% Developed countries
~8% USA
5%+ WHO guidelines
3.5-4% BRICS- excluding India
2.50%
1.15% 1.40% 1.30% 1.20%
FY14 FY15 FY16 FY17 FY20-22
Hence, Government will keep shifting the burden of public health provision
towards private sector
Source: LiveMint research, World Bank database, Hindustan Times
10Competition is intensifying with scale-up of well funded incumbents &
availability of capital for new players
The surge of VC/ PE investments in recent years has eased funding constraints on growth
Annual VC/ PE investment’s in India’s Healthcare ($ Million)
~3x
1,359 1,584
1,262 1,111
900
580 495
2010 2011 2012 2013 2014 2015 2016
No. of
deals 35 29 65 60 54 50 86
Recent examples
TARGET INVESTOR AMOUNT DATE TARGET INVESTOR AMOUNT DATE
$221 mn Jan ‘16
$43 mn Jul ‘17
$68 mn May ‘16
$171 mn Aug ‘17
$63.5 mn Dec ‘16
N.A Ongoing
$200 mn Jul ‘17
Source: Crisil research, company websites and presentations, secondary sources
11MHC vision
To deliver international class healthcare with a total service
focus, by creating an institution committed to the highest
standards of medical & service excellence, patient care,
scientific knowledge, research and medical education
WHAT WILL WE BE KNOWN FOR KEY ENABLERS WHERE DO WE WANT TO BE
• Integrated care • Strong talent pool of • #1 in selected specialties in
clinicians, nurses and chosen geographies
• Clinical excellence healthcare leaders
• Focus on Tertiary and
• Transparency • Technology and Quaternary care
analytics enabled
• Speed clinical outcomes and • Physical infrastructure in
customer experience North India; however
• Tech enabled serving more than 300
continued care towns in India and 30+
countries
12MHC is a dominant player in North India
NCR OUTSIDE NCR
~2500 available beds
across the network
250
Pitampura*
Shalimar Bagh
224
293
410 Mohali
Patparganj
Vaishali 186
Lajpat Nagar* Bathinda
Panchsheel*
41 172
519 Dehradun
72 Saket
250 Noida
Max Smart
61
Gurgaon
Greater Noida
* Standalone Speciality Clinics with Outpatient and Day care facility
13MHC has invested in state of the art equipment to achieve clinical
excellence (1/2)
Robotics
Novalis
LINAC
Advanced robotics provides high precision, and High dose radiation with extreme
minimum invasive surgery across multiple precision (~ 0.5 mm accuracy)
specialities such as Oncology, Neurology
PET-CT
Brain suite
Advanced image guided surgery - Provides precise correlation and facilitates
provides real-time views and automated proper treatment for Oncology, surgical
image processing planning and radiation therapy
14MHC has invested in state of the art equipment to achieve clinical
excellence (2/2)
CyberKnife*
SPIDER
Robotic radio-surgery (non-invasive) system for Designed for revolutionary single incision
both cancerous & non-cancerous systems laproscopic surgery through catheter-based,
flexible instruments
Picture Archiving & Communication System - PACS
Economical digital storage and convenient access to medical
images from multiple modalities
* planned
15MHC has a robust service excellence & quality framework which has resulted in
enhanced customer experience
Top 2 Box Rating*
73% 80%
69%
57%
FY`15 FY`16 FY`17 FY`18
• “Sevabhav” trainings and Reward &
Recognition platform has led to
positive shift in mindset
• Structural Interventions through Six
Sigma and other methodologies has
resulted into business impact of over
USD 18 Mn
* MHC is the only healthcare company who has deployed a third party
(IMRB) to conduct Satisfaction survey 16MHC strong Governance Model helps us bring alignment and
improve accountability
Governance
Board & 7 committees
Investment & Medical Scientific Corporate
Nomination & Service
Audit performance excellence & projects & social
remuneration excellence
review compliance technology responsibility
Administration
Managerial Clinical
Group Medical
Executive Committee Advisory Council
(GMAC)
Hospital Medical
Unit Heads Executive Council
(HMEC)
Unit Management Doctor’s council
Committee (MANCO)
17MHC has a proven record of building an institution
Strengthened capabilities to provide comprehensive
tertiary & quaternary care
Network of highly qualified doctors, nurses and medical
personnel
Organic growth through expansion of hospital
network
JV with Life Healthcare, South Africa, extending MHC is one of the
First MHC expertise and global reach
top 3 healthcare
hospital started in chains in India
2002 Max Saket received JCI accreditation – highest
standards of clinical governance and compliance
ISO DL Shah FICCI Business
NABL/ Leadership
9001:2000 National Excellence World
NABH positions in
& ISO Award on Awards - Healthcare
accredited NatHealth
14001: 2004 ‘Economics Operational Award in Patient
and CII -
certified of Quality’ Excellence Experience &
healthcare
Safety
18MHC won 32 awards across multiple impact categories from various prestigious
institutions in FY17 and FY18
Operational Service Quality
Clinical Safety (7) Others (6)
Excellence (9) (10)
•Best patient safety •Best use of six sigma in •Best customer service in •ET Best Healthcare
initiative (prevention of Healthcare Healthcare brand
patient fall)
•Excellence in training
•Best quality initiative and development
(BCMA medication
process improvement )
•Bronze award for ‘Life
savers’ project (Max Bike
•Best green hospital
responder) at ‘American
(reducing carbon foot print
Society for Quality’
of tertiary care hospital)
•BPM Asia Star 2017 by
•Times Healthcare CII Institute of Quality
Achievers Award
19FY18 has been a year of reset caused by various regulatory interventions and
other headwinds (1/3)
• DPCO: Drug price controls
• Consumables and implants (stents, knee joints, syringes) price
control
• Minimum wage revision, Delhi State and other personnel cost
impacts (ESIC coverage, bonus notification, etc)
Sustained impact • EWS: Change in compliance norms
• GST: Increase in service tax rate from 15% to 18%
• Change in ECHS norms (Ortho)
• Recent announcement on Margin capping on non-NLEM drugs,
consumables and implants (Delhi govt led)
• Brand of corporate-led healthcare chains got impacted due to
One time impact multiple incidents in the sector during Q3/Q4
• Shalimar Bagh Hospital closure (Dec’17)
20FY18 has been a year of reset caused by various regulatory interventions and
other headwinds (2/3)
Phase 1 Phase 2 Phase 3
Rapid organic expansion and profitability through Large inorganic acceleration, Recalibration driven by
operating leverage but with some margin dilution regulatory interventions
MHC Annual Gross Revenue
Rs. Cr. +22% 2567 2787
2181
1739
1149 1407
FY13 FY14 FY15 FY16 FY17 FY18
MHC Annual EBITDA
Rs. Cr. +42% 281
221 222
173
113
70
FY13 FY14 FY15 FY16 FY17 FY18
6.2 8.3 10.2 10.5 11.4 8.5
xx EBITDA Margin FY16 excludes Rs. 6 Cr. of one time expenses towards the Pushpanjali and
21
Saket City acquisitions; FY15 excludes Rs 3 Cr of one off expensesFY18 has been a year of reset caused by various regulatory interventions and
other headwinds (3/3)
Phase 1 Phase 2 Phase 3
Rapid organic expansion and profitability through Large inorganic acceleration, Recalibration driven by
operating leverage but with some margin dilution regulatory interventions
MHC Annual Gross Revenues by Saket Complex East delhi complex
hospital complexes
+18% 1800
1626
Rs. Cr. 1339
902 1047 954 1067
827 779
568 593 666
560 672 733
260 309 381
FY13 FY14 FY15 FY16 FY17 FY18
MHC Annual EBITDA hospital complexes
+15%
Rs. Cr. 190 212 197
155
121 126 121
114 122
82 102
81
53 76 90 75
40 44
FY13 FY14 FY15 FY16 FY17 FY18
14.7 14.3 15.6 15.1 13.3 12.2
16.1 15.1 14.7 14.4 14.3 11.2
Note: Saket Complex includes Saket West Block, Saket East Block (unit of Devki Devi Foundation) and Max
Smart (unit of Smart Hospital & Research Centre) hospital; East Delhi Complex includes Max Patparganj (unit xx EBITDA Margin
22
of Balaji Medical and Diagnostic Research Centre) and Max Vaishali hospitalStrong momentum across all volume and value levers in last 5 years
Maintained healthy occupancy levels despite strong bed
Steady growth in Revenue per occupied bed
addition momentum
Avg. unoccupied Avg. occupied Occupancy (%) Figures in Rs. Thousands Per OBD
beds beds
69.7 74.3 73.5 71.1 72.1 73.1 +6%
44
39 41
+13% 37
2,330 2,377 33 34
2,049
1,472 1,680 651 640
1,302 592
378 445
394 1,679 1,737
1,094 1,235 1,457
908
FY13 FY14 FY15 FY16 FY17 FY18 FY13 FY14 FY15 FY16 FY17 FY18
Consistent improvement in Average Length of Patient
Consistent focus on key tertiary tower specialities
Stay
Figures in Number of days
MAMBS Renal Ortho Neuro Onco Cardiac LBS
-2.0% 56% 55% 54%
3.5 51% 53%
3% 2% 2%
52%
3.5 3% 3% 6% 7% 7%
2%
3.4 4%
5% 6%
7% 8% 10% 10% 10% 8%
3.3 3.2 10% 10% 10% 10% 9%
10%
3.1
11% 12% 13% 13% 12% 14%
15% 14% 14% 13% 12% 0% 11%
2%
FY13 FY14 FY15 FY16 FY17 FY18 FY13 FY14 FY15 FY16 FY17 FY18
NOTE: FY16 and FY17 including Vaishali and Saket City Hospital;
Cardiac revenue impacted by stent price capping in FY17 and FY18; 23
Ortho revenue impacted by implant price capping in FY18Four dimensions to value creation for MHC
• Improve specialty mix
• Improve channel mix – upcountry /
international direct models / PSU closures
• Bring back operational leverage through
Existing scale / occupancy growth
network • Sustained cost rationalisation initiatives in
optimizat personnel, material and clinician cost
ion
• Differentiated
positioning
• Service experience Hospital • Brownfield expansion
• Patient safety
Key to 5000+ beds
network
• People enablers • Onco daycare
growth • DiabetEase
• Compliance
• Immigration Center
• Max Lab Alternate
• Max@Home models
• Tele Radiology
• Physiotherapy BU
24A Drive increase in share of preferred specialties to improve profitability
Reduction due to acquisitions with weak
starting positions and value erosion in cardiac Action plan in place to grow focused specialties
/ ortho specialties due to price controls
Healthcare revenue specialty share • Build distinguished leadership
Percent in all DMGs
• Disproportionately grow the
ONCOLOGY
standalone centre model
1,720 Cr. 2,717 Cr. • Personalized medicine
100%
• Provide end to end service offering
• Launch specialized clinics
14 NEURO
Preferred 56% 52% SCIENCES • Invest in high end Neuro equipment
• Build comprehensive transplant
center in Saket complex
TRANS-
PLANT
• Establish KTP and BMT programs in
selected locations
48% 20
Others 44%
• Focus on high-end procedures
CARDIO • Partnerships with renowned global
SCIENCES institutions – people & best practices
FY15 FY18
Our aspiration is to have a preferred mix of 54.0 – 55.0% in FY22
xx CAGR (%) 25A Drive increase in share of preferred channels to improve profitability
Reduction in preferred channels due to Action plan in place to increase the share of
acquisitions with weak starting positions preferred channels
• Establish direct presence and digital
footprint in select markets
Healthcare revenue channel share Inter- • Expand in attractive new markets
Percent 100.0% 100.0% national • Pilot and scale alternate business
International 9.7% 10.3% models such as surgeries abroad / O&Ms
• Sustained brand effort / experience
delivery on new positioning
Walk-In 40.3% 36.0% Walk-in • ATL/BTL campaigns for key specialties
through digital platforms
• Strengthen ER capabilities
• Seek new engagement models in the
prevention/ wellness space
TPA 17.9%
18.4% TPA • Assess co-development of product
targeted at new customer segments
13.2% • Revamp channel sales through an direct
MECP 14.0%
MECP field force; strong focus on salesforce
Institutional/ effectiveness
18.2% 22.0%
PSU • Deprioritize; profitability improvement
Institutional through focus on collections, material
cost, and ALOS
FY15 FY18
Our aspiration is to have a preferred mix of 72.5 – 73.0% in FY22
Preferred Non-preferred
Channels Channels 26A
Rs. 170 Cr. of cost savings achieved in FY16, FY17 and FY18 through
structured cost initiatives; Rs. 64 Cr. targeted in FY19
73
Procurement efficiency
Formulary driven substitutions
18
58 Increase in consumables reusability
12 ALOS and cost/OBD reduction esp. in PSU patients
39
35 Organization restructuring at units
12 25
Manpower contract rate negotiations
Physician compensation re-modelling
19
21 Materials procurement efficiency
20
Power saving through cheaper procurement, equipment
8
efficiency improvement and demand management
FY16 FY17 FY18 Collections and deductions management
Material Costs Other Indirect Costs
Personnel Costs (Incl. Clinicians)
Rs. 100 – 150 Cr. cost to be taken out in the next 2-3 years
27B
MHC expansion prioritised in hospitals with demonstrated track record of
superior profitability
Saket complex: 1350*
Saket East Delhi complex: 200
East Delhi Mohali: 85 complex: 315 Saket Mullanpur: 400
Complex: 106 S.Bagh: 104 complex: 300 Gr. Noida: 380
5,810
2,330
300
106 419
2,570 85
FY18 FY19 FY20 FY21 FY22 FY23 & Beyond Total
Expansion prioritized in facilities that have a proven track record of
delivering 15-16% EBITDA margin in the past
* Includes 200 beds of Saket FAR
Bed Capacity as at April, 2018 28B
Onco Day Care Center: Operationalized in July’16, EBITDAR break even on
the 3rd month
Figures in Rs. Lacs
439.2
• Standalone specialized facility away from 7th July: Saket doctors 389.6
421.4
the hospital to ensure comfort and care X-ray OPD started
started 1st Sept:
for our patients during chemotherapy
Ultra-sound 275.3
sessions started
21st
June’16 216.4 218.5
Chemo
• Helps patients with their treatment and started FY’18 EBITDAR margin of
disease by providing a non-hospital 36.0 51.8 18.7% and EBITDA
61.8 margin of 9.9%
9.2
environment and a highly efficient and
expert experience 14th July'16 Aug'16 Sep'16 Q3'17 Q4'17 Q1'18 Q2'18 Q3'18 Q4'18
June'16
Rev - Actual
• Key Differentiators: Daycare Chair turnover Channel Mix
IMRB Scores
(FY’18)
o Strong clinical protocols H2'18 0.9 Pan MAX 76% Cash 44%
o Staff specially trained in soft/service H1'18 0.8
Oncology 79%
skills H2'17 0.6
TPA 20%
o Personalized treatment Q2'17 0.4 Onco DayCare 91% Others 36%
June'16 0.1
Success of this centre has paved the way for opening more such centres; Work on for the 2nd
one in Gurgaon. Noida facility being also transformed to set-up Once DayCare
29B Immigration Center: Revenue growth at 53% vs. LY
New Center
Revenue (Rs. Cr.)
opened
17.0
11.1
7.0
FY’16 FY’17 FY’18
Volume (‘000) 122.3
77.6
62.0
FY’16 FY’17 FY’18
Success of this centre has paved the way for opening more such centres; Work on for the 2nd one in Mohali
Figures in Rs. Cr. 30C
Max Lab: MHC has shown consistent growth in the non-captive business
over the last one and half years by leveraging its assets
Building blocks in place to achieve the growth Revenue (Rs. Cr.)
aspiration
Network Expansion +241%
• Network of 580+ partners 7.7
• Over 250 active partners in March
• Started operations in NCR, Punjab, Faridabad, and 5.4
Uttarakhand
• Added 2 HLMs, over 450+ beds 2.9
2.2
Technology
• CRM platform for Sales Team for Team monitoring, Lead
H1’17 H2’17 H1’18 H2’18
creation, Partner management
• Upgrading LIMS for enhanced service delivery – project
implementation underway Samples* (‘000)
• Max Lab website under development +901%
102.9
Operations
• Sales team expanded to 21 from 8 (Mar)
• Successful launch of Matrika, Monga HLM 55.1
• Serviced over 100,000 orders in 9 months
21.5
Organization 10.3
• Team size grew to 175 (35 in Mar17)
• Extensive Training sessions for staff / franchisee staff H1’17 A H2’17 A H1’18 A H2’18 A
* Pathology samples from Max@Home are also included
31C
Max@Home: With Rs. 1.5 – 2 Cr. of investment till date, business stands at
~Rs. 28 Cr. revenue in FY18
Revenue (Rs. Cr.)
Home Sample Collection +165%
• 24*7 coverage
27.6
• 16% revenue contribution through out-of-hospital channels in
Q4
• 19% repeat business in Q4 10.4 9.6
Medicine home delivery
• 20% increase in volumes from 5636 (Q3) to 6762 (Q4) FY 16 FY 17 FY 18
• Increased repeat business from 12% (Q3) to 16% (Q4)
New services 0.26 6% 2.74 50% 20.41 74%
Critical care nursing
• Critical care nursing service launched; Over 14 patients served Existing services 3.88 94% 2.75 50% 7.14 26%
in Q4
Volumes (‘000)
New territory- Mohali
+218%
• Nursing and GDA launched in addition to sample collection
and pharmacy delivery 38.5 41.9
31.3
Max@home B2C platform 19.6
13.2
• ~450 tech features ; ~30 processes; 5 service line journeys
• Wireframes for ~20 roles across portal, mobile app & tablet
Q4’17 A Q1’18 A Q2’18 A Q3’18 A Q4’18 A
Steady state EBITDA margin ~25%
32C
Teleradiology and Physiotherapy BU: Launching 2 new businesses in FY19
with high market potential
Tele Radiology Physiotherapy BU
• International (US & western Europe): Rapidly
• Indian Rehab market is projected to grow at a CAGR
growing market at ~18-20% CAGR (FY11-16)
of 15% from FY15-FY20 to reach a market size of USD
driven by digitally enhanced healthcare
~1.0 bn in FY20
infrastructure and integration of
teleradiology; market size of USD ~1.2 bn in • Growth factors include rising elderly population
FY18 (estimated to reach 323 mn by 2050), chronic
Market • International (developing – Africa): Lack of
illnesses & increase in awareness
potential radiologists; project growth in FY18-22 at 15- • 70% of market is currently out-of-hospital (which
20% includes services @home and clinics), while
hospitals focus primarily on their in-patients
• Domestic: Market growing at ~10-12% CAGR
(FY11-16) driven by widening network of
high-speed broadband services, shortage of
radiologists in tier-2 cities , etc.
• Create a Physiotherapy BU platform in FY19:
• Pilots underway in both domestic and
international markets o In house and integrate to ensure best practices
and standardization of service delivery
MHC’s • 5 clients – 4 domestic, 1 international –
signed within 6 months of operations o Create well defined care plan owned by
plan physiotherapist that is additionally signed off by
the treating clinician
o Offer niche services such as Speech Therapy,
Sports physiotherapy, Mental Health etc.
33MAX INDIA LIMITED
MAX BUPA HEALTH INSURANCE LIMITED
www.maxbupa.com www.maxindia.com
34A symbiotic partnership in health insurance
+ Helping people live longer,
healthier, happier lives
In the business of Life
What we do
Domestic Health Global Health Dental and Travel
Advice Primary Care
Insurance Insurance insurance Clinics
Dental clinics Aged Care
► Diversified group with interests in insurance, ► Leading international healthcare group present across 190+
healthcare, manufacturing, real estate, learning nations, provides personal and company health insurance,
and senior living runs care homes for the elderly and hospitals in addition to a
Highlights
range of health services
► Founded in 1985 with an entry in the bulk
pharma business, Max has evolved into one of ► Founded in 1947 in the UK, Bupa employs over 86,000
the leading health services organizations in people across UK, Australia, Spain, Hong Kong, Poland, New
India Zealand, Chile, Brazil, Thailand, Saudi Arabia, India and the
US
► Over INR 191 billion in revenues, serving over
10 million customer with 25,000 employees and ► Revenues of over £11 billion, over 70% coming from health
2900 doctors. insurance covering over 16.5 million customers
Max Bupa is a 51:49 joint venture between Max Group and Bupa
35Our Vision and Mission
Vision Mission
To be the most admired To help customers live
Health insurance company in healthier, more successful
India lives
Caring Respectful Ethical Accountable Trustworthy Enabling
36Health insurance retail landscape
The retail health insurance market is expected to reach INR 630 billion by 2025
growing at a CAGR of 22%
Retail Health Insurance – Market Size Factors driving growth
(GWP INR Billion)
16%+ affluent household by 2025, doubling
Rising affluence and current level of 8%
urbanization 48 cities expected to have >40% affluent
household vs. 0 cities currently
630
India expected to have over 350 M people > 50
years by 2030
Ageing population
Increasing demand expected by this segment
along with evolution of product suite
Rapidly growing incidence of cancer, cardio-
22% Rise in chronic disease vascular diseases (CV) and diabetes
incidence Cancer, CV and diabetes form ~28% of health
expenditure which is expected to grow further
Over 20% annual healthcare inflation coupled
Increasing medical cost &
with high out-of-pocket expenses (62%)
high OOP expected to drive demand further
158
650 M mobile internet users by FY20, ~1.7x from
Internet penetration and E- current ~390 M
commerce growth 400-450 M digitally influenced shoppers by 2025
expected to drive break-out digital channel growth
FY'18 FY'25
Source: KPMG
37Industry landscape
Industry growth during FY’18* SAHI growth during FY’18* MBHI growth
Segment-wise GWP (INR Cr) FY’18
23% 41%
37,200 7,814
9
3,000
30,363 1,564
B2G 2,637 5,532
18,388 B2G 14 27%
B2B 1,091
B2B 15,256
6,241 Overall sales growth
B2C 4,426
15,812
B2C 12,469
FY’17 FY’18 FY’17 FY’18
• Most of B2C growth in SAHI space is contributed by SAHIs which have invested over last 3 years and expanded their branch and
Banca network
• SAHI B2B growth at 43% vs overall 21% industry growth.
• SAHIs are growing @ 41% - Faster than the industry
* Numbers are excluding Overseas medical and personal accident
38Journey since inception
GWP, Rs cr 755
27%
594
xx% Y-o-y growth 25%
476
CAGR 28%
373 FY17-18
18% FY16-17
309
53% FY15-16
207 FY14-15
108%
99 FY13-14
296%
26 FY12-13
FY11-12
FY10-11
Segment
• B2C • Entered B2B • Entered B2G - First RSBY • Prioritized B2C
business scheme won
• Agency • First Banca partnership • Launched three more • Launched 4 partners • Launched Bank of • Industry first digitally
• Direct channels (Deutsche bank) banca partnerships enabled product
Channel
(Sarv UP, Muthoot, Baroda serving more
• TPD • Rationalized TPD2 Coverfox, Bank than 5,400 branches ‘GoActive’ launched
Bazaar) on 13th Feb’18
• Commenced
business with South
Indian bank
• In-house • Launched ‘Walk for Health’,• Reached ~3,100 network • 30-min claims • CRM launched • Standing Instructions • Launched India’s
Service model
claims annual brand property providers settlement (92% cases) for auto renewal first “Any time
• Walk for Health went health” machine
processing national touching 33 • First ‘embedded’
MM lives product launched at • Launched Point of
Federal bank care desks for
customer delight
39Healthy growth with consistent improvement in combined ratio
B2C B2B B2G
Gross written premium (Rs cr)
755
+30% 14
594 4
6 4 Max Bupa’s focus has been on
476
the B2C segment since
373 6 4
inception
309 18 1 736
207 56 8 466
584
While it is harder to build a
38 7 354
162 245 B2C book (linear customer
acquisition vs. lumpy demand
2012-13 2013-14 2014-15 2015-16 2016-17 2017-18 of B2B or B2G), Max Bupa has
grown at 27%, faster than
market (market growth ~23%
for FY’18)
Combined Ratio* (%)
151% 142% B2C focus driven operating
127% 118% model choices and some
116% 109% execution challenges have
resulted in higher upfront opex
spend
2012-13 2013-14 2014-15 2015-16 2016-17 2017-18
* Combined ratio = Claim ratio (Net claim incurred / Net Earned premium) + Opex ratio (Opex / GWP) +
Commission ratio (Net commissions / GWP)
Combined ratio for FY 17-18 basis IRDAI definition is 104% 40Max Bupa today
In a large, fast growing market Max Bupa delivers 2.8m customers, a vast
distribution network and leading brand
Focus on B2C segment from inception
Investments in direct channels to support the “pull” model; Premium
infrastructure (office locations and size) in line with overall positioning
Launched first to industry innovations - Highest Sum Insured options,
No age restriction for enrolment, No claim loading, Guaranteed
renewability, No 2 year waiting period
1st of its kind,
Digitally enabled
wellness product -
Max Bupa is the only insurance company with an annual GoActive
brand property - Walk for Health initiative
62mn* lives touched
Customer service is a key focus area – through Walk for 2.8m total
~78% of customers rate claims Health customers
experience with Max Bupa as very good (2017-2018)
or excellent
11,900 agents
4,064 providers in
network GWP Rs. 755 cr
(FY’18)
7 banca partners
with 8,800 branches
1,900 employees accessing 101mn
30 branches customers 98% B2C 27% Growth
business (FY’18)**
For the period ended Mar, 2018
*Duplicate reach across mediums
41
**Growth over same period last yearComprehensive product suite
Heartbeat Health Companion Health Assurance
An indemnity product with A fixed benefit product with
Our flagship indemnity
refill benefit, alternative unique 3-in-1 combination of
product with the most
treatments & Extended Family personal accident, critical
comprehensive coverage
First proposition illness & hospital cash
Key features include Key features include Accident Care:
hospitalization costs including: hospitalization costs including:
► Accidental death benefit
► State of art coverage - ► No limit on room rent and pre
► Accidental Permanent Total
Cashless international and post hospitalization
Disability
coverage (market first) expenses
► Accidental Permanent Partial
► Lowest (2 years) pre-existing ► Added protection with Unique
Disability benefit
disease waiting period Refill benefit
Critical Illness:
► Out Patient benefits ► All day care procedures
covered ► Covers 20 critical illnesses
► AYUSH benefits
► Unmatched renewal benefits ► 2 options: Lump sum & Lump
► Maternity & New Born benefits
− No Claim Bonus (No reduction sum + staggered pay-out for 5
► Coverage from Day 1 for in case of claims) years
accidents − Health check ups to help keep Hospital Cash:
► Waiver of 24 months waiting track of the health condition
► Daily cash benefit & double
period for specific conditions ► AYUSH in-patient treatment
cash benefit for ICU
below 45 yrs
► Super top up
► Loyalty benefit at renewal
42Comprehensive product suite
GoActive Group Platform
A digitally enabled, new age A group product with
customer centric product customized propositions by
offering that will serve the selecting from over 35
everyday health needs of the product features and
customer parameters
Key features includes: Group Health Insurance
includes:
► Lifetime discount of 10% of
premium if purchased at or ► Group cover for hospitalization
before 35 years age benefit
► Upto 10 OPD consultations Group Personal Accident:
included in the cover
► Accidental Death , Permanent
► Health coach option to enable Total & Partial Disability
customers remain fit and
Loan linked group critical
healthy
illness
► Second medical opinion
► Loan linked cover for 25 critical
► I-protect option to increase SI illnesses
by 10% every year
► Single pay up to 5 years
► Annual health check-
Group medical cover
up/diagnostics of customers
choice ► Customizable product for
employer employee groups –
B2B
43Distribution architecture
Largest distribution channel for the company
Spanning 29 branches across 19 cities
Agency Over 50% contribution in overall revenue
Frontline sales force of ~400 Agency Managers ~11,900 agents
One of the most productive agency force amongst SAHIs (Standalone Health Insurers)
7 Banca partnerships (2 foreign banks, 4 Indian banks and 1 rural bank), the highest
numbers amongst SAHIs
• Network of 8,800 bank branches across the country
Banca & • 616 FOS (included 7 of NBFC)
Alliances 3 NBFC tie-ups (Capital First, Muthoot, Bajaj Finserv)
Brokers (Bajaj Capital, NJ Brokers, Shriram)
Rural business (RSBY)
One of the largest captive tele-sales unit
Capacity of 108 out-bound tele-callers
Digital State-of-the-art technology infrastructure (Dialer / CRM) with secure environment
Online sales through MBHI website & web aggregators (6 partners, including Policy
Bazaar – a leading industry player)
Dedicated sales-force
Direct sales 55 full-time employees to address high-net worth individuals’ needs
Spread across top 4 metros
Distribution updated for Jan 2018
44Channel wise Performance (FY16 to FY18)
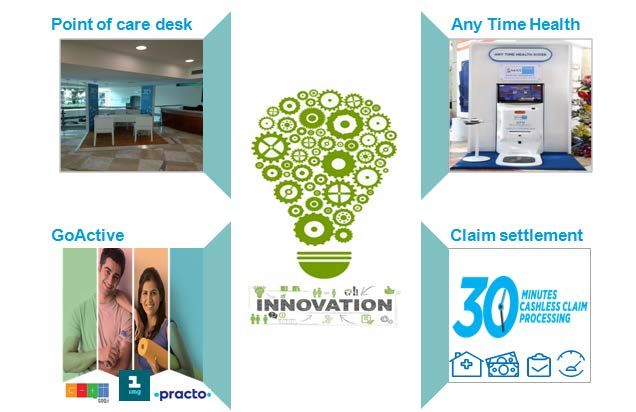
45Innovations at Max Bupa
46Strategic priorities – strengthening the foundation
A
Provider of choice in the
Affluent segment in urban
India
Remarkable
People customer
First 1 experience
2
Broad base the franchise
B with partnerships & alliances
Customer
Centric
5 Profitable 3
Build a Customer centric, Growth
Compliant & Cost conscious
C Culture
Build
4
Profitable
Digital Growth
Digitally enable end to end
D customer journey
Portfolio Management
- Renewals
47Key Initiatives for FY19
48External recognition
49Disclaimer
This presentation has been prepared by Max India Limited (the “Company”). No representation or warranty, express or implied, is made and
no reliance should be placed on the accuracy, fairness or completeness of the information presented or contained in the presentation. The
past performance is not indicative of future results. Neither the Company nor any of its affiliates, advisers or representatives accepts liability
whatsoever for any loss howsoever arising from any information presented or contained in the presentation. The information presented or
contained in these materials is subject to change without notice and its accuracy is not guaranteed.
The presentation may also contain statements that are forward looking. These statements are based on current expectations and
assumptions that are subject to risks and uncertainties. Actual results could differ materially from our expectations and assumptions. We do
not undertake any responsibility to update any forward looking statements nor should this be constituted as a guidance of future
performance.
This presentation does not constitute a prospectus or offering memorandum or an offer to acquire any securities and is not intended to
provide the basis for evaluation of the securities. Neither this presentation nor any other documentation or information (or any part thereof)
delivered or supplied under or in relation to the securities shall be deemed to constitute an offer of or an invitation.
No person is authorised to give any information or to make any representation not contained in and not consistent with this presentation
and, if given or made, such information or representation must not be relied upon as having been authorised by or on behalf of the Company
any of its affiliates, advisers or representatives.
The Company’s Securities have not been and are not intended to be registered under the United States Securities Act of 1993, as amended
(the “Securities Act”), or any State Securities Law and unless so registered may not be offered or sold within the United States or to, or for
the benefit of, U.S. Persons (as defined in Regulations S under the Securities Act) except pursuant to an exemption from, or in a transaction
not subject to, the registration requirements of the Securities Act and the applicable State Securities Laws.
This presentation is highly confidential, and is solely for your information and may not be copied, reproduced or distributed to any other
person in any manner. Unauthorized copying, reproduction, or distribution of any of the presentation into the U.S. or to any “U.S. persons”
(as defined in Regulation S under the Securities Act) or other third parties ( including journalists) could prejudice, any potential future
offering of shares by the Company. You agree to keep the contents of this presentation and these materials confidential.
50ANNEXURES
51MHC - Board of Directors
Ms. Roshini Bakshi
Mr. Rahul Khosla (Chairman)
Managing Director, Everstone Capital Asia (Singapore)
President – Max Group
Extensive global management experience; Bachelors
Seasoned business leader with over 30 years of deep
in Economics from St Stephen’s College, Delhi and
global experience in Banking and Financial markets.
MBA from IIM Ahmedabad.
Dr. Omkar Goswami
Mr. Mohit Talwar
Economist and Leading Academic
Managing Director at Max India Ltd. & Max Financial
Serves on Board of many Indian MNCs including Dr
Services Ltd., Over 30 years of experience in Corporate
Reddy’s, Infosys, IDFC, Crompton Greaves, Cairn
Finance and Investment Banking.
India Ltd. etc
Mr. Rajit Mehta
Mr. Kummamuri Murthy Narasimha
Managing Director & CEO- Max Healthcare
Independent Director; Leading Finance professional
Over 20 years of experience in financial services.
associated with the development of Cost &
Previously Chief Operating Officer at Max Life
Management Information Systems for over 150 firms
Insurance.
Dr. Ajit Singh Mr. Adam Pyle
Partner at Artiman Ventures, focusing on early- Non Executive Director and Group Executive, Strategy
stage technology & life science investments and Investor relations, Life Healthcare Group.
PhD in Computer Science from Columbia University Commerce and Law graduate and currently
responsible at LHC for driving the international strategy.
Dr. Pradeep Kumar Chowbey, Padmashri .Mr. Pieter Van Der Westhuizen
Director of Max Institute of Minimal Access, Non Executive Director and Chief Financial Officer, Life
Metabolic and Bariatric Surgery. More than 35 yrs Healthcare. Part of the LHC group for last 17 years and
of experience in Lap Surgery has fulfilled various financial roles
Ms. Tara Singh Vachani Dr. Shrey Balaguru Viranna
Chief Executive Officer and Managing Director of Non Executive Director and Group CEO at Life
Antara Senior Living Healthcare Group. Dr. Shrey is a medical doctor by
A natural leader, she represents the dynamic new training and has extensive experience in the heathcare
cadre of young women entrepreneurs in India industry
52MHC – Management Team
Mr. Rajit Mehta Mr. Yogesh Sareen
Managing Director & CEO- Max Healthcare Senior Director & Chief Financial Officer
Over 20 years of experience in financial services. Over 20 years of experience in across all facets of
Previously Chief Operating Officer at Max Life finance; previously CFO of Fortis Healthcare.
Insurance.
Mrs. Swati Rustagi
Mr. Rohit Kapoor Senior Vice President & Chief People Officer
Senior Director & Chief Growth Officer Over 17 years of experience in HR across FMCG,
18 years of diverse experience across industry and Financial Services and Health Care sectors. Previously
management consulting with McKinsey & Company global head of HR at Glenmark Pharmaceuticals
Mr. Anil Vinayak Mr. Anas Wajid
Director & Zonal Head – NCR 1 Director - Sales & Marketing
Over 23 years of experience in Business Management More than 17 years of experience in diverse fields such
and Sales & Marketing; previously with Amex as advertising, retail , healthcare and media. Previously
Head, Sales and Marketing at Fortis Healthcare
Dr. Sandeep Buddhiraja Mr. Sumit Puri
Director - Clinical Directorate & Institute of Internal Med. Director- IT & Chief Information Officer
Over 23 years of experience in the field of Internal Over 21 years of experience in varied industries
Medicine such as Health/ Life Insurance, IT/ITES, and
Consulting; previously CIO of Prudential Life
Assurance
Mrs. Vinita Bhasin
Director - Service Excellence & Customer Operations
More than 19 years of in-depth experience across the
Financial Services sector; previously with Max Life
Insurance
53Key Physicians
Dr. Pradeep Kumar Chowbey, Padmashri Dr. K. K. Talwar
Director of Max Institute of Minimal Access, Metabolic Chairman - Cardiology, Max Healthcare
and Bariatric Surgery. Clinical experience of more than 39 years
More than 35 yrs of experience in Lap Surgery, Former Head, Department of Cardiology, AIIMS
completed 70K+ major Lap procedures
Dr. Anant Kumar
Dr. Sandeep Buddhiraja Chairman – Urology,Renal Transplant, Robotics(Max
Director - Clinical Directorate & Institute of Internal Med. Saket Complex) and Uro-Oncology Max Saket
Over 23 years of experience in the field of Internal 2200 Kidney Transplantations in the last 25 years
Medicine and over 1500 lap donors nephrectomy
Dr. Subhash Gupta
Dr. Harit Chaturvedi Chairman - Liver Transplant & Biliary Sciences
Chairman – Cancer Care, Director & Chief Consultant - 2,200+ liver transplant surgeries & over 30 year
Surgical Oncology experience in Liver Transplants
Over 25 years of experience in Surgical Oncology. Recipient of the BC Roy award
Strong consultant bench strength of 350+ across
Dr. A.K. Singh specialities :
Director – Max Institute of Neurosciences, Dehradun
Renowned Neurosurgeon having 40 years experience Cardiac – 100+
Recipient of the BC Roy award
Oncology – 50+
Dr. Anurag Krishna Orthopaedics – 50+
Director- Paediatrics & Paediatrics Surgery
Over 20 years of experience in Paediatric surgery - Neurosciences – 50+
complex congenital malformations
Renal – 50+
MAMBS – 25+
54MHC Network* – Performance Dashboard (Q4 & FY18)
Quarter Ended Y-o-Y Year Ended Y-o-Y
Key Business Drivers
Mar-18 Mar-17 Growth Mar-18 Mar-17 Growth
a) Financial Performance
Revenue (Gross) 670 628 7% 2,787 2,567 9%
Revenue (Net) 621 604 3% 2,619 2,454 7%
Direct Costs
Material Cost 160 148 8% 657 614 7%
Clincian Payout 108 102 6% 458 416 10%
Contribution 353 354 0% 1,504 1,424 6%
Contribution Margin^ 56.8% 58.5% (170) bps 57.4% 58.0% (61) bps
Indirect Costs
Personnel Cost 177 143 24% 688 589 17%
Other Indirect overheads 106 101 5% 458 430 6%
HO Costs 37 32 17% 136 123 10%
EBITDA 32 78 -58% 222 281 -21%
EBITDA Margin^ 5.2% 12.8% (763) bps 8.5% 11.4% (298) bps
Finance Cost 30 30 1% 129 133 -3%
Cash Profit 2 48 -95% 92 148 -38%
Depreciation 36 33 11% 138 124 11%
Profit /(loss) before tax (34) 15 -326% (46) 24 -291%
Tax 1 0 0% 4 - -
Profit /(loss) after tax (35) 15 -332% (50) 24 -308%
b) Financial Position
Net Worth 1,071 1,121 -4%
Net Debt 1,227 1,093 12%
Fixed Assets - Gross Block** 2,131 2,035 5%
*The above results are for MHC Network of hospitals and includes results for Max Super Specialty Hospital, Saket, unit of Devki Devi Foundation, Max
Super Speciality Hospital, Patparganj, unit of Balaji Medical and Diagnostic Research Centre & Saket City Hospital unit of
Gujarmal Modi Hospital & Research Centre; ^ on the basis of net revenue; ** Excludes Goodwill on Acquisition 55MHC Network* – Performance Dashboard (Q4 & FY18)
Quarter Ended Y-o-Y Year Ended Y-o-Y
Key Business Drivers
Mar-18 Mar-17 Growth Mar-18 Mar-17 Growth
a) Patient Transactions (Nos. in lacs)
Inpatient Procedures 0.44 0.44 0% 2.02 1.89 7%
Day care Procedures 0.10 0.13 -19% 0.48 0.49 -2%
Outpatient Registrations 16.47 15.84 4% 67.93 64.41 5%
Total 17.02 16.41 4% 70.44 66.79 5%
b) Average Inpatient Operational Beds 2,372 2,291 4% 2,378 2,330 2%
c) Average Inpatient Occupancy 71.7% 70.0% 162 bps 73.1% 72.1% 101 bps
d) Average Length of Stay (days) 3.45 3.25 -6% 3.14 3.25 3%
e) Average Revenue/Occupied Bed Day (Rs) 43,810 42,477 3% 43,946 41,187 7%
f) Other Operational Data
Physicians 2,882 2,692 7%
Employees 9,605 8,711 10%
Customer Base (in lacs) 42.3 35.7 18%
*The above results are for MHC Network of hospitals and includes results for Max Super Specialty Hospital, Saket, unit of Devki Devi Foundation, Max
Super Speciality Hospital, Patparganj, unit of Balaji Medical and Diagnostic Research Centre & Saket City Hospital unit of
Gujarmal Modi Hospital & Research Centre; ^ on the basis of net revenue 56MHC Network Hospitals (Saket* & East Delhi^ Complex)
– Performance Dashboard (Q4 & FY18)
Unit Quarter Ended Y-o-Y Year Ended Y-o-Y
Key Business Drivers
Mar-18 Mar-17 Growth Mar-18 Mar-17 Growth
Saket Complex
a) Financial Performance
Revenue(Net) Rs. Cr 245 233 5% 1,004 914 10%
EBITDA Rs. Cr 31 38 -18% 122 121 1%
EBITDA Margin % 12.8% 16.4% (361) bps 12.2% 13.3% (111) bps
b) Average Inpatient Operational Beds No. 763 743 3% 744 748 -1%
c) Average Inpatient Occupancy % 76.9% 71.6% 536 bps 76.5% 71.1% 539 bps
d) Average Revenue/Occupied Bed Day Rs. 49,800 49,982 0% 51,338 49,091 5%
e) Average Length of Stay (days) 3.87 3.30 -17% 3.41 3.23 -6%
East Delhi Complex
a) Financial Performance
Revenue(Net) 161 157 3% 671 632 6%
EBITDA Rs. Cr 11 23 -54% 75 90 -17%
EBITDA Margin % 6.6% 14.8% (820) bps 11.2% 14.3% (312) bps
b) Average Inpatient Operational Beds No. 695 711 -2% 695 659 5%
c) Average Inpatient Occupancy % 76.2% 73.7% 253 bps 77.8% 76.8% 96 bps
d) Avg. Revenue/Occupied Bed Day Rs. 37,502 35,212 7% 37,115 36,355 2%
e) Average Length of Stay (days) 3.49 3.80 8% 3.16 3.74 16%
*Saket Complex includes Saket West Block, Saket East Block (unit of Devki Devi Foundation) & Max Smart (unit of Smart Hospital & Research Centre) hospital
^East Delhi Complex includes Max Patparganj (unit of Balaji Medical and Diagnostic Research Centre) & Max Vaishali hospital
57MBHI - Board of Directors
Mr. Murthy entered the Profession of
Rajesh Sud Rajesh Sud is the CEO and Managing K Narasimha Cost & Management Accountancy in
Director of Max Life Insurance, one of
Chairman & the first three private life insurers to
Murthy 1983. He is associated with the
Director Director development of Cost & MIS for more
start operations in 2001
than 150 companies
Rahul Khosla is the President of Max John joined Bupa's Board as a Non-
Rahul Khosla Executive Director in July 2011. He is
Group and Executive President, Max John Howard
Co-Vice Chairman of Bupa’s Audit Committee
Financial Services. He is a seasoned Lorimer
Chairman & business leader with 30 years of and a member of Bupa's Risk
Director Committee and UK Regulated Entities
Director experience in India & globally
Board
David Fletcher David commenced in the new role of Ms. Theron is a Principal of Erlen
Chief Risk Officer in January 2017. He Street Corporation, Switzerland, a
Co-Vice Marielle Theron
has been with Bupa since 2014 in company that specialises in strategic
Chairman & senior roles including Chief Internal Director investment and management
Director Auditor and MD of IDM. consulting solutions
Joy is the CFO of Bupa Plc. She has
Joy Linton Pradeep is a highly experienced senior
over 25 years’ experience in financial Pradeep Pant
business leader, now involved in
Director and strategic roles in Australia and the Director business consulting and education
UK.
Ashish has over two decades of
Mohit is the Managing Director of Max
Ashish extensive banking experience. In his last
Financial Services and Max India. He
Mohit Talwar role as MD and Head for Retail division
has an experience of over 30 years in Mehrotra of Citibank in India, he was pivotal in
Director Corporate Finance and Investment MD & CEO enabling bank gain a leadership position
Banking.
in the wealth management business
Mr. D. K. Mittal is a former Indian
Dr. Burjor Banaji is an ophthalmic
D.K. Mittal Administrative Service (IAS) officer of
Dr. Burjor Banaji Independent 1977 batch (UP cadre) and has served
surgeon who introduced several firsts
Director in the field of ophthalmology to India Director the government of India in various
capacities.
58MBHI – Management Team
Ashish has over two decades of
With over 18 years of experience,
extensive banking experience. In his last
Ashish Vikas Gujral Vikas joins us from Max Life
role as MD and Head for Retail division
Mehrotra Chief Operating Insurance. Prior to Max Life, he has
of Citibank in India, he was pivotal in
MD & CEO Officer worked with Bharti Airtel and GE
enabling bank gain a leadership position
Capital.
in the wealth management business
Rahul has wide domain expertise built
Rahul Ahuja over 19 years mainly in corporate
Chief Financial banking, financial services and Anurag joins Max Bupa from Max Life,
Officer telecom. Anurag Gupta where he has held a number of senior
Head – Agency roles across distribution and product
management over a decade.
Aseem has nearly two decades of
Aseem Gupta experience in sales and distribution
Head – Portfolio and has worked across channels -
Management & Affinity Agency, Banca, Special markets &
Channels Tarun has joined us from for Sistema
Direct Sales. Tarun Katyal Shyam Teleservices. He has over 25
Chief Human years of experience across retail &
Resources Officer manufacturing industries, including
Priya is an adept healthcare multi-national and Indian corporates
Priya Gilbile professional with more than 16 years
Head – Health Risk of experience in healthcare & health
Management insurance industry.
Atul has 15 years of experience in
Atul Bhandari product/process management &
Partha brings along 20 years of Head – Banca sales/distribution, he joined us from
Partha Banerjee diverse experience in Corporate, and Alliances CITIBANK NA, prior to which he
Head – Legal & Commercial, Taxation, IPR, Exchange worked in Standard Charted bank.
Compliance Control, M&A, Labour Laws and other
substantive and procedural laws.
Raman has joined us from Anika heads the Marketing & E-
Cholamandalam MS General Insurance commerce verticals at Max Bupa and
Anika Agarwal is responsible for brand planning,
Ramanan A V where he was heading the Actuarial Head – Marketing
department, he started his carrer as a digital media, communications,
Actuarial head & Direct Sales
lecturer and has also worked with Tamil consumer insights, direct sales and E-
Nadu Electricity Board for 20 years commerce.
59Max Bupa – Performance Dashboard (Q4 & FY18)
Quarter Ended Y-o-Y Year Ended Y-o-Y
Key Business Drivers
Mar-18 Mar-17 Growth Mar-18 Mar-17 Growth
a) Gross written premium income
First year premium 89 67 32% 257 209 23%
Renewal premium 161 126 27% 497 385 29%
Total 249 193 29% 755 594 27%
b) Net Earned Premium* 209 163 28% 638 544 17%
c) Cash Profit /(Loss) 37 (9) 519% 39 8 386%
d) Pre tax Profit /(Loss) 33 (12) 371% 23 (4) 736%
e) Claim Ratio (B2C Segment, normalized) 53% 53% 30 bps 55% 57% 180 bps
f) Avg. premium realization per life (B2C) 8,176 7,242 13% 8,063 7,063 14%
g) Conservation ratio (B2C Segment) 81% 80% 97 bps 82% 83% (160) bps
h) Lives In force in millions (including RSBY) 2.8 2.4 17%
i) Number of agents 15,067 17,011 -11%
j) Paid up Capital 926 926 -
* Earned Premium higher by Rs 45 Cr (PY Rs 35 Cr) in Q4FY18 & Rs 23 Cr (PY Rs 53 Cr) in FY18 due to change in Unearned premium
accounting from 1/365 method to 50% of net written premium, excludes the impact of reinsurance ceded
60MAX INDIA LTD.
Max House, Okhla, New Delhi – 110 020
Phone: +91 11 26933601-10 Fax: +91 11 26933619
Website: www.maxindia.com
61You can also read