SPONSORED BY: State of Aadhaar
←
→
Page content transcription
If your browser does not render page correctly, please read the page content below
State of Aadhaar Report 2017-18

                                                  1
      MAY 2018                    SPONSORED BY:
STATE OF AADHAAR
REPORT 2017-18
MAY 2018

Ronald Abraham
Elizabeth S. Bennett
Rajesh Bhusal
Shreya Dubey
Qian (Sindy) Li
Akash Pattanayak
Neil Buddy Shah

Sponsored by
About IDinsight

IDinsight's mission is to help policymakers and practitioners use rigorous data and evidence to make more
socially impactful decisions. We carefully tailor a wide range of quantitative tools to help our clients design
better public policies, rigorously test those ideas, and take informed action to improve lives at scale.

IDinsight leads learning partnerships across Asia and Africa, working with governments, multilaterals,
foundations, social businesses, and innovative NGOs. We have worked with more than 70 clients across
17 states in India and more than a dozen countries. We work across a range of sectors, including digital ID,
education, financial access, governance, health, and sanitation.

We have offices in Dakar, Johannesburg, Lusaka, Manila, Nairobi, New Delhi, San Francisco, and Washington,
D.C. To learn more, visit www.IDinsight.org, and follow on Twitter @IDinsight.

About Omidyar Network

Omidyar Network is a philanthropic investment firm. We create opportunity for people to improve their lives
by investing in market-based efforts that catalyse economic and social change. In India, we focus our efforts
on helping the hundreds of millions of lower-income Indians, from the poorest among us to the existing
middle class.

Omidyar Network has committed more than $1 billion to for-profit companies and nonprofit organisations
that foster economic advancement and encourage individual participation across multiple areas, including
Digital Identity, Education, Emerging Tech, Financial Inclusion, Governance & Citizen Engagement, and
Property Rights.

To learn more, visit www.omidyar.com, and follow on Twitter @omidyarnetwork #PositiveReturns.

Suggested citation

Abraham, Ronald, Elizabeth S. Bennett, Rajesh Bhusal, Shreya Dubey, Qian (Sindy) Li, Akash Pattanayak,
and Neil Buddy Shah. State of Aadhaar Report 2017-18. Report. IDinsight, 2018.

Comments or questions

We welcome your feedback on this report. Please write to us with your comments or questions
to StateofAadhaar@IDinsight.org.

Disclaimer

The information contained in this report is prepared by IDinsight and commissioned by Omidyar Network.
It is furnished to the recipient(s) for free distribution and use. The authors have made their best efforts to
ensure the accuracy and completeness of the information in this report but make no representations or
warranties therein and expressly disclaim any liabilities based on such information or on omissions. Each
recipient should therefore conduct her or his own analysis of any information contained in this report.

While Omidyar Network is pleased to sponsor this report, the conclusions, opinions, or points of view
expressed in the report do not necessarily represent the views of Omidyar Network.
PREFACE

In last year’s State of Aadhaar Report, we drafted a comprehensive, empirical, and structured review
of the Aadhaar landscape. This foundational assessment aimed to promote a more fact-based understanding
of the ecosystem at-large. And more critically, we used this analysis to identify areas where more research
was needed to understand whether and how Aadhaar can advance the welfare of India’s residents.

For this year’s report, we aimed to dive deeper into key issues in order to contribute primary research
on critical topics highlighted in last year’s report. After a series of consultations, we decided to conduct
state-representative large-scale surveys to understand how individuals interact with and perceive Aadhaar.
This allowed us to empirically explore important issues that to date were discussed without the support
of rigorous evidence.

The main results of that survey are contained within these pages, supplemented with other independent
research and additional data from the government.

During our initial phase of research design we received valuable inputs from a wide range of thought-leaders
and researchers, including: Alan Gelb, Anurodh Giri, Avani Kapur, Reetika Khera, Vijay Madan, Anit Mukherjee,
Ajay Bhushan Pandey, Vaishnavi Prathap, Malavika Raghavan, Emrys Schoemaker, Ajay Shah, and Janaki
Srinivasan. We are thankful for their time and efforts.

This report would not have been possible without our incredible team at IDinsight. We are grateful to Doug
Johnson for his thoughtful feedback as well as Ruchika Joshi for her contributions in our efforts to engage
in a data-driven discourse. We also appreciate technical input and reviews from Qayam Jetha, Akib Khan,
Jeff McManus, Marc Shotland, and Dan Stein – as well as feedback on our questionnaire from Heather
Lanthorn.

We are thankful to Adi Raval and Divya Sooryakumar for their contributions to our communications strategy.
We also benefited from the support and patience of the entire IDinsight Delhi office as they helped us
brainstorm and work through these important issues.

And we appreciate the efforts of Syed Maqbool, Vinod Sharma, and Lalit Nayak who helped to lead our field
teams in Andhra Pradesh, Rajasthan, and West Bengal, respectively.

Omidyar Network (ON) has continued to be a supportive thought-partner throughout this entire journey.
In particular, we would like to convey our sincere appreciation for the efforts of CV Madhukar, Subhashish
Bhadra, Roopa Kudva, Mike Kubzansky, and ON’s entire Digital ID team.

The report itself has greatly benefited from the expertise of our design firm, Studio Subu, as well as our
editor, Allan R. Gold.

Lastly, for their tireless efforts, we would like to thank our co-authors: Neil Buddy Shah, Qian (Sindy) Li,
Rajesh Bhusal, Shreya Dubey, and Akash Pattanayak.

As always, any shortcomings in the report are our own. We hope this report facilitates meaningful dialogue
on digital identity – both in India and abroad.

Ron and Elizabeth
State of Aadhaar Report 2017-18

8
State of Aadhaar Report 2017-18
EXECUTIVE SUMMARY
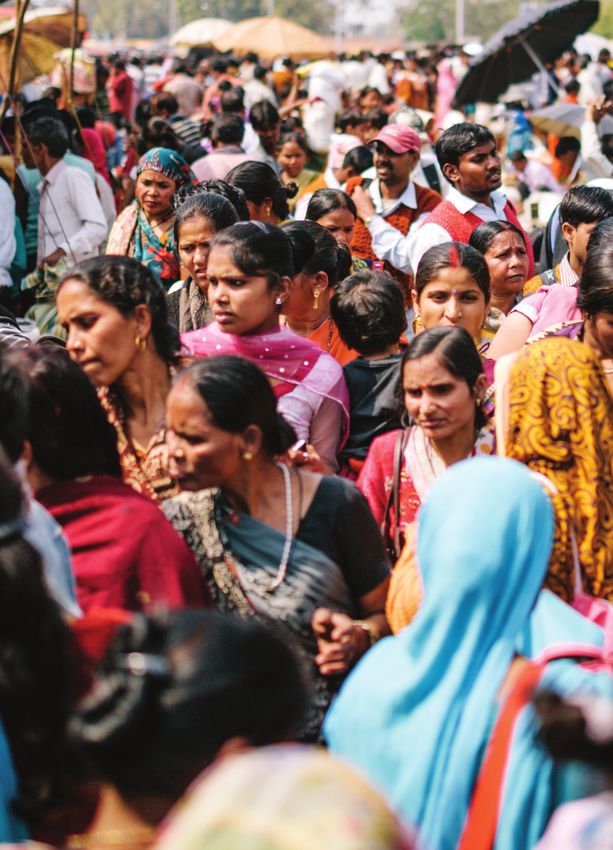
Aadhaar provides identification to more than 1.2 billion
Indian residents. Its scale, ability to uniquely identify STATE OF AADHAAR
individuals, and digital interface make it a compelling SURVEY 2017-18
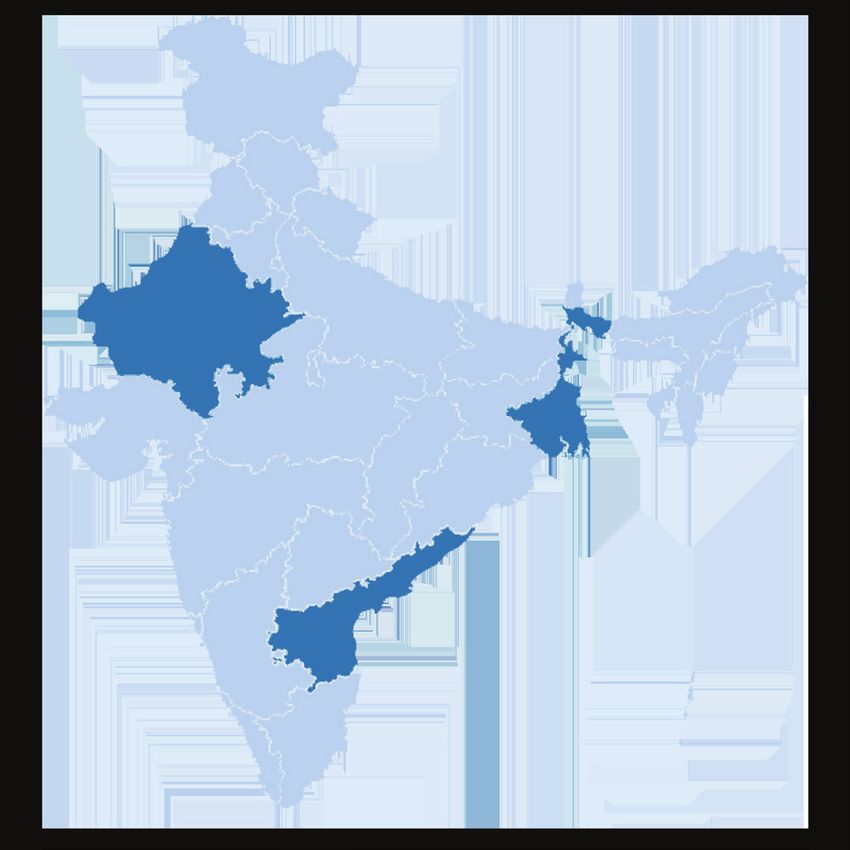
identification platform. These same features also raise RAJASTHAN
questions about privacy, data security, and exclusion. 965 HH
The current debate on Aadhaar is binary in nature: either
Aadhaar should be jettisoned or scaled aggressively.
However, the facts on the ground—as revealed by our
three-state survey on Aadhaar, the largest to date—
support a more nuanced approach. Our report’s key
WEST BENGAL
takeaways explain why. 840 HH
IDinsight’s State of Aadhaar initiative aims to catalyse
ANDHRA PRADESH
data-driven discourse and decision-making in the Aadhaar
1,142 HH
ecosystem. This report, the initiative’s flagship output,
aims to provide a holistic and empirically grounded Note: Numbers indicate randomly
assessment of the state of Aadhaar. sampled rural households in each state
KEY TAKEAWAYS
Aadhaar’s coverage is widespread,
but the quality of the data has room for
1.5X more self-reported errors in
Aadhaar compared to voter IDs
Demographic error-rate in Aadhaar is 8.8%
improvement. vs. 5.7% for voter ID
A majority of Indians value privacy,
but also approve of linking Aadhaar
87% rural residents approve
mandatory linking of Aadhaar
Approval for mandatory linking of Aadhaar to
to services. government services; for private services, corresponding
figure is 77%
Aadhaar's analog version (the letter) is
much more widely used to open bank
17% bank a/c holders used
Aadhaar e-KYC to open a/c
67% used Aadhaar letter; rest used other IDs; data for
accounts than its digital version (e-KYC). most recently opened bank account
Exclusion from food ration (PDS) due to
Aadhaar-related factors is significant, but
2.2% of food ration recipients in
Rajasthan excluded monthly
due to Aadhaar-related factors
lower than non-Aadhaar factors. This extrapolates to ~1.2 million people per month in
Rajasthan; non-Aadhaar factors account for 6.5%
(or ~ 3.7 million people) of food ration (PDS) recipients
excluded per month
Unless specified, all data cited in the executive
summary are from our survey and apply to rural areas
of Andhra Pradesh, Rajasthan, and West Bengal.AADHAAR PLATFORM
Aadhaar has rapidly become the foundational identity document of Indian residents. It has achieved
near-universality in its coverage and acceptance in India. We review key highlights of what has worked,
what has not, and recommended next steps.
1.2 BILLION 271 MILLION
residents currently enrolled on Aadhaar unique individuals used their Aadhaar to digitally
platform with over 90% adult saturation in authenticate themselves in Feb 2018 (UIDAI 2018).
most Indian states (UIDAI 2018) Even more use Aadhaar’s analog version (the letter)
1. WHAT HAS WORKED? 2. WHAT HAS NOT WORKED?
Most people have an Aadhaar number Aadhaar data has more self-reported
and most felt it was easy to enroll errors than the voter ID database
We find no evidence of differences in enrolment by gender,
ERROR COMPARISION (VOTER ID VS AADHAAR)
caste, religion, or education level.
IN VOTER ID IN AADHAAR
USER PERCEPTION OF AADHAAR ENROLMENT PROCESS ANDHRA PRADESH 2.4% 8.0%
RAJASTHAN 2.6% 4.8%
AP
WEST BENGAL 10.4% 12.2%
RJ
ERRORS WITHIN AADHAAR
WB
NAME ADDRESS DOB
0% 20% 40% 60% 80% 100% ANDHRA PRADESH 3.8% 1.2% 2.6%
EASY NEUTRAL DIFFICULT RAJASTHAN 1.5% 0.7% 2.4%
WEST BENGAL 5.6% 1.7% 3.5%
In Andhra Pradesh and West Bengal, a relatively small
number of people were wrongly charged an enrolment fee. People also encountered more challenges with the process
However, in Rajasthan 24% paid a fee. of updating their Aadhaar, compared to the process of
enrolling, such as paying higher-than-required fees.
3. EMERGING POLICY RECOMMENDATIONS
Facilitate updates to correct Aadhaar data Reinforce awareness of fees and
To reduce the number of errors in Aadhaar data, conduct processes for enrolment and updates
“update campaigns” and set up camps, similar to the Of those who paid higher-than-required fees, majority
enrolment camps that were well-received and worked were unaware of the actual cost. Conduct awareness
well in increasing Aadhaar coverage. campaign around fees and processes, especially for
vulnerable groups. Install a strong grievance redress
mechanism.AADHAAR AND
FINANCIAL INCLUSION
The “Jan Dhan” banking scheme, Aadhaar, and mobile (together called “JAM”) are meant to play a pivotal role in the
inclusion of unbanked, and underbanked, into the formal financial sector. There are two main channels through which
Aadhaar can help increase financial inclusion:
1 Open a bank account with an
Aadhaar letter or e-KYC 2 Increase account usage
through microATMs & DBTs
48 TO 138 MILLION 435
increase in e-KYC verifications from FY govt. schemes use DBTs to transfers benefits
2016-17 to 2017-18 (NPCI 2018) to bank accounts (some via Aadhaar),
incentivising account usage
1. WHAT HAS WORKED? 2. WHAT HAS NOT WORKED?
Aadhaar has become a common Use of microATMs remains low; e-KYC
proof-of-ID for bank account opening may not quicken a/c opening
The ubiquity of Aadhaar and its universal acceptance has Only 17% of account-holders had recently used
meant a high proportion of people use it to open a bank a microATM.
account. However, 66.9% used their Aadhaar as an analog, No meaningful difference in time reported to open
paper ID not e-KYC (used by 17.2%). an account with e-KYC vs. traditional KYC.
USE OF AADHAAR IN OPENING MOST RECENT
% OF RESPONDENTS WHO GOT ACCESS TO AN ACCOUNT
BANK ACCOUNT
WITHIN 1 DAY
66.9% 17.2% 15.9%
100% 39.0%
37.5%
USED AADHAAR AS ID
USED AADHAAR E-KYC DID NOT USE E-KYC
DID NOT USE AADHAAR USED E-KYC
3. EMERGING POLICY RECOMMENDATIONS
Strengthen business correspondent Push toward mobile-based financial
network services
Too few people currently have access to alternatives to In the absence of a sustainable BC network, there is
brick-and-mortar banks. Ready access to microATMs could opportunity for mobile-based financial services to provide
change this; however, the network supporting business greater access to accounts, and help reduce dormancy.
correspondents (BCs) needs to be strengthened. These services are able to use Aadhaar as an identity
platform.AADHAAR AND
FOOD RATION (PDS)
Aadhaar is envisioned as a key reform in India's social protection programmes for the poor, especially the
delivery of food ration subsidies via the Public Distribution System (PDS). Aadhaar's two main uses in PDS
have grown steadily over the last year.
1 Aadhaar seeding (aims to
remove duplicate and fake 2 Aadhaar-based biometric
authentication (aims to prevent
entries from databases) access to non-genuine persons)
72% TO 82% 35% TO 57%
increase in percentage of seeded PDS increase in percentage of PDS shops using
beneficiary households across all states e-PoS devices pan-India (Lok Sabha 2018)
in India (source in main report)
1. WHAT HAS WORKED? 2. WHAT HAS NOT WORKED?
Households feel secure that no one Exclusion from receiving benefits due to
else can take their ration Aadhaar-related factors significant
Majority in Andhra Pradesh and Rajasthan prefer 0.8%, 2.2%, and 0.8% of PDS beneficiaries in rural Andhra
Aadhaar-based PDS delivery as they perceive biometric Pradesh, Rajasthan, and West Bengal, respectively, are
authentication prevents identity fraud. excluded from their entitlements due to Aadhaar-related
factors. This extrapolates to ~2 million individuals monthly.
OPINION
However, non-Aadhaar reasons, such as ration
Worse Better unavailability, contribute much more to exclusion from PDS.
9.9%
REASONS MONTHLY
0.6%
EXCLUSION
No-one can No-one can 2.2%
FROM PDS
proxy take ration ~1.2M PEOPLE
More Less 0.7% 6.2%
technical technical 0.2%
issues issues 0.8%
0.1% ~0.5M
40% 20% 0% 0% 20% 40% 60% PEOPLE
RAJASTHAN
6.5%
ANDHRA PRADESH 5.2%
0.8%
1.1%
~0.3M
But biometrics is also the reason a quarter of the PEOPLE
beneficiaries consider the system worse, as it reduces 0.3%
flexibility to send a proxy to collect ration on one’s behalf. AP RJ WB
(AUG-NOV 2017) (OCT 2017-JAN 2018)
(SEP-DEC 2017)
NON-AADHAAR REASONS
For a more comprehensive treatment of these topics, please
AADHAAR AND NON-AADHAAR REASONS
read the full report. To download the report, the technical
appendix with tables, and learn about our research AADHAAR REASONS ONLY
methodology, please visit www.StateofAadhaar.in. UNKNOWN3. EMERGING POLICY RECOMMENDATIONS LEGAL HIGHLIGHTS OF THE
AADHAAR PLATFORM
In August 2017, the Supreme Court ruled that
To reduce programme exclusion,
privacy is a fundamental constitutional right.
re-consider monthly biometric
authentication
An overwhelming majority of Indians care about
Explore alternative technologies (e.g., offline their right to privacy; more than 96% of
authentication) or processes (e.g., annual verification) respondents stated it is important for them to
that provide a similar secure experience, but reduce know how their Aadhaar information is used by
Aadhaar-related exclusion. the government.
Enforce rules allowing alternate IDs AADHAAR AND TELECOM:
or authentication mechanisms QUICK HIGHLIGHTS
Mechanisms are in place to ensure benefits are not denied
due to Aadhaar: enforce these strongly. Awareness 77% of respondents approved of the mandatory
of other authentication means (e.g., mobile OTP) is low: linking of Aadhaar to services, including mobile
popularise them.
More than 50% of respondents who got a SIM
card in late 2016 or after, used e-KYC to do soTABLE OF CONTENTS Figures 1 Introduction 2 Aadhaar Platform 4 Aadhaar enrolment Aadhaar usage and awareness Aadhaar data quality and updating data Legal 13 Right to privacy judgement Mandatory linking of Aadhaar to services Data protection law Financial Inclusion 17 Opening a bank account Using a bank account Social Protection: Food Ration 22 User experience and exclusion User perception Government Savings Emerging Uses: Spotlight on Telecommunications 29 Looking Ahead 30 References 32
State of Aadhaar Report 2017-18

FIGURES

Figure 1.1     Significant Aadhaar developments in Financial Year (FY) 2017-18
Figure 1.2     State of Aadhaar Survey 2017-18, sample description

Figure 2.1     Interactions with the Aadhaar system
Figure 2.2     Comparison of SOA survey data and UIDAI data on enrolment
Figure 2.3     Comparison of saturation level in Aadhaar and voter ID for adult population
Figure 2.4     User perception of Aadhaar enrolment process
Figure 2.5     Different uses of Aadhaar by residents
Figure 2.6     Aadhaar authentication and unique residents authenticated over time, Apr 2016 – Feb 2018
Figure 2.7     Proportion of Aadhaar awareness levels among survey respondents
Figure 2.8     Comparison of errors in Aadhaar and voter ID
Figure 2.9     Types of error on Aadhaar letters with a demographic error

Figure 3.1     Importance of knowing how the government uses respondents' data (All three states: Andhra Pradesh,
               Rajasthan, West Bengal)
Figure 3.2     Approval ratings on mandatory linking of Aadhaar to services, by entity type (All three states: Andhra
               Pradesh, Rajasthan, West Bengal)

Figure 4.1     Proportion of respondents who used Aadhaar for bank account openings, since 2014
Figure 4.2     Proportion of respondents who possessed other IDs among those who "Used Aadhaar as ID"
               to open an account, since 2014
Figure 4.3     Monthly number of successful Aadhaar e-KYC verifications as per NPCI, Apr 2016 – Feb 2018
Figure 4.4     Proportion of respondents who got access to account within 1 day among those who used e-KYC
               and those who did not
Figure 4.5     Monthly transactions of AEPS and APBS, Apr 2016 – Feb 2018
Figure 4.6     Proportion of respondents who used their bank accounts by whether they receive DBTs or not

Figure 5.1     Proportion of beneficiaries seeded in India’s major social protection programmes
Figure 5.2     Proportion of fair price shops with e-PoS devices across India, Mar 2017 & Mar 2018
Figure 5.3     Average monthly exclusion from PDS and role of Aadhaar, Aug 2017 – Jan 2018
Figure 5.4     Breakdown of monthly exclusion rate by reasons for exclusion, for Rajasthan’s PDS, Sep 2017 - Dec 2017
Figure 5.5     Number of attempts required for successful Aadhaar-based Biometric Authentication in PDS
Figure 5.6     Opinion on whether use of Aadhaar for PDS delivery is better or worse than previous system
               and associated reasons
Figure 5.7     Government of India's savings estimate from Aadhaar, DBT, & other initiatives

Figure 6.1     Proportion of respondents who used Aadhaar for SIM cards since late 2016
Figure 6.2     Proportion of respondents got SIM activated in 1 day among those who used e-KYC vs. those who
               did not use e-KYC (All three states: Andhra Pradesh, Rajasthan, West Bengal)

                                                                                                                        1
State of Aadhaar Report 2017-18
INTRODUCTION
Aadhaar currently provides identification to more than For the first time in Aadhaar’s history, we now have an
1.2 billion Indian residents, or more than 90 percent of opportunity to catalyse such a data-rich discourse. In the
India’s population. Its scale, ability to uniquely identify last one year, more robust and independent evidence on
individuals, and digital interface make it a compelling how Aadhaar is working has been generated than in any
identification platform for use by the government, civil preceding year. The State of Aadhaar Survey 2017-18 (SOA
society, and private sector. These same features, however, survey) advances the evidence base with the largest
raise questions about privacy, data security, and exclusion survey on Aadhaar to date. The survey provides data
of vulnerable populations. representative of the rural populations of three states in
India: Andhra Pradesh, Rajasthan, and West Bengal. Given
These concerns came to the fore on multiple occasions the three states’ varying cultural contexts, governance
this past year, one of the most eventful since Aadhaar’s capacity, and take-up of Aadhaar use-cases, they also
inception in 2009. In Figure 1.1, we provide a timeline provide an indicative understanding of Aadhaar’s status
of these significant events. quo nationally. This survey, in conjunction with other
published research and official data, form the basis for this
Throughout this year, however, the discourse was fractious
report.
and polarized. Those challenging Aadhaar contended
that it is a tool for surveillance and disempowerment Our findings suggest that important reforms are required
of the poor and called for jettisoning the project. for Aadhaar to realise its potential, while simultaneously
Those in government posited that Aadhaar empowers limiting the risks it poses. To make genuine progress on
the poor, saves money for the exchequer, and increases the role of Aadhaar within India, we invite a vigorous
state capacity. Their resulting policy prescription is debate on our findings and their policy implications.
to aggressively scale the use of Aadhaar. We hope this debate advances objective, data-driven
discourse and decision-making on Aadhaar, and motivates
We at the State of Aadhaar initiative believe that instead
more independent research to answer questions as they
of this false dichotomy, India requires a more nuanced
arise. This type of empirical approach, we believe, will best
and empirically grounded discourse and decision-making
serve the interests of the country’s more than 1.3 billion
ecosystem around Aadhaar. We advocate for a careful and
residents.
case-by-case evaluation of Aadhaar’s applications using
objective data and evidence, in order to inform whether
a given use should be advanced, adjusted, or abandoned.
2State of Aadhaar Report 2017-18
Figure 1.1. Significant Aadhaar developments
in Financial Year (FY) 2017-18
RESEARCH METHODOLOGY
June 1: Ministry of Finance order mandates linking The State of Aadhaar Report 2017-18 combines primary
of Aadhaar with bank accounts
data collected from the SOA survey with secondary
June 9: Supreme Court allows Aadhaar-PAN linkage research that draws on administrative data and published
August 24: Supreme Court upholds the right to privacy research on Aadhaar.
as a fundamental right
October 16: Newspaper reports claim a 11-year old dies
of starvation as her family was denied food subsidies State of Aadhaar Survey 2017-18
due to their ration card not being linked to Aadhaar
The survey is designed to provide representative state-
November 19: Unique Identification Authority of India
(UIDAI), in a Right to Information (RTI) reply, stated level estimates of the rural populations of Andhra Pradesh,
that 210 government websites disclosed Aadhaar data Rajasthan, and West Bengal. The states were chosen to be
November 27: Government of India releases a white geographically distributed across India, representing
paper on “Data Protection Framework for India”
diverse contexts of culture and state capacity. In addition,
January 4: Journalist for The Tribune reported that she these states have varying penetration of Aadhaar in terms
was able to buy unauthorised access to a UIDAI portal
enabling her to get demographic details of any individual of enrolment and linkages to services.
upon entering a valid Aadhaar number
A total of 2,947 households were surveyed in person (see
January 10: UIDAI announced virtual ID, limited e-KYC,
and UID token Figure 1.2). The sample size was selected to maximise the
precision of the estimates while managing operational
January 17: Five-judge constitution bench begins
hearing 30 petitions challenging Aadhaar constraints. We used the Election Commission's public,
online voter ID database to construct the sampling frame.
Sources: Supreme Court orders, MeitY notification,
Sample selection used the probability proportional to size
newspaper reports
(PPS) method to sample districts (stratified by region)
and sub-district units. Simple random sampling was used
to select households and again to select individual
respondents within households.1
New to Aadhaar?
This report is written assuming a basic Secondary Research
understanding of Aadhaar and its uses.
Other sources for this report include data from various
If you require a primer, however, we
public portals maintained by the central and state
suggest reading our first report: governments, government reports and documents, and
State of Aadhaar Report 2016-17. published independent research. Please see our full list
of references at the end of the report.
Figure 1.2: State of Aadhaar Survey 2017-18, sample description
AP RJ WB ALL 3 STATES
Number of sampled households (and respondents) 1,142 965 840 2,947
Number of sampled household members 4,454 5,430 3,785 13,669
Number of sampled districts 6 (of 13) 8 (of 33) 7 (of 23) 21 (of 69)
Dates of survey Nov-Dec Dec 2017 - Jan-Feb Nov 2017 -
2017 Jan 2018 2018 Feb 2018
2017 rural population 34.8m 57.7m 65.9m 158.4m
Note: 2017 rural population estimates calculated using data from UIDAI and Census.
A detailed technical note on the survey methodology is available on www.StateofAadhaar.in.
1. One adult per household was selected to be the respondent. Some survey questions only concern the respondent themselves, while others concern all members
of the household, including children. 3State of Aadhaar Report 2017-18
AADHAAR
PLATFORM
Aadhaar is the world’s largest publicly run digital identity
database and it continues to grow. The database contains Figure 2.1: Interactions with the Aadhaar System
1.2 billion enrollees and has facilitated nearly 24 billion
digital authentications (Unique Identification Authority of
India 2018). This demonstrates phenomenal growth since
the first Aadhaar was issued in 2010, yet key questions ENROL USE
related to the platform – enrolment and updating
processes, usage, and data quality – remain unanswered.
As we show in Figure 2.1, these areas comprise the major
UPDATE PROCESS
touchpoints with the Aadhaar system.
With the State of Aadhaar Survey 2017-18 (SOA survey), UPDATE
FIX ERRORS
along with government administrative data, we begin IF ANY
INFO AS
REQUIRED
providing initial answers in this section. Specifically,
we seek to answer the following critical questions:
4State of Aadhaar Report 2017-18
1. What are people’s experience with the Aadhaar An important motivation for Aadhaar at the time of its
enrolment process? To what extent are people inception was to provide formal identification to those
excluded from the Aadhaar platform itself? who did not have one. However, in our survey, more
than 99 percent of respondents in all three states had
2. How do people use their Aadhaar? What are the most at least one other form of ID at the time of enrolment.5
common usages? This finding is also in line with an RTI response that
demonstrated the number of enrolments that used
3. What is the quality of the demographic data captured
the introducer system accounted for only 0.02 percent
by Aadhaar? What are individuals’ experiences
of total enrolments (Sharma (RTI) 2015).6
regarding fixing errors or updating their Aadhaar?
The next subsections discuss our findings related to
Figure 2.2: Comparison of SOA data and UIDAI
these questions. This is followed by a discussion on our
data on enrolment
recommended next steps informed by the findings.
% OF AADHAAR ENROLMENT
97.6%
AP 92.6%
AADHAAR ENROLMENT RJ
87.5%
86.7%
Overall Enrolment Trends in the WB
93.2%
94.0%
SOA survey
SOA DATA UIDAI DATA
The enrolment saturation rates from the SOA survey
Note: Error bars denote 95% confidence intervals
support the UIDAI’s saturation data (see Figure 2.2).
Number of observations: AP (4,448); RJ (5,396); WB (3,778)
Beyond the high saturation rate of more than 90 percent, Data sources: State of Aadhaar Survey 2017-18;
UIDAI State-wise Saturation Report, March 31, 2018
we looked into enrolment by different demographics.
We do not find that members of vulnerable communities
are less likely to be enrolled.2 This is indicative that
exclusion from Aadhaar is not only low, but also The most common forms of identification were ration
not systematically biased against the poor or vulnerable. cards and voter IDs. While both of these IDs are widely
accepted, it should be noted that they also have
For those who tried to enrol in the Aadhaar system limitations. Ration cards, in most states, are provided
but were turned away (1 percent of all household members at the household level, not the individual level. Voter IDs
across the three states), we sought to understand why. are restricted to those eligible to vote—meaning eighteen
The most common reason for rejection was "ineligibility years old and above. Thus, neither form of ID is universal
due to biometrics" which was 30.9 percent across all three in quite the same way as Aadhaar. A comparison of
states.3,4 Given the centrality of biometric capture to the saturation rates for Aadhaar and voter ID in the three
Aadhaar platform, the UIDAI should look into this issue states we surveyed can be seen in Figure 2.3.
further to determine root causes and to develop
technological or manual solutions.
2. We tested for differences in the following populations: gender, religion, age, and caste. We found that respondents above the age of 60 are more likely to be
enrolled. When conducting hypothesis tests for difference in outcomes between various groups we correct for multiple hypothesis testing using the Bonferroni
correction. This applies to all hypothesis tests contained in this report.
3. “Ineligibility due to biometrics” refers to cases where residents were told that their biometrics are not of sufficient quality to enrol in Aadhaar.
4. There was variation across states; however, the number of state-level observations was too small to be able to report on any differences across states.
5. In the survey, we used voter rolls to construct the sampling framework. We are fairly confident that our sample captures households where some members of
the household may have been left off the voter roll (as evidenced by the fact that more than 10 percent of adults within the sample did not have a voter ID).
However, one limitation of the survey is that we would have been unable to capture households where no single member is on the voter list. For more details
about the survey methodology, including limitations, please see www.StateofAadhaar.in.
6. The introducer system is intended to be an avenue of enrolment for individuals unable to provide proofs-of-identity. 5State of Aadhaar Report 2017-18
highest incidence of deviation was found in Rajasthan,
Figure 2.3: Comparison of saturation level in with 23.7 percent of people stating that they paid to enrol
Aadhaar and voter ID for adult population in Aadhaar. Those in Andhra Pradesh and West Bengal
experienced this issue as well with 9.0 percent and 5.7
PROPORTION OF RESPONDENTS
percent of people, respectively, paying to enrol. Those who
99.7% enrolled in an Aadhaar camp were less likely to have paid
AP 89.5%
for enrolment in all three states.
98.0%
RJ 82.7% While many enrollees reported facing inconveniences such
as failed enrolment or the charging of unnecessary fees,
97.8%
WB 93.7% an overwhelming majority of the respondents in all three
states indicated they found the enrolment process to be
AADHAAR VOTER ID
“easy” (see Figure 2.4).
Note: Error bars denote 95% confidence intervals
Number of observations (Aadhaar): AP (3,415); RJ (3,553);
WB (2,810) Number of observations (voter ID): AP (3,399);
RJ (3,553); WB (2,807)
AADHAAR USAGE AND
Data source: State of Aadhaar Survey 2017-18
Analysing the enrolment process
AWARENESS
The UIDAI has built a sizeable infrastructure for the A critical but largely unanswered question is how do
purposes of enrolment. We describe this infrastructure in people tend to use their Aadhaar. Below, we explore the
the Aadhaar Architecture chapter of the State of Aadhaar most common types of uses and look into how many
Report 2016-17. In this year’s report we focus on the people use each type.
efficacy of these systems, the resulting user experience,
and user perceptions of the enrolment process.
Usage to establish identity
UIDAI regulations state that enrolment in Aadhaar is free
The most common reported use of Aadhaar for
and no entity can charge a fee for this service (UIDAI
establishing identity is providing a photocopy of one’s
2016). However, findings from our survey show that this
Aadhaar letter.7 More than 93 percent of respondents in all
regulation has not always borne out in practice. The
three states claimed they have used Aadhaar in this way to
establish their identity (see Figure 2.5). The next most
common usage is fingerprint authentication. While this use
Figure 2.4: User perception of Aadhaar
is widespread in Andhra Pradesh (95.4 percent) and
enrolment process
Rajasthan (76.7 percent), it is less common in West Bengal
PROPORTION OF RESPONDENTS (48.8 percent). One probable explanation is the fact that
84.7% West Bengal’s ration system does not currently use
AP 6.3% Aadhaar-based biometric authentication at a large scale.
9.0%
Iris authentication usage in Andhra Pradesh is much higher
84.4% than in Rajasthan and West Bengal. This is likely due to the
RJ 5.7%
use of iris authentication in the Public Distribution System
9.8%
(PDS) and cash withdrawals from iris-enabled microATMs.
77.3%
WB 11.1% Data from the UIDAI shows that the number of overall
11.6%
Aadhaar authentications is growing steadily. Similarly, the
EASY NEUTRAL DIFFICULT number of unique IDs (UIDs) authenticated continues to
trend upward (UIDAI 2018). In February 2018, 271 million
Note: Error bars denote 95% confidence intervals
Number of observations: AP (1,140); RJ (950); WB (826) individuals used their Aadhaar to authenticate themselves,
Data sources: State of Aadhaar Survey 2017-18 representing nearly one in four people in possession of an
Aadhaar (see Figure 2.6).
7. The Aadhaar letter – sometimes referred to as an “Aadhaar card” – is issued by the UIDAI. The letter contains one’s Aadhaar number, demographic details, and
photograph. Throughout this report we refer to the letter as an “analog” or “non-digital” ID to differentiate between the biometrically-enabled aspects of the ID.
6State of Aadhaar Report 2017-18
Figure 2.5: Different uses of Aadhaar by residents
PROVIDED A PHOTOCOPY OF MY AADHAAR CARD
93.4%
96.8%
93.9%
SHOWED MY AADHAAR CARD AS A FORM OF ID
84.7%
39.9%
24.5 %
USED FINGERPRINT AUTHENTICATION
95.4%
76.7%
48.8%
USED IRIS AUTHENTICATION
26.4%
1%
2.2%
ANDHRA PRADESH
USED ONE-TIME-PASSWORD AUTHENTICATION RAJASTHAN
2.0% WEST BENGAL
2.0%
9.3% PROPORTION OF RESPONDENTS
Note: Error bars denote 95% confidence intervals
Number of observations: AP (1,142); RJ (952); WB (825)
Data source: State of Aadhaar Survey 2017-18
Figure 2.6: Aadhaar authentication and unique residents authenticated over time, Apr 2016 – Feb 2018
NUMBER OF AUTHENTICATIONS
1,463
NUMBER OF UIDS AUTHENTICATED
1,094
966
NUMBERS
IN MILLIONS
565 464
391
217
374
271
218
143 158 125
83
APR ‘16 JUN ‘16 OCT ‘16 JAN ‘17 APR ‘17 JUN ‘17 OCT ‘17 JAN ‘18 APR ‘18
Data source: UIDAI Dashboard
Awareness See Figure 2.7 for an assessment of awareness levels
for the three states in our survey. The UIDAI has set up
In our survey we asked a series of questions about regulations and systems to improve access and also
awareness to understand which features and safeguard its end users. However, lack of user awareness
functionalities people understood regarding Aadhaar. has limited the impact of these steps.
7State of Aadhaar Report 2017-18 8
State of Aadhaar Report 2017-18

EVOLVING FEATURES OF AADHAAR
To try and address growing concerns about privacy and data security, the UIDAI
recently launched three features: Virtual ID, Limited KYC, and UID token.

Virtual ID (VID) is a temporary 16-digit random number that can be generated
by residents against their Aadhaar numbers. VID, along with one’s biometrics,
can be used to authenticate oneself. The introduction of VID tackles privacy
concerns in two ways. One, it prevents agencies from linking databases using
Aadhaar’s unique identifier since each agency will only have access to the
temporary VID. Two, it allows an individual to have a choice about when (and
with whom) they share their Aadhaar number.

Limited Know-Your-Customer (KYC) is being introduced to regulate the storing
of Aadhaar numbers in different databases. As per the UIDAI’s notification, the
authority plans to allow only authentication agencies that are required by law to
receive full demographic information along with the Aadhaar number of an
individual. The remaining agencies will be subject to Limited KYC and will not
be allowed to store Aadhaar numbers upon authentication.

To facilitate uniqueness and security of beneficiaries in the authentication
agencies’ databases, the UIDAI aims to introduce a system called UID Token.
With this system, each individual Aadhaar number is given a unique token ID for
an authentication agency. That token is used for each transaction with that
agency, but not used anywhere beyond that agency (UIDAI 2018). This too
prevents different agencies from linking databases as each agency has a unique
token for an individual that cannot be mapped to the token of that individual
from another database.

Efforts to advance and evolve security features to better protect residents
should be encouraged. However, given low levels of awareness of other security
features such as biometric locking, simply offering these features is unlikely to
result in sufficient uptake (see Figure 2.7). The government should engage in
thoughtful campaigns, targeted toward individual users and institutions
requiring Aadhaar for identification to ensure the objectives of these initiatives
are met. Finally, these measures, and the processes accompanying them, need
careful and rapid testing to ensure they are optimised to provide a seamless
and effective layer of protection.

                                                                                     9
State of Aadhaar Report 2017-18
Figure 2.7: Proportion of Aadhaar awareness levels among survey respondents
CATEGORY ISSUE AP RJ WB ALL 3 STATES
Authentication Awareness of fingerprint authentication 97.8 87.6 71.5 85.1
Awareness
Awareness of iris authentication 45.7 15.4 30.8 31.0
Awareness of OTP authentication 6.1 10.0 13.9 10.1
Awareness of all three 5.8 7.2 8.7 7.2
t
UIDAI Enrolment is free of cost 40.2 41.0 43.3 41.6
Regulations
Updating should cost only ₹15 4.8 11.8 8.0 7.3
Security Features Aware of biometric locking & unlocking 2.0 3.4 3.9 3.1
Note: The fee charged for updates was ₹15 but has recently been increased to ₹25
Number of observations: The number of observations reported above varies by question and by state. Most questions were asked to all respondents
who have an Aadhaar, with variation arising from the removal of “don’t know” responses. However, the question on cost of updating was only asked
to a relevant subset (275). See the technical appendix on www.StateofAadhaar.in for more details.
Data source: State of Aadhaar Survey 2017-18
To interpret the errors compared with the most widely
AADHAAR DATA QUALITY used alternative, we also asked if respondents had errors
in their voter ID cards. We see that in Andhra Pradesh and
AND UPDATING DATA Rajasthan the proportion of respondents with errors in
Aadhaar are more than three times and nearly two times
While saturation levels are important, it is equally
higher than for voter IDs, respectively, while in West
imperative to ensure that the information collected is
Bengal the Aadhaar error rate is higher, though the
accurate. Low data quality would lead to errors in seeding
difference is not as extreme (see Figure 2.8).
and a less reliable e-KYC process. Through our survey, we
wanted to gain a better understanding of the quality of We also wanted to identify which types of information
the demographic data captured through Aadhaar. To are most error-prone. The most common source of error
understand this vital component of Aadhaar, we examined in Andhra Pradesh and West Bengal was the name of the
several related indicators, such as the proportion of respondent, while in Rajasthan date of birth contained the
respondents that self-reported an error in their Aadhaar highest number of self-reported errors (see Figure 2.9).
data, the frequency of updating (due to errors or a need to The magnitude of error(s) also matters in terms of how
update information), and the proportion of duplicates in the error affects people. Of those who reported an error
the system. We also wanted to understand people’s in their name, about one-third claimed their full name
experience with the updating process. was wrong while two-thirds noted an incorrect spelling.
We also asked respondents about the perceived source
Data quality of the error. Eighty-nine percent reported their error(s)
was due to data entry mistakes while 10.3 percent stated
At the peak of the enrolment process, the UIDAI was a pre-existing error in a source document. The remaining
facilitating enrolment of nearly one million people a day errors were attributed to mistakes made by the
(State of Aadhaar Report 2016-17). This raises the question respondents themselves.
about whether the scale of the enrolment made the
exercise vulnerable to data entry errors. When asked, The UIDAI has established processes for the correction
8.8 percent of people stated that their Aadhaar letter of errors in Aadhaar. Most who tried to get their error
contained an error. The errors are self-reported and there rectified claimed to be successful. However, only 53.0
is reason to believe these are a lower-bound estimate for percent of those with errors actually reported trying to get
errors. 8 the error corrected. An important concern that emerges
from the data on the enrolment process is that of the
8. We believe self-reported errors will be lower than externally verified errors. This assumes that respondents are more likely to report an error that has affected
their ability to use their Aadhaar or access services, and less likely to report an error if it does not impede any uses. For example, a name may be misspelled or
wrongly transliterated from another language into English, but a respondent would likely only report the error if it has led to service denials or other issues.
10 Additionally, respondents who are not literate might not be able to tell if some information is incorrect.State of Aadhaar Report 2017-18
respondents who paid to get the error fixed (82.4 Updating data
percent), 96.0 percent reported paying more than
the designated fee of ₹25.9 Updating Aadhaar data will become essential to ensuring
accuracy of the information. This primarily involves
In contrast to the high number of respondents reporting updating contact details, photographs, and biometric
ease in the enrolment process, the proportion is lower for information of children once they turn five and again at
the correction of errors. In Andhra Pradesh and Rajasthan age fifteen, per the UIDAI requirements. Some updates are
69.1 percent and 67.0 percent, respectively, stated that required on an ad hoc basis (updating one’s address after
they found the process “easy.”10 In West Bengal, 47.8 a move) while some updates are cyclical (updating one’s
percent of those who attempted to fix errors felt the photo every ten years). The proportion of people that
process was “easy.” This indicates that there are challenges updated their data in cases where their address had
or barriers in this process that should be addressed to changed was low (13.0 percent) amongst the three states.
improve the user experience and to ensure the accuracy The proportion was higher (25.5 percent) in the case of
of the Aadhaar data. updating mobile phones numbers.
Figure 2.8: Comparison of errors in Aadhaar
and voter ID
PROPORTION OF RESPONDENTS
DISCUSSION
8.0%
AP 2.4% As noted above, people were generally satisfied with the
Aadhaar enrolment process. However, they faced greater
4.8%
RJ 2.6%
challenges when fixing mistakes or updating information.
12.2% Updates will be required as long as the system is in place.
WB 10.4%
Consequently, the UIDAI should examine the successes of
the enrolment system and think critically about how to
ERROR RATE IN AADHAAR improve the updating process.
ERROR RATE IN VOTER ID
As the administrator of the world’s largest biometric
Note: Error bars denote 95% confidence intervals
database, the UIDAI will face significant challenges
Number of observations (Aadhaar): AP (4,275); RJ (4,669); WB (3,435)
Number of observations (voter ID): AP (2,999); RJ (2,934); WB (2,611) ensuring Aadhaar data remains current and updated.
Data source: State of Aadhaar Survey 2017-18
A system containing errors is likely to cause problems,
ranging from minor inconveniences to serious threats of
exclusion.
Figure 2.9: Types of error on Aadhaar letters
with a demographic error Similarly, some uses of Aadhaar authentication remain low,
particularly OTP and iris authentication. Given fairly high
PROPORTION OF RESPONDENTS rates of mobile penetration, it may be worthwhile for the
48.3% UIDAI to invest in awareness campaigns aimed at the ease
AP 15.3% of OTP authentication. This could also provide relief for
33.8%
individuals who struggle to authenticate using their
32.2% biometrics. Additionally, the overwhelmingly high use of
RJ 15.6% Aadhaar in its analog form necessitates a greater focus on
50.4%
adding security features to the physical copy of Aadhaar
47.7% as well. As Aadhaar’s use as an identity platform continues
WB 14.5% to increase, it is vital for the underlying quality of its
30.2%
database to improve, along with well-established
NAME ADDRESS DATE OF BIRTH processes to continuously stay up to date. Having achieved
exemplary scale, a renewed focus toward quality and
Note: Error bars denote 95% confidence intervals
updating processes may be important next steps for the
Number of observations: AP (333); RJ (223); WB (410)
Data source: State of Aadhaar Survey 2017-18 UIDAI.
9. The fee charged for updates was ₹15 but has recently been increased to ₹25.
11
10. The number of respondents who answered this question was less than fifty in Andhra Pradesh and Rajasthan.State of Aadhaar Report 2017-18
DUPLICATE AADHAAR "CARDS"
One of the strongest arguments in favour of Aadhaar is the ability to create a
database free of duplicate entries. The unique 12-digit number combined with
individuals’ unique biometric information is meant to create a system in which
each individual is only entered once.
Our survey data suggests this is mostly true; however, we found three cases in
which individuals possessed two Aadhaar letters—containing matching name
and demographics but with a distinct unique ID number. At 0.1 percent of our
sample, this represents a small but meaningful number.11
Based on UIDAI’s performance data, the false acceptance rate was expected to
be 0.035 percent (State of Aadhaar Report 2016-17). However, given different
estimation methods and the low incidence in our sample, we cannot strictly
compare these two statistics.
11.
11. A direct extrapolation of this number would be equivalent to 71,300 duplicates across the rural population of all three states. The 95 percent confidence interval
around this estimate ranges from 3 to 213,900, meaning there is a wide variance on our estimate for how many duplicates may exist. However, we may want to
think of this number as a lower-bound considering that anyone who intentionally obtained a second Aadhaar (for nefarious purposes) would likely not have
shared this information with our survey team. Note that we confirmed that these were indeed duplicate Aadhaars and not the respondent mistaking their
temporary enrollment ID to an Aadhaar number.
12State of Aadhaar Report 2017-18
LEGAL
As we write this report, a five-judge constitution bench of India has also set in motion a consultative process
the Supreme Court of India is hearing 30 petitions regarding the framing of a much-needed data protection
challenging the legality of Aadhaar. The Court is expected law (Ministry of Electronics and Information Technology
to answer foundational questions about the digital identify [MeitY] 2017).
platform. Is the 2016 Aadhaar Act, passed as a Money Bill,
constitutional? Is Aadhaar’s use of biometrics in In this chapter, we provide a brief overview of these legal
conformity with our newly codified right to privacy? Are developments in the Aadhaar ecosystem over the last year.
the burdens borne by Indian residents due to the use of We do not discuss the current set of petitions being heard
Aadhaar justified by the potential gains? in the Supreme Court as the matter has not concluded at
the time of sending this report to print.
In answering these questions, the Supreme Court can play
a crucial role in shaping our institutions and ability to
manage risks in a fast-paced digital world. In August 2017,
its landmark judgement on the right to privacy served as
confirmation of this role. In addition, the Government of
13State of Aadhaar Report 2017-18
RIGHT TO PRIVACY Figure 3.1: Importance of knowing how
the government uses respondents' data
JUDGEMENT (All three states: AP, RJ, WB)
PROPORTION OF RESPONDENTS
A nine-judge bench of the Supreme Court of India passed
a landmark judgement recognizing our fundamental right 96.5%
to privacy as emanating from Article 21 (right to life and 96.5%
personal liberty) and other rights guaranteed under Part III
97.0%
of India’s Constitution. The judgement came in light of a
series of individual petitions linked to Aadhaar combined
BASIC PERSONAL INFO (NAME, AGE, ETC.)
with the writ petition filed by retired High Court Justice
BIOMETRIC INFO (FINGERPRINTS, ETC.)
K.S. Puttaswamy challenging various aspects of the
AADHAAR NUMBER
Aadhaar project, especially its potential violations of
individual privacy. Note: Error bars denote 95% confidence intervals
Number of observations (for basic personal information):
AP (1,135); RJ (939); WB (836)
Whether India’s constitution allows a right to privacy
Number of observations (for biometric information): AP (1,137);
remained unsettled before this judgement. While there RJ (932); WB (829)
Number of observations (for Aadhaar number): AP (1,129); RJ
were two- or three-judge benches that ruled that it was a
(924); WB (820)
right (Gobind vs State of Madhya Pradesh 1975; Malak Data source: State of Aadhaar Survey 2017-18
Singh 1980), the Union of India argued against a blanket
right to privacy, citing larger Supreme Court benches
(M P Sharma 1954; Kharak Singh 1962).
Privacy was deemed an undeveloped and elitist concept in MANDATORY LINKING OF
the proceedings (Justice K S Puttaswamy (Retd.) and Anr
versus Union of India and Ors 2017). Findings from the
AADHAAR TO SERVICES
SOA survey do not support this view. To a question asking
Using Section 7 of the Aadhaar Act 2016, central and state
SOA survey respondents whether they consider it
governments have required beneficiaries of 252 schemes
important (or not) to know how the government uses their
(as of December 2017) to authenticate themselves using
information, more than 96 percent of respondents in the
Aadhaar (Rajya Sabha Question 2018).
three surveyed states contended that it was indeed
important, for all three types of information shown in One of these uses, put forward by the Department of
Figure 3.1. These findings are in line with qualitative Telecommunications in March 2016, asks for Aadhaar-
interviews conducted with low-income individuals in a based verification of all existing mobile phone
collaborative effort between Dalberg, CGAP, and Dvara subscribers.12 Similarly, an order in June 2017 by the
Research. One of their key insights was that respondents Supreme Court upheld a move allowing the linking of
were “highly protective” of their personal information, Aadhaar to each individual’s PAN (Binoy Viswam versus
including their Aadhaar numbers (Privacy on the Line Union of India & Ors 2017).
2017).
We asked respondents in the SOA survey whether they
The dimensions of privacy discussed in the judgement approved or disapproved of the decision to mandatorily
include an individual's right to seclusion, autonomy over link Aadhaar to services offered by the government and
fundamental personal choices, and the right to control the private sector. Approximately 87 percent of people
dissemination of personal information. Similar to other approved of the government’s mandatory use of Aadhaar,
fundamental rights, the judgement maintained that the while 76.9 percent approved Aadhaar’s mandatory use by
right to privacy can be subject to reasonable restrictions the private sector. See Figure 3.2.
where such an invasion must be justified by law and a
legitimate state aim, including preserving scarce resources.
12. The Supreme Court order that led to this notification, however, was more tentative in language on what types of mobile subscribers should be covered and
whether Aadhaar should be used exclusively in the verification process (State of Aadhaar Blog 2017).
14State of Aadhaar Report 2017-18
DATA PROTECTION LAW Figure 3.2: Approval ratings on mandatory linking
of Aadhaar to services, by entity type (All three
states: Andhra Pradesh, Rajasthan, West Bengal)
With an ever-growing digital economy and the right to
privacy judgement, discussion about the need for a data PROPORTION OF RESPONDENTS
protection law intensified this past year. The MeitY APPROVE
constituted an expert committee led by Justice B.N. 86.5%
76.9%
Srikrishna to identify data protection issues in India and
NEUTRAL
draft a bill addressing these concerns. The committee
6.5%
released a white paper in November 2017 to seek public 10.1%
views to define the contours of a data protection law in
DISAPPROVE
India. The paper outlines seven principles for data
7.0%
protection in India—technology agnosticism, holistic 13.0%
application, informed consent, data minimisation,
controller accountability, structured enforcement, and GOVERNMENT
deterrent penalties (MeitY 2017). It draws on existing PRIVATE COMPANIES
international laws—such as the European Union’s General
Data Protection Regulation (2016) as well as South Africa’s Note: Error bars denote 95% confidence intervals
Number of observations (for government services): AP (1,136);
Protection of Personal Information Act (2013)—and raises
RJ (945); WB (828)
questions on subject matters ranging from potential Number of observations (for private services): AP (1,103);
RJ (935); WB (823)
definition of different types of data, the territorial scope,
Data source: State of Aadhaar Survey 2017-18
extent of exemptions, existence of a data protection
authority, and the model of regulatory approach that must
be adopted.
organisation, raises potential conflicts, and is not ideal
given the complexity of regulatory requirements.
DISCUSSION With the past and forthcoming Supreme Court judgements
and the establishment of the Srikrishna Committee to
actively look into data protection, the government has the
The Supreme Court judgement on privacy, the mandatory
opportunity to institute a strong data protection law and
linking of services, and the forthcoming data protection
regulator to manage risks posed by Aadhaar and other
law all pivot around the central question of whether and
digital tools, an opportunity we hope it seizes.
how Aadhaar can be a tool for infringement of privacy.
We believe that Aadhaar, if unregulated, can be a tool that
erodes our fundamental right to privacy. However, it is only
a tool and other public and private digital platforms are
also capable of invading our privacy. Therefore, as we do
with any tool in the public domain, we need to take
advantage of its benefits while managing its risks.
More fundamentally, the threat of privacy infringement
highlights the need for a strong data protection law
backed by an independent, competent, and fully
authorised data protection regulator to enforce it.
Currently, UIDAI acts as both a data controller of Aadhaar
demographic and biometric information and regulator to
ensure the appropriate use of that information. This can be
ineffective given the dual purpose for a single
15State of Aadhaar Report 2017-18
AADHAAR DATA DISCLOSURE
While there has been no unauthorised data disclosure of enrolment data within
the UIDAI’s Central Identities Data Repository, Aadhaar numbers and
demographic details have been disclosed on other public portals.
A report released by the Centre for Internet and Society reported that Aadhaar
numbers and demographic details of 135 million residents were disclosed on
four government portals due to lack of stringent IT measures (Sinha and Kodali
2017). The MeitY further reported that, as per the UIDAI, 210 government
websites had revealed details of Aadhaar and other personal data (Lok Sabha
Question 2018).
Name, address, bank account details, and Aadhaar numbers of more than a
million beneficiaries of an old age pension scheme in Jharkhand were published
on a website maintained by the Jharkhand Directorate of Social Security in July
2017 (Sethi, Bansal, and Saurav 2017).
A journalist for the Tribune reported a data breach in which she was able to buy
access to a UIDAI portal. With this access, one could enter a person’s Aadhaar
number and obtain personal demographic data (Khaira 2018).
16You can also read


