Measurement report: Changing characteristics of atmospheric CH4 in the Tibetan Plateau: records from 1994 to 2019 at the Mount Waliguan station
←
→
Page content transcription
If your browser does not render page correctly, please read the page content below
Atmos. Chem. Phys., 21, 393–413, 2021
https://doi.org/10.5194/acp-21-393-2021
© Author(s) 2021. This work is distributed under
the Creative Commons Attribution 4.0 License.

Measurement report: Changing characteristics of atmospheric
CH4 in the Tibetan Plateau: records from 1994 to 2019
at the Mount Waliguan station
Shuo Liu1,2,3 , Shuangxi Fang3 , Peng Liu4 , Miao Liang5 , Minrui Guo6 , and Zhaozhong Feng1,7
1 StateKey Laboratory of Urban and Regional Ecology, Research Center for Eco-Environmental Sciences,
Chinese Academy of Sciences, Beijing, China
2 College of Resources and Environment, University of Chinese Academy of Sciences, Beijing, China
3 College of Environmental and Resource Sciences, Zhejiang University of Technology, Hangzhou, China
4 Mt. Waliguan background station, China Meteorological Administration (CMA), Qinghai, China
5 Meteorological Observation Center (MOC), China Meteorological Administration (CMA), Beijing, China
6 College of Global Change and Earth System Science, Beijing Normal University, Beijing, China
7 Key Laboratory of Agrometeorology of Jiangsu Province, Institute of Ecology, School of Applied Meteorology,

Nanjing University of Information Science and Technology, Nanjing, China

Correspondence: Shuangxi Fang (fangsx@cma.gov.cn) and Zhaozhong Feng (zhzhfeng201@hotmail.com)

Received: 17 May 2020 – Discussion started: 29 July 2020
Revised: 2 November 2020 – Accepted: 3 November 2020 – Published: 14 January 2021

Abstract. A 26-year, long-term record of atmospheric              from northeast (city regions) to southwest (northern India);
methane (CH4 ) measured in situ at the Mount Waliguan             and (iv) the annual growth rates in recent years (e.g., 2008–
(WLG) station, the only World Meteorological Organization         2019) were significantly larger than those in the early periods
(WMO) and Global Atmosphere Watch (GAW) global sta-               (e.g., 1994–2007).
tion in inland Eurasia, is presented. Overall, a nearly con-
tinuous increase in atmospheric CH4 was observed at WLG,
with a yearly growth rate of 5.1 ± 0.1 parts per billion (ppb)
per year during 1994–2019, except for some particular pe-         1   Introduction
riods with near-zero or negative values, e.g., 1999–2000
and 2004–2006. The average CH4 mole fraction was only             Since the preindustrial era, the emission of greenhouse gases
1799.0 ± 0.4 ppb in 1994 but increased to about 133 ppb and       (GHGs) has increased continuously, and large increases have
reached a historic level of 1932.0±0.1 ppb in 2019. The case      been found in recent years, with the concentration now be-
study in the Tibetan Plateau showed that the atmospheric          ing higher than ever (WMO, 2019). The GHGs perturb the
CH4 increased rapidly. During some special periods, it is         infrared radiation balance, which traps the heat in the atmo-
even larger than that of city regions (e.g., 6.7 ± 0.2 ppb yr−1   sphere and contributes to global warming, melting glaciers
in 2003–2007). Generally, the characteristics of CH4 varied       and causing extreme weather events and many other global
in different observing periods as follows: (i) the diurnal cy-    climate changes (IPCC, 2014). The recent 30-year span from
cle has become apparent and the amplitudes of the diurnal or      1983 to 2012 was the warmest of the last 800 years in the
seasonal cycles increased over time; (ii) the wind sectors with   Northern Hemisphere, and half of the rising surface temper-
elevated CH4 mole fractions switched from ENE-E-ESE-SE-           atures were due to increased GHG emissions (IPCC, 2014).
SSE sectors (wind directions) in early periods to NNE-NE-         As one of the most important GHGs, methane (CH4 ) has a
ENE-E sectors in later years; (iii) the area of source regions    global warming effect that is just less than carbon dioxide
increased as the years progressed, and strong sources shifted     (CO2 ; Etminan et al., 2016). CH4 has an 8–12 year life-
                                                                  time (Battle et al., 1996), with a global warming potential

Published by Copernicus Publications on behalf of the European Geosciences Union.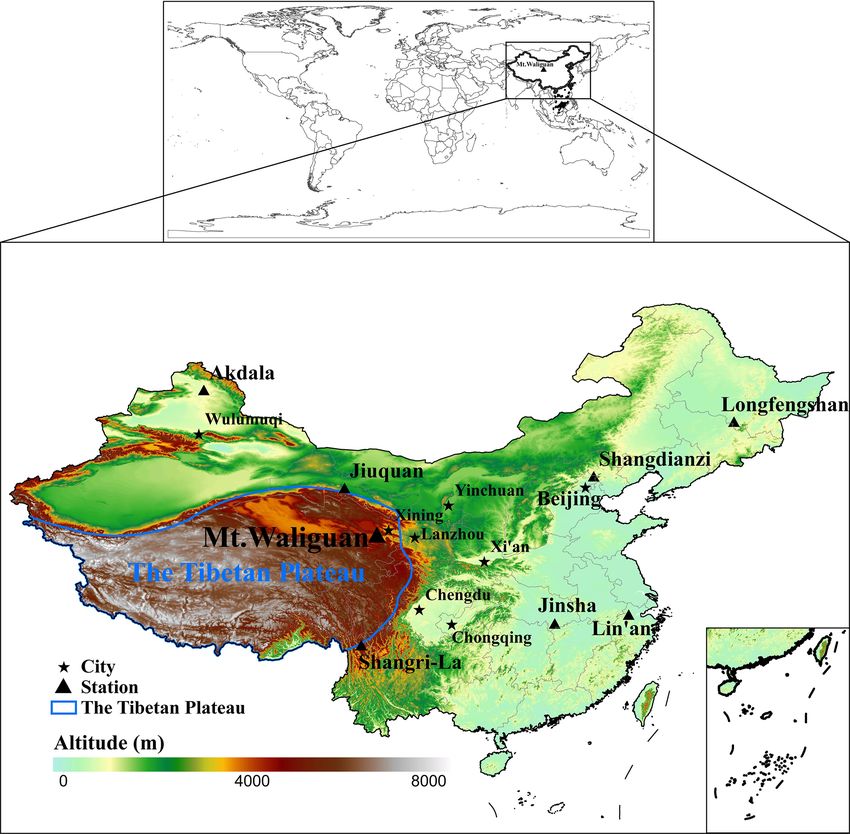
394                                        S. Liu et al.: Changing characteristics of atmospheric CH4 in the Tibetan Plateau

                                                                                                                              q
∼ 23 times greater than CO2 over a 100-year horizon (Weber           et al., 1981). Therefore, the interannual variation in OH or
et al., 2019). CH4 also contributed to about 17 % of the ra-         the decline of the oxidative capacity of the atmosphere may
diative forcing caused by long-lived greenhouse gases from           also cause the recent increase in the CH4 growth rates (Rigby
1750 to 2016 (Etminan et al., 2016). Since the beginning             et al., 2017; Turner et al., 2017). The exact causes of signifi-
of the industrial era, the concentration of CH4 has rapidly          cant increases in the CH4 emissions in the past years remain
increased because of the influence of anthropogenic activi-          debated, especially for the anomalous periods with a sudden,
ties (Saunois et al., 2016). Results from ice cores analyses         large growth due to the sparse time and space measurements
in Antarctica showed that the atmospheric concentration of           and the crude models, which limited our understanding of the
CH4 has reached an unprecedented level over the last 0.8 mil-        global variation in atmospheric CH4 (Saunois et al., 2019;
lion years (IPCC, 2014).                                             Weber et al., 2019). As a consequence, it will be impractical
   At the beginning of the 1990s, the CH4 mole fraction              to predict CH4 trends in the future and then develop realistic
showed a decreasing trend. Consequently, the reverse trend           management (Nisbet et al., 2019).
has been observed since 1998 due to the higher global mean              Systematic observations are a prerequisite to obtain an
temperature (Dlugokencky et al., 1998; Nisbet et al., 2014).         accurate understanding of the spatial and temporal behav-
However, a low growth rate was sustained over 1999 to 2006,          iors of atmospheric CH4 concentrations. Since 1978, sys-
except for years with El Niño events (2002–2003; Dlugo-              tematic measurements of atmospheric CH4 have been taken
kencky et al., 1998). The annual growth rate dropped from            around the world (Blake et al., 1982; Rasmussen and Khalil,
∼ 12 ppb yr−1 to near zero from the late 1980s to 2006,              1984; Dlugokencky et al., 1994). On the northern slope of
followed by a renewed CH4 increase since then (Nisbet et             the Mauna Loa volcano, Hawaii, there exists the first global
al., 2019). During 2007–2013, the annual growth rate of              station, Mauna Loa (MLO), which has performed at about
methane was 5.7±1.2 ppb yr−1 . After 2013, the atmospheric           3397 m above sea level (a.s.l.) and far away from local
CH4 grew at rates not observed, such as 12.7 ± 0.5 ppb yr−1          sources and sinks. It has the longest record of continuous
in 2014 and 10.1 ± 0.7 ppb yr−1 in 2015 (Nisbet et al., 2016,        atmospheric CH4 observations (Keeling et al., 1976). Re-
2019). In the most recent decade, the global mean growth             cently, other stations have been installed for CH4 observa-
rate was 7.1 ppb yr−1 (WMO, 2019). The World Meteoro-                tions, such as Barrow (BRW), USA, the South Pole (SPO;
logical Organization (WMO) and Global Atmospheric Watch              polar site; Dlugokencky et al., 1995), Cape Grim (CGO),
(GAW) program’s annual greenhouse gas bulletin revealed              Australia, and Minamitorishima (MNM), Japan (coastal
that the global average mole fraction of CH4 reached a new           and island sites; Pearman and Beardsmore, 1984; Wada
high of 1869 ± 2 ppb in 2018 (Rubino et al., 2019), which            et al., 2007), Jungfraujoch (JFJ), Switzerland, and Mount
was ∼ 259 % of preindustrial levels (∼ 722 ppb around 1750           Waliguan (WGL), China (continental mountain site; Zhou et
CE – common era; Etheridge et al., 1998; WMO, 2019).                 al., 2004; Loov et al., 2008). Hundreds of CH4 observation
   Atmospheric CH4 is mainly emitted from natural sources            stations worldwide are currently running under the frame-
(e.g., about 40 % from ruminants and wetlands) and an-               work of the WMO/GAW.
thropogenic sources (e.g., about 60 % from paddies, cattle              China has the largest anthropogenic CH4 emissions in the
ranches, coal mines, fossil fuels, and biomass burning; Haus-        world (Janssens-Maenhout et al., 2019). The Tibetan Plateau,
mann et al., 2016; Saunois et al., 2016). Observations from          with an average altitude of over 4000 m a.s.l., has long been
the GAW indicated that the causes of the recent increase were        recognized as the roof of the world. By coincidence, the
likely attributed to anthropogenic emissions at midlatitudes         two largest CH4 source regions in the world (i.e., eastern
in the Northern Hemisphere and the wetlands in the tropics           China and northern India) are trapped in between by the Ti-
(WMO, 2019). The rapid development of population growth,             betan Plateau (Zhang et al., 2011; Fu et al., 2012; Wilson
economic expansion, and urbanization of countries has led            and Smith, 2015). Under the characteristics of special ge-
to more and more fossil fuel production and consumption              ographical conditions, lower population density, rare indus-
(e.g., the large-scale exploitation of natural gas, oil, and coal)   trial activities, and high sensitivity to external disturbances,
and biomass burning. Consequently, large amounts of an-              the Tibetan Plateau is one of the ideal regions to observe
thropogenic CH4 were emitted around the world in recent              a continual CH4 signal (Zhou et al., 2005; Fu et al., 2012;
years (Galloway, 1989; Streets and Waldhoff, 2000; Wang et           Zhang et al., 2013). Most of the previous studies reported on
al., 2002; Lin et al., 2014; Hausmann et al., 2016). The recent      the short-term CH4 variations in China and concluded that
carbon isotope study revealed that biogenic emissions might          the long-term observation is of great value to enhance the
also have driven CH4 increases, including microbial sources          understanding of the global carbon cycle (Cai et al., 2000;
from rice paddies, ruminants, termites, enteric fermentation,        Zou et al., 2005; Wang et al., 2009; Fang et al., 2013; Yuan
or a combination of these (Nisbet et al., 2016; Schaefer et          et al., 2019). As the rapid development of China and India
al., 2016; Wolf et al., 2017). About 90 % of the CH4 destruc-        continues, the characteristics of CH4 on the Tibetan Plateau
tion in the atmosphere is from the reaction with hydroxyl            might change significantly over time. Since 1994, in situ
            q
radicals ( OH; Vaghjiani and Ravishankara, 1991; Bousquet            measurements of atmospheric CH4 have been launched at the
et al., 2011), an important oxidant in the troposphere (Logan        Mt. Waliguan (WLG) station. To study the long-term varia-

Atmos. Chem. Phys., 21, 393–413, 2021                                                   https://doi.org/10.5194/acp-21-393-2021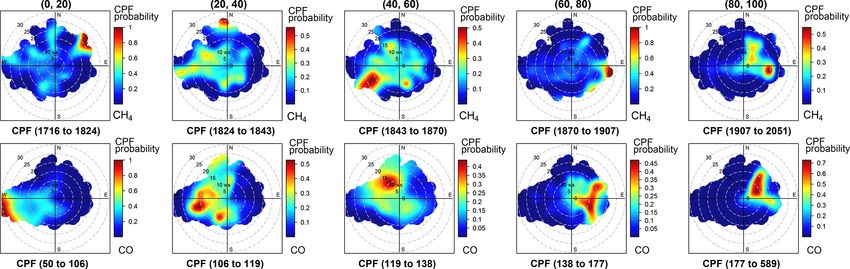
S. Liu et al.: Changing characteristics of atmospheric CH4 in the Tibetan Plateau                                           395

tions in the atmospheric CH4 and obtain a new insight on its    an 89 m steel triangular tower located approximately 15 m
characteristics in the inland of Eurasia, the performance of    from the main observatory. The residence time of the ambi-
26 years of in situ observations at the Mt. Waliguan base-      ent air from the top of the tower to the instrument is 30 s.
line observatory were evaluated, which is the longest record    The ambient air is first passed through a 7 mm stainless steel
in China. Temporal patterns, annual variations, long-term       membrane filter located upstream of the pump and then (after
trends, air mass transports, and the spatial distribution of    the pump) passed through a pressure relief valve set at 1 atm
potential sources were analyzed. In addition, the case stud-    to release excess air and pressure. The ambient air is then
ies combining atmospheric carbon monoxide (CO) measure-         dried to a dew point of approximately −60 ◦ C by passing it
ments and a separate analysis between the Tibetan Plateau       through a glass trap submerged in a −70 ◦ C methanol bath.
and the city regions were performed to constrain the contri-    All standard gases supplied to the instruments are from pres-
bution of anthropogenic emissions.                              surized 37.5 L treated aluminum alloy cylinders fitted with
                                                                high-purity, two-stage gas regulators. Stainless-steel tubing
                                                                (0.32 cm o.d.; 0.22 cm inner diameter – i.d.) is used for the
2     Methodology                                               standard gas sample line and the ambient sample line after
                                                                the cold trap. An automated sampling module equipped with
2.1    Measurement site
                                                                a VICI eight-port valve is designed to sample from separate
The Mt. Waliguan (WLG; 36.28◦ N, 100.09◦ E; 3816 m a.s.l.)      gas streams (standard tanks and ambient air). According to
station is situated at the edge of northeastern Tibetan         the comparability target of the WMO/GAW program (WMO,
(Qinghai-Xizang) Plateau, which is in remote western China      2019), methane mole fractions are referenced to a working
and isolated from populated and industrial regions (Fig. 1).    high (WH) standard and a working low (WL) standard. Ad-
WLG is the only WMO/GAW global background station in            ditionally, a calibrated cylinder filled with compressed ambi-
Eurasia and is run by the China Meteorological Administra-      ent air is used as a target (T) gas to check the precision and
tion (CMA). The surroundings of the site are pristine, with     stability of the system routinely. A diagram of the observing
sparse vegetation and naturally arid and semiarid grasslands.   system during different periods is seen in Zhou et al. (2004)
Small farms with yak and sheep are in the valley. Two ad-       and Fang et al. (2013). Here, we focus on the longest contin-
jacent large cities, namely Xining (∼ 2.2 million popula-       uous measurements of CH4 from August 1994 to December
tion) and Lanzhou, are located about 90 km northeast and        2019 at WLG. Data gaps in limited periods are because of the
260 km east of the station, respectively. The Longyangxia       malfunction of instrument and the maintenance of the sam-
hydroelectric station (∼ 380 km2 ) is located approximately     pling system.
13 km south to southwest of WLG. The predominant winds             The records of CO in this study were initially observed
at WLG are mainly from the southwest and east in win-           by a residual gas analyzer (RGA-3) gas chromatograph (GC)
ter and summer, respectively (Zhou et al., 2004; Zhang et       equipped with an HgO reduction detector (Trace Analytical
al., 2011), which is controlled by the Tibetan Plateau mon-     Laboratories, Inc.) since 1994. An automated sampling mod-
soon. Simultaneously, diurnal variations in vertical winds at   ule was designed to sample from ambient air and series nine
WLG are influenced by mountain–valley breezes, where up-        standards. A detailed diagram of the system was described
slope flow brings heated air masses from the boundary layer     by Zhang et al. (2011). Since 2010, the CO has been mea-
to the site in the daytime and downslope flow results in cool   sured by the cavity ring-down spectroscopy instrument (Pi-
air mass transport from the mountain peak to the site. Under    carro G1302 and G2401, since 2015). The scale for all of the
this unique location, the observation at WLG can provide es-    CO measurements was further updated to WMO X2014A.
sential information on CH4 sources and sinks from Eurasia
(Zhou et al., 2005; Zhang et al., 2013).                        2.3   Data processing

2.2    Instrumental setup                                       Most on-site CH4 observations were unavoidably influenced
                                                                by local sources and other complex conditions (e.g., traf-
Atmospheric CH4 has been measured quasi-continuously,           fic transportation and various topography). As a result, the
using a Hewlett Packard (HP) 5890 gas chromatograph (GC)        records cannot fully represent the regional atmospheric CH4
equipped with a flame ionization detector (FID), since July     in well-mixed conditions (Liu et al., 2019). To obtain region-
1994, and an Agilent 6890N GC equipped with a FID, since        ally representative records, we excluded the CH4 data influ-
June 2008. Both of the systems used the same sampling pro-      enced by local sources adjacent to the site (e.g., agricultural
cedures. A cavity ring-down spectroscopy system (Picarro        fields, cities, and traffic emissions). The hourly CH4 data
G1301) began in January 2009, and the instrument was up-        were classified as locally or regionally representative through
graded to Picarro G2401 in 2015. Ambient air is delivered to    the meteorological approach, which was based on essential
the above systems at about 5 L min−1 by a KNF Neuberger         meteorological information, similar to previous studies by
N2202 vacuum pump via a dedicated 0.95 cm outer diame-          Zhou et al. (2004) and Liu et al. (2019). In this study, the CH4
ter (o.d.) sample line from an 80 m intake line attached to     records associated with local surface winds from selected

https://doi.org/10.5194/acp-21-393-2021                                             Atmos. Chem. Phys., 21, 393–413, 2021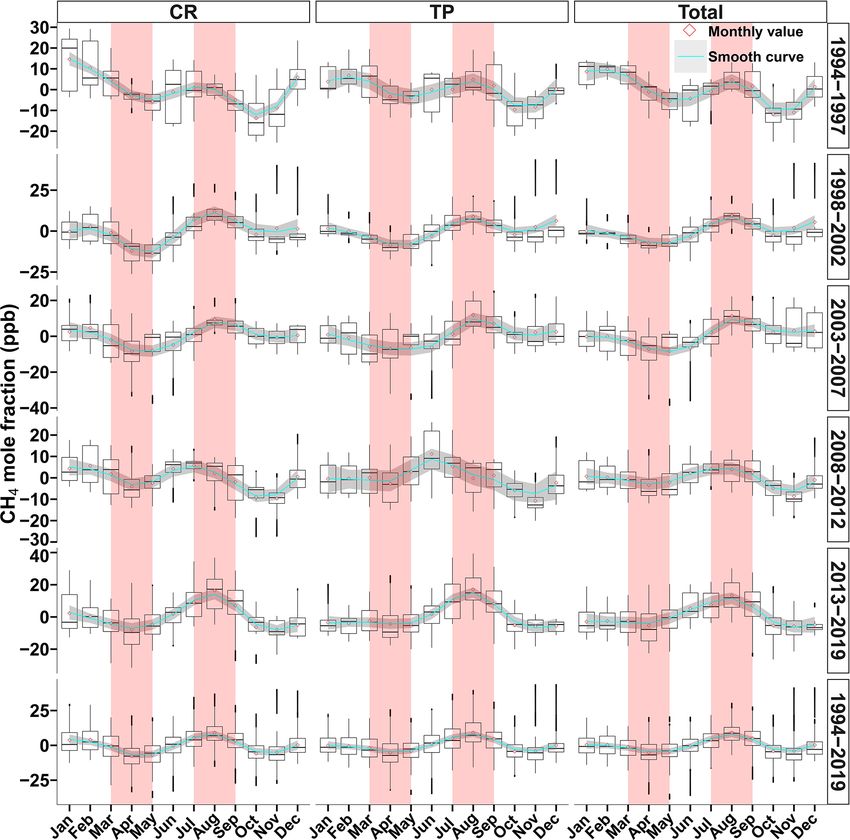
396                                       S. Liu et al.: Changing characteristics of atmospheric CH4 in the Tibetan Plateau

Figure 1. The location of Mt. Waliguan (WLG) World Meteorological Organization (WMO) and Global Atmosphere Watch (GAW) global
station and the other regional stations in China. The gradient color indicates altitude. The digital elevation model (DEM) was downloaded
from the Geospatial Data Cloud site, Computer Network Information Center, Chinese Academy of Sciences (http://www.gscloud.cn, last
access: 22 September 2018), and then processed by ArcGis software. The China 1094 map was derived from the © National Geomatics
Center of China (http://www.ngcc.cn/ngcc/, last access: 17 March 2018). The world map was obtained from © OpenStreetMap contributors
2019 and is distributed under a Creative Commons BY-SA license (https://www.openstreetmap.org/, last access: 18 February 2018).

sectors, i.e., NNE-NE-ENE in spring, NE-ENE-E-ESE-SE in                SW-WSW-W) of the station and is the well-known Tibetan
summer, NE-ENE-E-ESE in autumn, and NE-ENE in winter,                  (Qinghai-Xizang) Plateau (TP; Fig. S1 in the Supplement).
were flagged as locally influenced (27.0 %). Subsequently,             Accordingly, the hourly CH4 records of when the surface
we rejected a portion of daytime records to minimize the               winds come from these sectors were divided into two sub-
effect of human activities (16.9 %), e.g., 09:00–13:00 local           sets (i.e., TP and CRs). The long-term variations between the
time (LT) in summer and 10:00–17:00 LT in winter. Finally,             two regions and the total regional time series were further
we filtered CH4 data into locally influenced, when the sur-            compared and analyzed.
face wind speeds were less than 1.5 m s−1 , to minimize the               To understand the influence of local surface wind, hourly
very local accumulation (9.2 %).                                       CH4 data was binned into 16 horizontal wind direction
   In order to investigate the influence of anthropogenic              classes (Fang et al., 2013). In this study, we used the po-
emissions from cities and remote areas such as the Tibetan             larPlot function in the openair package of the statistical soft-
plateau, we divided the CH4 data into two main influencing             ware R (R Core Team, 2019). It shows the bivariate (i.e.,
regions according to the analysis, including the geograph-             wind speed and wind direction) polar plot of CH4 concentra-
ical conditions, the effect of surface winds, the long-range           tions, and the concentrations are calculated as a continuous
transports, and the potential source distributions. The first re-      surface by modeling it using smoothing techniques (Carslaw
gion covers the northeast and southeast (NNE-NE-ENE-E-                 et al., 2006; Diederich, 2007). Also, the conditional proba-
ESE-SE) of WLG, which is denoted as city regions (CRs).                bility function (CPF) was used to investigate the probability
The second region is located in the south to west (S-SSW-              of which wind directions are dominated by high CH4 mole

Atmos. Chem. Phys., 21, 393–413, 2021                                                      https://doi.org/10.5194/acp-21-393-2021
S. Liu et al.: Changing characteristics of atmospheric CH4 in the Tibetan Plateau 397
fractions (Uria-Tellaetxe and Carslaw, 2014). In order to transform (FFT) was utilized to smooth the fitting residuals
study the pollution transport pathways of air masses at WLG, (Press et al., 1992).
the cluster analysis of 3 d back trajectories was applied us- The significant difference test was applied by the scheir-
ing the Hybrid Single-Particle Lagrangian Integrated Trajec- erRayHare function in the rcompanion package of R soft-
tory (HYSPLIT) dispersion model (Draxier and Hess, 1998; ware, which is a nonparametric test for a two-way analysis of
Rousseau et al., 2004) on the strength of gridded meteoro- variance (ANOVA). The multiple comparison was used by a
logical data (2004–2019) from the National Oceanographic Wilcoxon rank sum test with R (R Core Team, 2019). For the
and Atmospheric Administration’s Air Resources Labora- correlation analysis between CH4 and CO, we obtained the
tory (NOAA ARL). The spatial resolution of the model is detrended time series of CH4 and CO from 2004–2019, based
0.5 × 0.5◦ , and the model height is 10 km a.s.l. We computed on the method by Thoning et al. (1989). The detrended values
the back trajectories coincident with hourly CH4 mole frac- are denoted as 1CH4 and 1CO, which are the original data
tions. The trajectories for January, April, July, and October points minus the trend curve. To accurately obtain the corre-
were calculated to represent the seasons of winter, spring, lation slopes of 1CO and 1CH4 , i.e., 1CO/1CH4 , a rolling
summer, and autumn, respectively. The spatial source dis- linear regression was applied to the 1CH4 and 1CO time se-
tributions of annual CH4 were analyzed using the potential ries by the roll_lm function in the roll package of R (R Core
source contribution function (PSCF) approach, which com- Team, 2019). We successively moved a 24 h time window
puted the conditional probability of the residence times of air by 1 h over the whole time series. Similar to the study by
parcels with greater concentration than threshold transport to Tohjima et al. (2014), we set three criteria to achieve a better
the exact receptor site (Ashbaugh et al., 1985). In this study, quality control of the slopes. When (i) the number of the CH4
the PSCF value was calculated in 0.5 × 0.5◦ grid cell (i, j ) record is less than five in 24 h, (ii) the coefficient variation
as follows: in the correlation slope is more than 15 %, and (iii) the abso-
lute value of the correlation slope is less than 0.8 (|R| < 0.8),
PSCFij = mij /nij . (1) the correlation slopes were identified as statistically insignifi-
cant and inaccurate and were rejected. In order to understand
nij represents the number of endpoints that terminate in the the year-to-year variations, we analyzed the CH4 variation
ij th grid cell, while the number of trajectories with concen- over different periods in 1994–2019. The entire CH4 time
trations exceeding the threshold value was defined as mij series was divided into five observing periods, i.e., 1994–
(Polissar et al., 1999). In order to reduce the abnormal in- 1997, 1998–2002, 2003–2007, 2008–2012, and 2013–2019
fluence of small nij values in some grid cells, PSCFij was according to the significant stages or the critical time period
further computed by an arbitrary weighting function Wij as of atmospheric CH4 variations from previous studies (Zhou
follows: et al., 2004; Fang et al., 2013; Zhang et al., 2013; Nisbet et
al., 2019; WMO, 2020). Unless otherwise stated, the aver-
1.00 3nave < nij
age values in this study are presented with 95 % confidence
0.70 1.5nave < nij ≤ 3nave
Wij = . (2) intervals (CIs).
0.42 nave < nij ≤ 1.5nave
0.05 nij ≤ nave
Wij represents the weight of the cell (i, j ), nij is the number 3 Results and discussion
of trajectory endpoints that fall in the ij th grid cell, while the
nave shows the mean number of the endpoints in all grid cells. 3.1 Extracting the regional atmospheric methane
In order to fill the data gaps so as to evaluate the long-term
To precisely understand the characteristics of atmospheric
CH4 trend, we applied the curve-fitting approach by Thoning
CH4 , including seasonal cycles and long-term trends, it is
et al. (1989). We also calculated the trend curve that excluded
vital to identify the CH4 records in well-mixed air without
the influence of seasonal variation and then obtained the an-
local contaminants (Liu et al., 2019). In this study, hourly
nual growth rates by the average of the first derivative of the
CH4 measurements between 1994 and 2019 were analyzed,
trend curve. The function consists of the polynomial part and
resulting in 64.0 % of the CH4 data being classified as re-
the annual harmonics part, as follows:
gionally representative, with an average CH4 mole fraction
f (t) = a0 + a1 t + a2 t 2 + . . . + a(k−1) t (k−1) of 1865.8 ± 0.4 ppb. The average of the locally influenced
Xnh data (1868.2 ± 0.3 ppb) was larger than that of the region-
+ c [sin (2nπ t) + ϕn ] . (3) ally representative records (Table 1). The filtered regional or
n=1 n
local time series is shown in Fig. 2. It can be seen that the
k represents the number of polynomials part, and nh is the CH4 mole fractions increased from 1994 to 2019. The at-
number of harmonics part. We applied k = 3 polynomial mospheric CH4 showed a strong growth and displayed large
terms (a quadratic) for multiyear trends and nh = 4 yearly fluctuation. In 1994, the average CH4 mole fraction was
harmonics for seasonal cycles in this study. The fast Fourier only 1799.0 ± 0.4 ppb; however, the average value increased
https://doi.org/10.5194/acp-21-393-2021 Atmos. Chem. Phys., 21, 393–413, 2021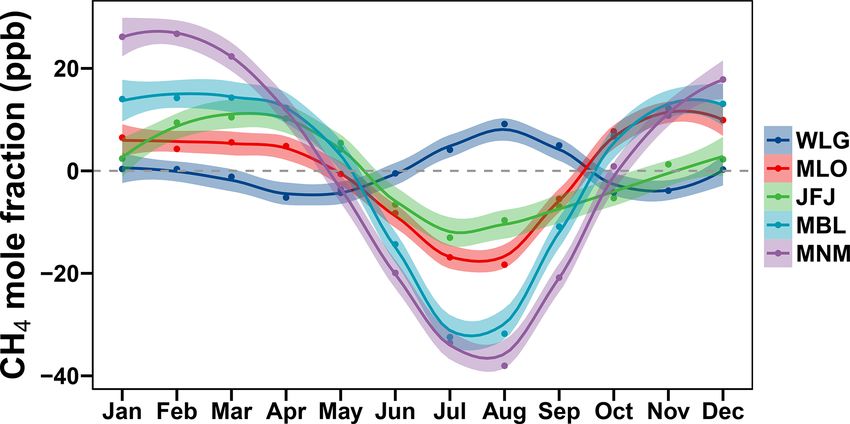
398 S. Liu et al.: Changing characteristics of atmospheric CH4 in the Tibetan Plateau
to 133 ppb by the year 2019 (1932.0 ± 0.1 ppb; Table 2). mole fractions suggested that WLG was increasingly affected
Compared with the global average mole fractions in recent by local and regional anthropogenic sources such as gas ex-
years, i.e., 1853 ± 2 ppb in 2016, 1859 ± 2 ppb in 2017, and ploitation and grazing (Zhou et al., 2004).
1869 ± 2 ppb in 2018 (WMO, 2019, 2020), the atmospheric
CH4 mole fractions at WLG are significantly higher. These 3.3 The impact of local surface winds
results indicate that WLG has been affected by strong CH4
sources in recent years, which is possibly due to the influ- Similar to the short-term study by Zhou et al. (2004), the
ence of the two largest source regions of northern India and atmospheric CH4 at WLG was significantly influenced by
eastern China (Fang et al., 2013; Zhou et al., 2004). local surface winds from the northeastern and southeastern
sectors (Fig. 4f). Slight differences were also found among
3.2 Diurnal variations seasons. In the spring, when the wind was originating from
the NNE-NE-ENE-E sectors, the atmospheric CH4 was en-
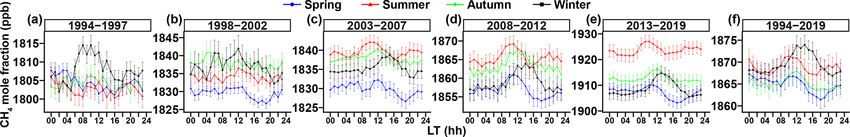
Distinct diurnal cycles were observed in four seasons during hanced by 8.0–15.4 ppb, compared to the seasonal average
1994–2019 at WLG. The CH4 mole fraction increased from (1862.4 ± 3.7 ppb). In the summer and autumn, the wind
early morning, reached a maximum at noon, and had a trough from the NNE-NE-ENE-E-ESE-SE produced higher CH4
in the late afternoon (Fig. 3f). However, differences also ex- mole fractions, with an enhancement of 2.5–14.6 and 1.6–
isted in the four seasons. In spring and summer, the atmo- 19.3 ppb, respectively. In winter, similar to that in spring, the
spheric CH4 increased from 09:00 to 13:00 LT at noon, with CH4 mole fractions significantly increased from the NNE-
a daily amplitude of 5.8 ± 2.8 and 4.4 ± 3.4 ppb, respectively NE-ENE-E sectors with a value of 14.7–25.8 ppb higher
(Table S1 in the Supplement). In autumn, the diurnal varia- than the seasonal average (1871.3 ± 6.7 ppb). In summer,
tion showed an amplitude of 4.3 ± 3.1 ppb, with one peak at the prevailing winds were from the NE-ENE-E-ESE sectors
noon. In winter, a large increase in CH4 was found during (∼ 46 %; Fig. S2), and the CH4 mole fractions were also
09:00–17:00 LT, with the largest peak-to-trough amplitude higher in the related sectors. However, in autumn and winter,
of 7.1 ± 2.9 ppb. Different patterns for diurnal CH4 cycles although the prevailing wind and the high wind speed were
were also found over different periods. In 1994–2002, the from the SSW-SW-WSW-W sectors (∼ 40 %–50 %; Fig. S2),
CH4 mole fractions in the winter were higher than the other the high CH4 mole fractions were from the opposite wind
seasons (Fig. 3a, b), which was likely due to the manner of sectors of NNE-NE-ENE-E-ESE (Fig. 4f), suggesting that
heating (e.g., large biomass burning) and the adverse diffu- strong local sources were distributed from the northeast to
sion conditions in cold weather (Fang et al., 2013). However, southeast of WLG (city regions) and even covered the emis-
the highest value was found in summer during the periods of sion of natural sources. Causes of the elevated CH4 from
2003–2007, 2008–2012, and 2013–2019 (Fig. 3c–e), which these sectors could be attributed to the large plantations of
could be ascribed to the transport of anthropogenic emis- highland barley and the high population density in those
sions (e.g., southeastern cities) by the meteorological factors areas (Fang et al., 2013). The two largest cities of Xining
(Zhang et al., 2013). Additionally, in summer, the intense (with a population of ∼ 2.2 million) and Lanzhou (with a
herding or grazing activities around WLG have enhanced the population of ∼ 4 million) are also situated in the north-
regional CH4 emissions and, hence, contributed to the higher east and east of WLG, respectively. The heavy human ac-
CH4 mole fractions (Zhou et al., 2004). tivities from anthropogenic fossil combustion, landfills, and
Similar to the previous studies by Zhang et al. (2013) and livestock could also have emitted large amounts of CH4 .
Fang et al. (2013), diurnal cycles were ambiguous before Based on the data from the Emissions Database for Global
2002 (Fig. 3a, b), but significant diurnal variations appeared Atmospheric Research (EDGAR), the increase in CH4 emis-
afterward (Fig. 3c–e), which indicated that the local sources sion was 500 kg yr−1 in these two regions throughout 1994–
were weak at WLG in the past. The apparent diurnal cycles 2015 (Crippa et al., 2019a). Also, the Yellow River Canyon
after 2002 may be attributed to the intense activities by hu- (YRC) industrial area, which is ∼ 500 km northeast of WLG,
mans (e.g., grazing and burning fuel), which were enhanced may also have contributed to the high CH4 values (Zhou et
in the daytime and weakened at nighttime (Fang et al., 2013). al., 2003). With the rapid development of land use, water
The peak-to-trough amplitude almost increased in almost all utilization, and agriculture sources in the YRC, large CH4
seasons. For example, in spring, the amplitude was 6.5 ±3.1, emissions could easily have been transported to WLG. Pre-
4.7±2.1, 5.6±2.7, 7.0±3.1, and 6.9±3.1 ppb over the peri- vious studies on black carbon (BC) and carbon monoxide
ods of 1994–1997, 1998–2002, 2003–2007, 2008–2012, and (CO) also revealed that the high CH4 values at WLG in win-
2013–2019, respectively (Table S1). The meteorological con- ter were a result of transport from the YRC (Tang et al., 1999;
ditions (e.g., diffusion and transport) could also have con- Zhou et al., 2003).
tributed to the increasing CH4 amplitude. WLG was remote The wind rose distribution of CH4 mole fractions indicated
from the populated center; therefore, the good diffusion con- that the elevated CH4 mole fractions varied in early periods
ditions in the daytime may have brought high anthropogenic (i.e., 1994–1997 and 1998–2002) to recent periods (2003–
emitted CH4 to the site. The increasing amplitude and CH4 2007, 2008–2012, and 2013–2019). The elevated CH4 was
Atmos. Chem. Phys., 21, 393–413, 2021 https://doi.org/10.5194/acp-21-393-2021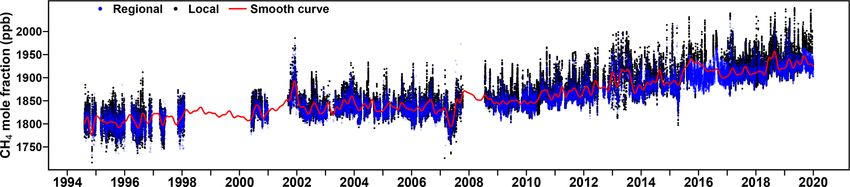
S. Liu et al.: Changing characteristics of atmospheric CH4 in the Tibetan Plateau                                                            399

Table 1. The statistics of the filtered CH4 data series over different periods during 1994–2019 at the WLG station. Note: ppb – parts per
billion.

                   Year                     Regionally representative                          Locally influenced
                                    Hours     Percentage (%)      Mean (ppb)       Hours     Percentage (%)      Mean (ppb)
                   1994–1997       16 122           71.3         1801.7 ± 0.5       6481           28.7         1806.2 ± 0.3
                   1998–2002       26 347           83.2         1832.6 ± 0.7       5336           16.8         1837.7 ± 0.3
                   2003–2007       28 181           69.4         1832.3 ± 0.3      12 443          30.6         1839.2 ± 0.2
                   2008–2012       19 627           63.5         1856.2 ± 0.4      11 287          36.5         1865.2 ± 0.3
                   2013–2019       21 683           44.2         1906.8 ± 0.3      27 329          55.8         1920.4 ± 0.4
                   1994–2019      111 960           64.0         1865.8 ± 0.4      62 876          36.0         1868.2 ± 0.3

Figure 2. The filtered hourly CH4 data series, from 1994 to 2019, at the WLG station. The transparent blue points are regionally representative
data. The black points are locally influenced data. The red lines are the smooth values of the regional data obtained by the curve-fitting routine
of Thoning et al. (1989).

Table 2. Yearly average CH4 mole fractions at the WLG station.             wind from the city regions had an increasing effect on the
                                                                           atmospheric CH4 at WLG.
           Year     Mean (ppb)      Year      Mean (ppb)                      The CPF was applied to hourly CH4 and CO data by con-
           1994    1799.0 ± 0.4     2007     1837.2 ± 0.5
                                                                           sidering intervals of entire data percentiles including 0–20th,
           1995    1803.6 ± 0.1     2008     1854.8 ± 0.1                  20th–40th, 40th–60th, 60th–80th, and 80th–100th to draw
           1996    1808.8 ± 0.2     2009     1847.2 ± 0.1                  the CPF polar plot (Uria-Tellaetxe and Carslaw, 2014). It was
           1997    1811.5 ± 0.2     2010     1856.6 ± 0.2                  clear that the different sources only affected the CH4 mole
           1998    1826.8 ± 0.1     2011     1867.4 ± 0.1                  fractions in different percentile ranges (Fig. 5), meaning that
           1999    1819.7 ± 0.1     2012     1879.6 ± 0.2                  the specific sources were prominent for specific percentile
           2000    1819.7 ± 0.2     2013     1895.7 ± 0.4                  ranges. For most wind speed directions, the CPF probability
           2001    1847.3 ± 0.4     2014     1890.2 ± 0.2                  of the CH4 being greater than the 60th percentile was trend-
           2002    1833.7 ± 0.2     2015     1913.0 ± 0.4                  ing to zero, and most sources contributed to the percentiles
           2003    1840.8 ± 0.2     2016     1914.4 ± 0.2                  less than the 60th for the CH4 mole fraction (e.g., 40th–
           2004    1836.1 ± 0.2     2017     1911.6 ± 0.1
                                                                           60th). These results implied that most areas around WLG
           2005    1836.7 ± 0.1     2018     1925.6 ± 0.3
           2006    1834.7 ± 0.2     2019     1932.0 ± 0.1
                                                                           had a small contribution to the CH4 emissions. In addition,
                                                                           the wind from the northeast and the southeast was important
                                                                           for the cases of the higher percentiles, resulting in the highest
                                                                           CH4 mole fractions of 1870–1907 ppb for the 60th–80th per-
                                                                           centiles and 1907–2051 ppb for the 80th–100th percentiles
predominately from the ENE-E-ESESE-SSE sectors in the                      (Fig. 5), which revealed the existence of a northeastern and a
early years (Fig. 4a, b) but evolved to the NNE-NE-ENE-E                   southeastern strong source region. The anthropogenic emis-
sectors in later years (Fig. 4c–e). Furthermore, the amplitude             sions from cities (e.g., Lanzhou or Chengdu) were the only
of enhancements was also increasing along with the progres-                cause for high values in the southeast. It is obvious that the
sion of time. For example, in autumn, the maximums were                    CO sources gradually shifted with the increase in the per-
from the east in 1994–1997, ENE in 1998–2002 and again                     centile ranges (Fig. 5). The areas in which the CPF probabil-
in 2003–2007, northeast in 2008–2012, and finally ENE in                   ities were higher were the NW-SW sectors when percentages
2013–2019, with the successive increases of 8.6, 12.1, 14.7,               ranged from 0 to 40. Nevertheless, when data exceeded the
16.8, and 18.8 ppb, respectively. Therefore, the local surface             60th percentile, the high probability areas completely moved

https://doi.org/10.5194/acp-21-393-2021                                                          Atmos. Chem. Phys., 21, 393–413, 2021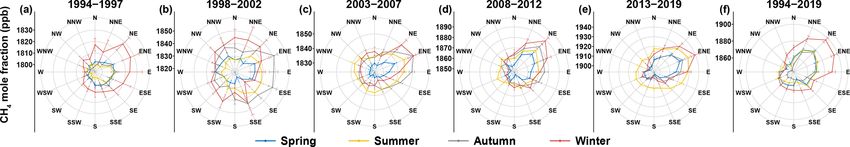
400                                        S. Liu et al.: Changing characteristics of atmospheric CH4 in the Tibetan Plateau

Figure 3. Diurnal CH4 cycles in different periods from 1994 to 2019 at the WLG station. The lines with different colors represent various
seasons. Error bars indicate the 95 % confidence intervals.

Figure 4. The wind rose distribution of the average CH4 mole fractions from 16 horizontal wind directions over different periods during
1994–2019 at the WLG station. The different colors represent the CH4 data in different seasons. Error bars in all directions indicate 95 %
confidence intervals.

to NE-SE sectors. Similar to that of CH4 , the high CO mole            where there was, together with rapid industrial development,
fractions were consistent from the eastern regions (urbanized          natural gas and petroleum resource exploitation, and residue
areas; Fig. 5), indicating strong anthropogenic sources in the         burning of large crops; hence, the CH4 emissions were strong
city regions (e.g., Xining and Lanzhou; Zhang et al., 2011).           (Fang et al., 2013; Zhang et al., 2013). In the autumn, all
                                                                       the air masses were originated from the western and north-
3.4     Long-range transport and potential source                      western regions (Fig. 6c). In winter, the air masses primar-
        distributions                                                  ily came from northwestern and southwestern regions, e.g.,
                                                                       cluster 3 (56.4 %) and cluster 1 (32.1 %; Fig. 6d), but the air
3.4.1    Air mass transports                                           masses (cluster 2) from the city regions brought the highest
                                                                       CH4 mole fractions, with an enhancement of ∼ 27 ppb over
Figure 6 illustrates the cluster analysis of the 3 d back tra-         the seasonal average. Almost all the air masses were from
jectories between 2004 and 2019. In the spring, the majority           the southwestern or northwestern regions in the autumn and
of the air masses were from the western and northwestern               winter, suggesting that these regions that were farther away
regions, which accounted for about 36.2 % (cluster 3) and              from the site became strong source contributors to WLG.
36.4 % (cluster 1) of the total trajectories (Fig. 6a). These
air masses were accompanied by lower CH4 mole fractions                3.4.2   Spatial distribution of potential source regions
than those from the eastern and northeastern regions, such as
cluster 2 (27.3 % of the total; Table 3). The largest enhance-         The potential sources were analyzed over different periods,
ment was also in cluster 2 at ∼ 6 ppb relative to the average.         i.e., 2004–2007, 2008–2012, and 2013–2019 (Fig. 7). Gen-
In the summer, 43.3 % of the air masses were from eastern              erally, the strongest sources were located northeast or south-
regions (cluster 3). However, the highest CH4 mole fractions           east of the station, especially in summer, but a large area of
were in cluster 2 from northwestern regions (Fig. 6b). The             sources was identified from the southwestern to the north-
air masses from eastern and northeastern regions passed over           western regions, which also contained CH4 emissions from
the cities of Xining and Lanzhou (capital of Gansu province),          the northwestern Gansu province, the northwestern Qing-
which are populated centers and industrial areas; hence, high          hai province, and southeast of the XUAR. Additionally, the
CH4 mole fractions were found. However, the higher CH4                 source regions differed in various seasons. The potential
mole fractions were also observed when the air masses were             source regions in the spring (Fig. 7a–c) and winter (Fig. 7j–l)
from the northwest to the southwest (Table 3), which was be-           were larger than those in the summer (Fig. 7d–f) and autumn
cause the air masses had passed through the northwest of the           (Fig. 7g–i). The seasonal difference was due to the effect of
Qinghai province and the central area of the Xinjiang Uygur            westerlies or the southeastern monsoons (Zhou et al., 2004).
Autonomous Region (XUAR). This is where the Ge’ermu ur-                   There were also trends in the CH4 source regions corre-
ban area (the second-largest city of Qinghai) was located and          lated with specific years, namely (i) the area of the potential

Atmos. Chem. Phys., 21, 393–413, 2021                                                      https://doi.org/10.5194/acp-21-393-2021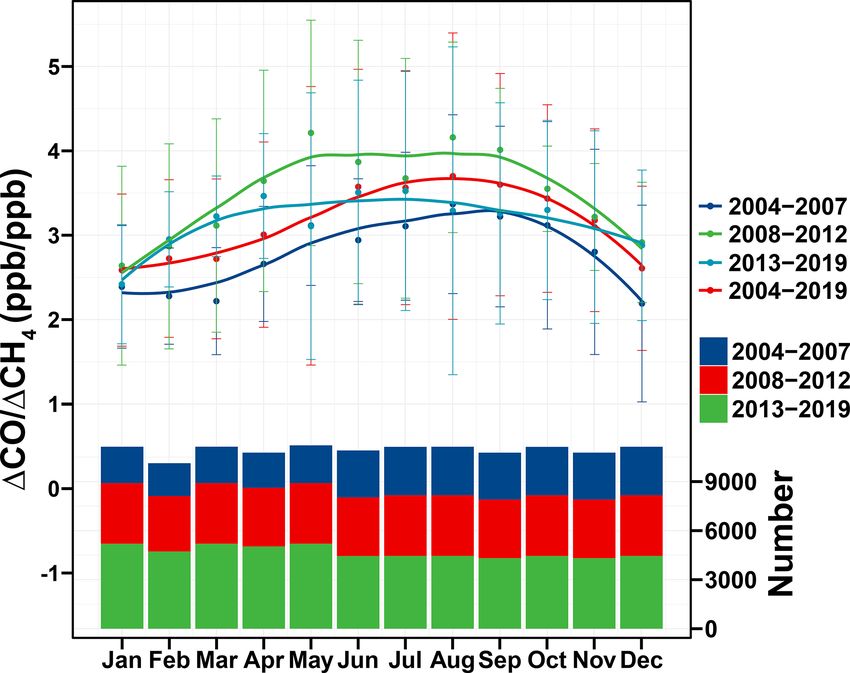
S. Liu et al.: Changing characteristics of atmospheric CH4 in the Tibetan Plateau                                                         401

Figure 5. The polar plot of the distribution of the CH4 and CO concentration probabilities in different percentile ranges at the WLG station.
The analysis was based on the conditional probability functions (CPFs) by Ashbaugh et al. (1985). The top row shows the analysis of CH4
from 1994 to 2019. The bottom row shows the CO measurements in 2004–2019. Note: ws – wind speed. The values at the bottom of each
panel show the range of concentrations in the relevant percentile range. Gradient colors represent the levels of CPF probability in different
percentile ranges.

Figure 6. Cluster analysis of the 72 h back trajectories in different seasons (spring – a; summer – b; autumn – c; winter – d) during 2004–2019
at the WLG station. The proportion of trajectories in each cluster is also marked.

https://doi.org/10.5194/acp-21-393-2021                                                        Atmos. Chem. Phys., 21, 393–413, 2021
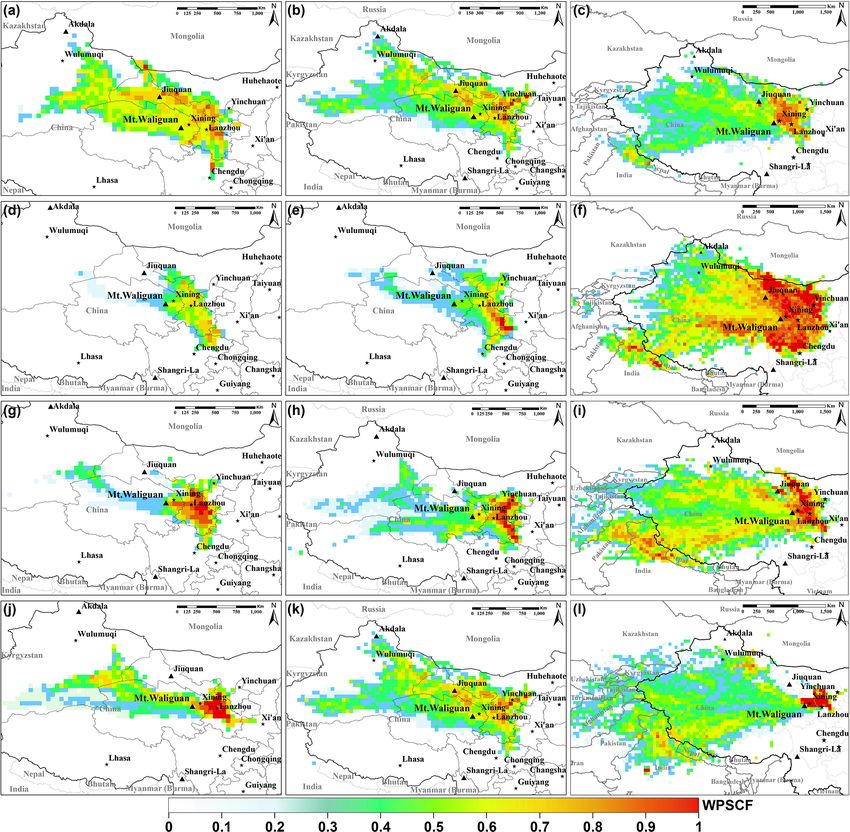
402                                           S. Liu et al.: Changing characteristics of atmospheric CH4 in the Tibetan Plateau

Figure 7. The geographical distribution of the weighted potential sources of CH4 in different periods over 2004–2019 at the WLG station. The
gradient color shows the strong levels of potential source regions in different seasons, i.e., spring (a, b, c), summer (d, e, f), autumn (g, h, i),
and winter (j, k, l) and different periods, i.e., 2004–2007 (a, d, g, j), 2008–2012 (b, e, h, k), and 2013–2019 (c, f, i, l).

source regions was increasing over time, and (ii) the location              time, which could have been attributed to the influence of hu-
of strong sources changed along with the time. For example,                 man expansion. The pattern of strong sources moving indi-
in autumn and winter, the CH4 sources were very strong in                   cated that the southwestern area relative to WLG, e.g., north-
the southeastern and northeastern regions during 2004–2007                  ern India, was gradually becoming a strong CH4 contributor.
(Fig. 7g, i) and then weakened in 2008–2012 (Fig. 7h, k).                   India, with abundant cattle and an extensive, large-scale coal
Finally, from 2013–2019 the sources almost moved to the                     mining operation possibly contributed to large amounts of
southwest with a very large distribution area (Fig. 7i, l). More            CH4 moving from northern India to the northeastern Tibetan
CH4 sources appeared at WLG along with the progression of                   Plateau (Fig. 7i, l; Fu et al., 2012). The analysis of air mass

Atmos. Chem. Phys., 21, 393–413, 2021                                                             https://doi.org/10.5194/acp-21-393-2021
S. Liu et al.: Changing characteristics of atmospheric CH4 in the Tibetan Plateau                                                         403

Table 3. The statistics for the cluster analysis result for hourly CH4
data from 2004–2019 at the WLG station. The clusters from urban
areas are highlighted in bold.

                      Cluster    Number      Average CH4
                                             mole fraction
          Spring         1          2601     1867.0 ± 1.5
                         2          1836     1882.7 ± 2.0
                         3          2678     1881.8 ± 1.4
          Summer         1          1250     1898.5 ± 2.1
                         2          1694     1899.4 ± 1.6
                         3          2310     1889.5 ± 1.6
          Autumn         1          1188     1913.1 ± 2.2
                         2          2487     1880.2 ± 1.5
                         3          2217     1887.7 ± 1.6
          Winter         1          2218     1882.9 ± 1.7
                         2           791     1920.6 ± 2.9                Figure 8. The average seasonal variation in the 1CO/1CH4 slopes
                         3          4482     1877.2 ± 1.0                during different periods during 2004–2019 at the WLG station. The
                                                                         error bars show the standard deviation of the monthly averages. The
                                                                         lines are the smoothed curve of the averages using the method of
                                                                         local polynomial regression fitting (loess). The vertical bars are the
transport (Fig. 6d) also supported the conclusions that the air          monthly numbers of data in different periods.
masses from the southwestern regions contributed the highest
CH4 mole fractions. The studies of atmospheric Hg at WLG
by Fu et al. (2012) also supported this phenomenon, which                (Fig. S5), which implied different strong source distributions
found the long-range transport of atmospheric Hg from India              between CH4 and CO. In the summer, the source emissions
to the northeastern Tibetan Plateau.                                     were mainly from the eastern–southeastern regions (cities)
                                                                         with large amounts of CO but relatively lower CH4 , leading
3.5   Correlation analysis between CH4 and CO                            to the largest 1CO/1CH4 . In contrast, the sources mostly
                                                                         from southwestern–western regions (Tibetan Plateau) emit-
Because parts of the CH4 and CO in atmosphere were from                  ted large amounts of CH4 but with relatively lower CO in the
the same anthropogenic sources (e.g., fossil fuel combus-                winter (Fang et al., 2013; Zhang et al., 2013). Hence, the op-
tion), the long-term trend of 1CO/1CH4 was helpful in un-                posite two air mass transports and source emissions led to a
derstanding the variation in the sources and sinks in many               peak in 1CO/1CH4 in the summer and a trough in the win-
studies (Buchholz et al., 2016; Niwa et al., 2014; Tohjima et            ter (Fig. 8). These results revealed different local sources and
al., 2014; Wada et al., 2011). In this study, the hourly CO              sinks, demonstrating the special topography conditions and
data from 2004 to 2019 was used to further analyze the long-             source distributions around WLG.
term variations in CH4 (Fig. S3). The regression slopes of                  The 1CO/1CH4 slopes showed large fluctuations from
1CO/1CH4 from 2004 to 2019 were analyzed (Fig. S4).                      2004 to 2019 at WLG (Fig. 9). The slopes showed a de-
Figure 8 presents the seasonal cycles of the 1CO/1CH4                    creasing trend during 2004–2007 but then increased from
slopes. Generally, the slopes were larger in summer and                  2007–2010 and decreased again after 2010. In 2007, a large
smaller in winter during the observation period, except for              increase in 1CH4 appeared, and from 2010 to 2013, the
2004–2007 where the highest slope was in autumn. This was                1CO decreased significantly (Fig. S4). Before 2010, large air
primarily due to the effect of monsoons and air mass trans-              masses and potential source regions were identified in eastern
port. Tohjima et al. (2014) found an opposite variation at               regions (cities) with the highest CO emissions (Fig. 7 and Ta-
Hateruma Island, which showed small slope values in the                  ble 3). After 2010, the southwestern regions had the highest
summer. Wada et al. (2011) analyzed more than 10 years of                CH4 emissions but relatively low CO emissions. Therefore,
seasonal variation in the 1CO/1CH4 ratios at three moni-                 the strong seasonal variation in 1CO/1CH4 also revealed
toring stations, i.e., MNM, Yonagunijima (YON), and Ryori                that WLG was affected by different anthropogenic sources,
(RYO) in Japan, which also showed an opposite trend to that              e.g., sources from cities and sources from the Tibetan Plateau
of WLG. This was because these sites were considerably af-               during the year, especially in the summer and winter. The
fected by the Asian continental source regions which had en-             long-term trend of the slopes implied that the source emis-
hanced emissions of CH4 in the summer (rice paddies) and                 sion types (CO sources or CH4 sources) around WLG might
CO in the winter (fuel combustion). At WLG, regional polar-              have been changing with human activities, like straw burning
ization in the concentration ratios of CH4 and CO were seen              in the early years or coal mining in recent years.

https://doi.org/10.5194/acp-21-393-2021                                                       Atmos. Chem. Phys., 21, 393–413, 2021
404 S. Liu et al.: Changing characteristics of atmospheric CH4 in the Tibetan Plateau
Figure 9. The long-term trend of 1CO/1CH4 slopes over 2004–2019 at the WLG station. The lines are the smoothed curve of the averages
using the method of local polynomial regression fitting (loess).
3.6 Variation of long-term records rine boundary layer (MBL) from the NOAA/ESRL labora-
tory at a similar latitude (Dlugokencky et al., 2019b). It was
3.6.1 Seasonal cycles seen that the stations in the Northern Hemisphere and at
the MBL showed an opposite trend to WLG, with the mini-
Overall, the seasonal averages of regionally representative mum being in summer and maximum in the winter or spring
CH4 at WLG were almost in a cycle, starting with summer (Fig. 11). The peak in the summer at WLG was attributed
(1861.7 ± 0.4 ppb), then winter (1856.7 ± 0.3 ppb), autumn to larger grazing, human activities, ruminants, and easterly
(1855.9±0.4 ppb), and spring (1853.1±0.3 ppb), except dur- winds coming from neighboring areas over other seasons.
ing 1994–1997 where there was a maximum in the winter The CH4 emissions from yaks and other ruminants in the
and a minimum in the autumn (Fig. 10). Seasonal averages Tibetan Plateau (alpine pasture) were very strong in the sum-
in the CRs were slightly different from those in the TP and mer, preceded only by paddy emissions (Fang et al., 2013;
even the total regional data. The seasonal averages in the TP Zhang et al., 2013). Furthermore, the dynamic transport by
were mostly higher than that in the CRs from 1994 to 2019, airflow from the polluted northeastern or southeastern region
except for the winter (Table S2). The maximum mole frac- was also strong in summer, which all induced high CH4 mole
tions were mostly found in August, and the minimum mole fractions and, consequently, an opposite trend to other sites
fraction appeared in April for the total regional time series, (Ma et al., 2002; Xiong et al., 2009).
with a seasonal amplitude of 14.4 ppb. The peak-to-trough The seasonal amplitude at WLG (∼ 14 ppb) was signif-
amplitude in the CRs (∼ 16.7 ppb) was higher than that in icantly lower than many other sites in the Northern Hemi-
the TP (∼ 15.1 ppb) during 1994–2019. The seasonal vari- sphere by about 35–70 ppb. Such sites included MLO in
ations were consistent with the previous short-term studies North America, BRW in the North Pole, UUM in Mongo-
from 2002–2006 at WLG (Zhang et al., 2013). However, lia, TAP in South Korea, Ny-Ålesund in Norway, Bialystok
these variations were almost opposite to observations at the in Poland, Ochsenkopf in Germany, and Beromunster in
adjacent stations of Lin’an, Shangdianzi, and Longfengshan Switzerland (Dlugokencky et al., 1995; Kim et al., 2015; Mo-
in China (Fang et al., 2013, 2016). For other regional sites rimoto et al., 2017; Thompson et al., 2009; Popa et al., 2010;
in the Asia, Guha et al. (2018) studied seasonal variability Satar et al., 2016). The MBL also showed a larger ampli-
at the Sinhagad (SNG) and Cape Rama stations (CRI) over tude than WLG (Fig. 11). The study at the SNG and CRI
India, which also showed an opposite trend to WLG due to over India showed a much larger amplitude close to 200 ppb
the strong impact of monsoon dynamics. Ahmed et al. (2015) (Guha et al., 2018). The low amplitude at WLG was because
found that the seasonal CH4 showed a maximum in the win- of the high elevation of the continental mountain sites, where
ter and a minimum in the spring at two urban sites of Guro there were relatively fewer effects from local influences than
(GR) and Nowon (NW), in Seoul, South Korea, over 2004– at the coastal and island sites (Yuan et al., 2019). Addition-
2013. Kim et al. (2015) investigated the decadal variation ally, the seasonal amplitudes indicated different trends be-
(1991–2013) in CH4 at the East Asian sites, e.g., Ulaan-Uul tween the CRs and TP. For the CRs, the seasonal amplitude
(UUM) in Mongolia and Tae-ahn Peninsula (TAP) in South decreased at first and then increased over time, which was
Korea, which again revealed an opposite seasonal trend to similar to the variation in the total regional events. But, for
that of WLG. the TP, the amplitude had a continuously increasing trend,
The data were further compared with similar WMO/GAW with values of 15.1, 18.1, 21.4, 20.4, and 23.7 ppb in 1994–
global stations in the Northern Hemisphere, including 1997, 1998–2002, 2003–2007, 2008–2012, and 2013–2019,
MLO (19.54◦ N, −155.58◦ E, 3397 m a.s.l.; Dlugokencky et respectively. This revealed that the Tibetan Plateau was in-
al., 1995, 2019a), JFJ (46.55◦ N, 7.99◦ E, 3580 m a.s.l.; Zell- tensively affected by strong regional sources (e.g., grazing or
weger et al., 2016), MNM (24.29◦ N, 153.98◦ E, 7.1 m a.s.l.; emissions from India) over time.
Matsueda et al., 2004; Tsutsumi et al., 2006), and the ma-
Atmos. Chem. Phys., 21, 393–413, 2021 https://doi.org/10.5194/acp-21-393-2021S. Liu et al.: Changing characteristics of atmospheric CH4 in the Tibetan Plateau 405
Figure 10. Monthly variations in regional CH4 mole fractions from 1994 to 2019 at WLG station. CR, TP, and total represent the measure-
ments from the city region, the Tibetan Plateau, and the total regional records, respectively. The box shows the 25th percentile, the median,
and the 75th percentile from bottom to top. The bottom and the top whiskers, respectively, reach the minimum and 1.5 times the interquartile
range (IQR). The black points are identified as outliers. The red squares are the averages. The cyan lines are the smoothed curve of the
averages using the method of local polynomial regression fitting (loess). The gray bands are the 95 % confidence interval of smoothed curve.
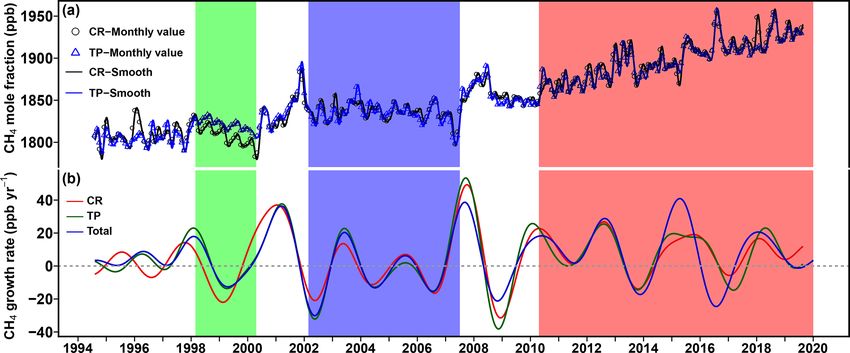
3.6.2 Long-term trend very small or even negative at WLG. Subsequently, a steady
period with near-zero growth rates was found during 2002–
2006. However, the atmospheric CH4 increased significantly
The fluctuating trend in atmospheric CH4 during 1994–2019
after 2007 (Fig. 12a). In 1997–1998, 2000–2001, 2007–
at WLG (Fig. 12) was similar to the global trend reported by
2008, and 2011–2012, a large fluctuation in the growth rates
many studies (Bergamaschi et al., 2013; Rigby et al., 2017;
was found, and a strong growth appeared (Fig. 12b). The
Nisbet et al., 2019). In the 1990s, the CH4 growth rates were
https://doi.org/10.5194/acp-21-393-2021 Atmos. Chem. Phys., 21, 393–413, 2021406 S. Liu et al.: Changing characteristics of atmospheric CH4 in the Tibetan Plateau
riod (Dlugokencky et al., 1998; Rigby et al., 2017; Turner
et al., 2017). However, the growth rates were high in 1998
(Fig. 12b), which may have been due to the high temper-
atures and a large amount of biomass burning (Cunnold et
al., 2002; Lelieveld et al., 2004; Simmonds et al., 2005). The
growth rate of CH4 observed at Ny-Ålesund, Norway, in-
creased from 0.3 ± 0.2 ppb yr−1 during 2000–2005 to 5.5 ±
0.2 ppb yr−1 during 2005–2014, which had a similar varia-
tion but with a slightly lower growth rates than that of WLG
(Morimoto et al., 2017). The study suggested that the tem-
poral pause in 2000–2005 was ascribed to the reductions in
Figure 11. The seasonal cycles of atmospheric CH4 observed at CH4 emissions from the microbial and fossil fuel sectors,
the WMO/GAW global stations of Mauna Loa (MLO; 1994–2018), while the increase in 2005–2014 was due to an increase in
Jungfraujoch (JFJ; 2005–2018), Minamitorishima (MNM; 1994– microbial release.
2019), and Mt. Waliguan (WLG; 1994–2019) in the Northern Hemi-
The constantly larger CH4 growth rate after 2007 at
sphere. The data of other sites (except WLG) are from the World
Data Centre for Greenhouse Gases (WDCGG). The data in the ma-
WLG (Fig. 12; Table 4) was similar to the recent stud-
rine boundary layer (MBL; 1994–2019) are from NOAA/ESRL lab- ies by Nisbet et al. (2016, 2019), which showed that the
oratory at a similar latitude to WLG. global CH4 increased by 5.7 ± 1.2 ppb yr−1 in 2007–2014
and was much higher at 12.7 ± 0.5 ppb yr−1 in 2014, with
10.1 ± 0.7 ppb yr−1 in 2015, 7.0 ± 0.7 ppb yr−1 in 2016, and
7.7 ± 0.7 ppb yr−1 in 2017. The average growth rate in the
growth rates fluctuated evenly with both positive and neg- Northern Hemisphere was 7.3 ± 1.3 ppb in 2007 and 8.1 ±
ative values before 2009. However, almost all of the growth 1.6 ppb in 2008 (Dlugokencky et al., 2009), which was also
rates showed a positive value after 2009. Three developing similar to the observation at WLG (Table 4). After 2007,
stages (i.e., highlighted green, blue, and red blocks in Fig. 12) most sites in the Northern Hemisphere had large CH4 growth
could be seen from the 1990s to 2010s. The CH4 mole frac- rates. Also, the average global growth rate was similar to
tion slightly decreased during 1998–2000 (green coloring), WLG at 7.1 ppb yr−1 in the most recent 10 years (WMO,
then went through a relatively steady period during 2003– 2019). Fang et al. (2013) showed that the annul growth rate
2006 (blue coloring), and finally increased rapidly after 2007 of CH4 was 9.4±0.2 ppb yr−1 in 2009–2011 at WLG, which
(red coloring; Fig. 12). was a little higher than this study in 2008–2012. The adjacent
The annual growth rate was 5.1 ± 0.1 ppb yr−1 throughout stations in China also revealed the high CH4 growth rates of
1994–2019 at WLG (Table 4). The periodic annual growth 8.0±1.2 ppb yr−1 at Lin’an in 2009–2011, 7.9±0.9 ppb yr−1
rates were 4.9 ± 0.1, 2.5 ± 0.2, 4.9 ± 0.1, 7.7 ± 0.1, and 5.5 ± at Longfengshan in 2009–2011, and 10 ± 0.1 ppb yr−1 at
0.1 ppb yr−1 during 1994–1997, 1998–2002, 2003–2007, Shangdianzi in 2009–2013 (Fang et al., 2013, 2016), which
2008–2012, and 2013–2019, respectively. Similar growth were all higher than the similar periods of 2008–2012 or
rates were found between the CRs and the TP during 1994– 2013–2019 at WLG (Table 4). The CH4 measurements in
2019 (Fig. S6). In 1994–1997 and 2003–2007, the growth other countries, such as the Beromünster tall tower station,
rates in the TP were even larger than that in the CRs (Ta- also showed a high growth rate of 9.66 ppb yr−1 in 2012–
ble 4). These results indicated that there were also strong 2014 (Satar et al., 2016). The warm temperatures, biomass
CH4 sources from the TP. A previous study by Zhou et burning, and climatic anomalies (El Niño or La Niña) likely
al. (2004) showed the annual increase in CH4 by 4.5 ppb yr−1 enhanced the CH4 emissions after 2007 (Dlugokencky et
in 1992–2001, which was close to our study in 1994–1997 al., 2009). The anomalous years of increasing or decreas-
and 1998–2002. Tohjima et al. (2002) found that the CH4 ing (e.g., 2007–2008) might have had a significant influence
levels at the Cape Ochiishi and Hateruma island in 1995– on the overall CH4 trend (Fig. 12). These frequent anoma-
2000, respectively, increased by 4.5 and 4.7 ppb yr−1 , which lies also appeared in most long-term observation stations,
were also similar to that of WLG. Tsutsumi et al. (2006) an- e.g., MLO in the USA (Dlugokencky et al., 2009) and the
alyzed the trend of hourly CH4 data from 1998 to 2004 on Zugspitze mountain in Germany (Yuan et al., 2019), due
the YON, which showed a similar increase (∼ 3.0 ppb yr−1 ) to climatic forces such as those exceptions during the El
to WLG. The study at the GR and NW in Seoul, South Ko- Niño oscillation, i.e., forest fires, volcanic eruptions, and ex-
rea, presented almost an identical trend of 2 ppb yr−1 be- treme weather events (Keeling et al., 1995; Dlugokencky et
tween 2004 and 2013 (Ahmed et al., 2015), which was lower al., 2009; Keenan et al., 2016; Nisbet et al., 2019).
than that of WLG in similar period. In the early 1990s, the Many studies have investigated the potential reasons for
CH4 growth rates at WLG were very low and similar to the the anomalous increase. The study by Satar et al. (2016)
q
global level. The level of OH radicals might control the de- at Beromünster, Switzerland, explained that the short-term
crease or increase in CH4 in the atmosphere during this pe- spikes were possibly related to emissions from agricultural
Atmos. Chem. Phys., 21, 393–413, 2021 https://doi.org/10.5194/acp-21-393-2021You can also read