Measurement Report: Lidar measurements of stratospheric aerosol following the 2019 Raikoke and Ulawun volcanic eruptions
←
→
Page content transcription
If your browser does not render page correctly, please read the page content below
Atmos. Chem. Phys., 21, 5597–5604, 2021
https://doi.org/10.5194/acp-21-5597-2021
© Author(s) 2021. This work is distributed under
the Creative Commons Attribution 4.0 License.

Measurement Report: Lidar measurements of stratospheric aerosol
following the 2019 Raikoke and Ulawun volcanic eruptions
Geraint Vaughan1 , David Wareing2 , and Hugo Ricketts1
1 National   Centre for Atmospheric Science, University of Manchester, Manchester, UK
2 Aberystwyth   University, Aberystwyth, UK

Correspondence: Geraint Vaughan (geraint.vaughan@ncas.ac.uk)

Received: 21 September 2020 – Discussion started: 12 October 2020
Revised: 15 February 2021 – Accepted: 15 February 2021 – Published: 12 April 2021

Abstract. At 18:00 UTC on 21 June 2019 the Raikoke vol-           1   Introduction
cano in the Kuril islands began a large-magnitude explosive
eruption, sending a plume of ash and sulfur dioxide into the
stratosphere. A Raman lidar system at Capel Dewi Atmo-            From 18:05 UTC on 21 June 2019 to 05:40 UTC on
spheric Observatory, UK, was deployed to measure the ver-         22 June the Raikoke volcano in the Kuril Islands (48.29◦ N,
tical extent and optical depth of the volcanic aerosol cloud      153.25◦ E) erupted, sending plumes of ash and sulfur diox-
following the eruption. The elastic channel at 355 nm al-         ide into the stratosphere (Crafford and Venzke, 2019). With
lowed measurements up to 25 km, but the Raman channel             an estimated 1.5 ± 0.2 Tg of SO2 (de Leeuw et al., 2020),
was only sensitive to the troposphere. Therefore, retrievals      it was one of the largest injections of volcanic aerosol into
of backscatter ratio profiles from the raw backscatter mea-       the stratosphere since the Pinatubo eruption in 1991 and cre-
surements required aerosol-free profiles derived from nearby      ated vivid sunsets around the Northern Hemisphere (Fox,
radiosondes and allowance for aerosol extinction using a li-      2019). Sulfur dioxide was measured from 11 to 20 km by the
dar ratio of 40–50 sr. Small amounts of aerosol were mea-         TROPOMI instrument on the Sentinel-5 satellite on 24 June,
sured prior to the arrival of the volcanic cloud (27 June–        with ash detected by the CALIOP spaceborne lidar on the
5 July 2019), from pyroconvection over Canada. Model sim-         CALIPSO satellite at 17 km on 22 June and around 13 km on
ulations by de Leeuw et al. (2020) and Kloss et al. (2020)        23 and 24 June (Hedelt et al., 2019). The ash however was
show that volcanic ash may have reached Europe from 1 July        quickly dispersed or sedimented from the stratosphere in the
onwards and was certainly present over the UK after 10 July.      week following the eruption, leaving the cloud of SO2 to ox-
The lidar detected a thin layer at an altitude of 14 km late on   idise to sulfuric acid and spread around the hemisphere in
3 July, with the first detection of the main aerosol cloud on     aerosol form. Maximum average stratospheric aerosol optical
13 July. In this initial period the aerosol was confined below    depths at 449 nm (derived from SAGE-III/ISS data) reached
16 km, but eventually the cloud extended to 20.5 km. A sus-       0.045 north of 55◦ N and 0.030 between 40 and 55◦ N in the
tained period of clearly enhanced stratospheric aerosol op-       early months after the eruption (Kloss et al., 2020).
tical depths began in early August, with a maximum value             Lidar measurements from Hawaii measured a layer of
(at 355 nm) around 0.05 in mid-August and remaining above         aerosol around 1 km thick at 26 km on 24 September 2019
0.02 until early November. Thereafter, optical depths de-         (Chouza et al., 2020); these authors also found using
cayed to around 0.01 by the end of 2019 and remained around       CALIOP data that the layer had ascended from around 19 km
that level until May 2020. The altitude of peak backscatter       in the previous 2 months. During the months following the
varied considerably (between 14 and 18 km) but was gen-           initial eruption the aerosol evolved in height, depth and opti-
erally around 15 km. However, on one notable occasion on          cal thickness (Kloss et al., 2020). It also merged with aerosol
25 August 2019, a layer around 300 m thick with peak lidar        from the smaller eruptions of Ulawun in Papua New Guinea
backscatter ratio around 1.5 was observed as high as 21 km.       (5.05◦ S, 151.3◦ E) that occurred on 26 June and 3–4 Au-
                                                                  gust 2019, which reached 19 km altitude and injected around

Published by Copernicus Publications on behalf of the European Geosciences Union.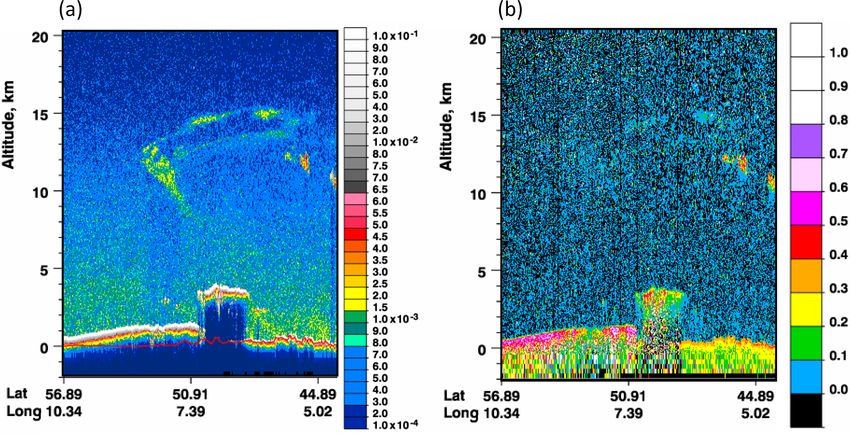
5598                                                                G. Vaughan et al.: Lidar measurements of Raikoke aerosol

0.14 and 0.2 Tg SO2 respectively into the stratosphere (Kloss        ular backscatter profile, which was fitted to the elastic sig-
et al., 2020).                                                       nal above the aerosol layer on that night (usually above
   Lidar measurements of the volcanic aerosol cloud at 355           ∼ 20 km). An onion-peeling retrieval with prescribed lidar
and 532 nm from four Russian stations were presented for             ratio (ratio of aerosol extinction to backscatter coefficient)
the second half of 2019 by Grebennikov et al. (2020). These          was then used to derive the lidar backscatter ratio down to
stations ranged in longitude from Obninsk at 36.6◦ E to              the upper troposphere, as used in Thomas et al. (1987) and
Petropavlovsk-Kamchatsky at 158.65◦ E and observed vol-              Vaughan et al. (1994). This algorithm sequentially removed
canic aerosol from late July onwards, reaching up to 18–             the attenuation due to the aerosol, layer by layer, beginning
20 km. A maximum integrated backscatter at 532 nm above              from the aerosol-free fitting region and ending at 6 km al-
13 km of > 10−3 was found in August, corresponding to                titude. As cirrus clouds were frequently observed near the
aerosol optical depth of around 0.045.                               tropopause, the algorithm used two layers with different li-
   Measurements are presented here from a Raman lidar sys-           dar ratios: a stratospheric value above 12 km (or above the
tem based at the Capel Dewi Atmospheric Observatory, UK              cirrus layer if this was higher) and a different, usually lower
(52.4◦ N, 4.1◦ W), beginning from June 2019 and continu-             value below this height. (During the period up to 6 July, ab-
ing until the spring of 2020, showing how the aerosol cloud          sorbing aerosol was found near the tropopause, necessitating
evolved over the lidar site. All the measurements were taken         a larger value of lidar ratio; see Sect. 4.)
during the hours of darkness when there was no cloud cover              For volcanic aerosol clouds from very-large-magnitude
over the site; in all there were 34 nights of measurements           eruptions (e.g. Pinatubo in 1991) the lidar ratio is vari-
between 27 June 2019 and 30 May 2020.                                able, for example due to variations in the size distribution
                                                                     of the sulfuric acid aerosol (e.g. Vaughan et al., 1994). For
                                                                     moderate-magnitude eruptions, Mattis et al. (2010), using
2   Method                                                           Raman lidar measurements for small volcanic plumes in
                                                                     2008–2009, found a range of values from 30 to 60 sr at
The Capel Dewi Raman lidar system (Vaughan et al., 2018)             355 nm. Ash tends to increase the lidar ratio: Lopes et al.
operates in the ultraviolet at 355 nm using a Continuum Pow-         (2019) quoted 63 ± 21 sr for the Calbuco eruption plume of
erlite 9030 laser with a pulse energy of 300 mJ and a pulse          2015, Chouza et al. (2020) quoted 64 ± 27 sr for the Nabro
repetition frequency of 30 Hz. The receiver system is usually        plume of 2011 and Hoffmann et al. (2010) quoted 63 ± 10 sr
optimised for measuring signals above 2 km and has three in-         for the Kasatochi plume of 2008. Remarkably consistent
terference filters to measure the elastic backscatter (355 nm),      though these results are, Mie scattering calculations suggest
nitrogen Raman scattering (387 nm) and water vapour scat-            that the lidar ratio depends strongly on particle size as well as
tering (408 nm). Photon-counting electronics are used with           composition (Korshunov and Zubachev, 2013) and therefore
range gates of 100 ns, providing a range resolution of 15 m.         varies from eruption to eruption.
To enhance sensitivity in the elastic channel, a neutral density        For nights when the volcanic aerosol plume formed a dis-
filter was removed, which extended the measurement range             tinct layer, and there was no cirrus cloud in the troposphere,
to around 25 km in the lower stratosphere, but raising the           an appropriate value of lidar ratio could be found by requir-
lower limit to around 7 km.                                          ing that the backscatter return to the molecular profile below
    Raw data were collected with a time resolution of 10 min         the layer. For most of the period of this study this resulted
on most nights, and the files were combined to whole-night           in values around 40 sr, which has been adopted for most of
averages for further analysis. Filters were applied during av-       the dataset for consistency. A cross-check on the lidar ratio
eraging to remove files affected by low cloud to guard against       was provided on a few nights where enough profiles could
signal-induced noise problems. Analysis proceeded by con-            be combined to yield a useful signal on the Raman channel.
verting the elastic signal profiles to lidar backscatter ratios –    This allowed an independent measure of the optical depth of
the ratio of the total backscatter profile to that which would       the stratospheric aerosol layer, further discussed below.
be returned by a pure molecular atmosphere. The optimum                 One of the characteristics of the Capel Dewi lidar is that
way to accomplish this is to use data from the N2 Raman              its receiver is only sensitive to signals whose polarisation
channel, as in Vaughan et al. (2018), as this automatically al-      is parallel to that of the incident laser beam. Thus, when
lows for attenuation of the signals by the aerosol layer. How-       non-spherical particles are present, the backscatter ratio is
ever, the faint signals on the N2 Raman channel in the lower         underestimated and the effective lidar ratio becomes artifi-
stratosphere meant that long runs of data had to be combined         cially large. Nonetheless, the optical depth derived for these
to accumulate enough signal for analysis. This was only pos-         cases should be correct, as the two errors compensate for
sible for a few nights during the period under consideration         each other.
here.
    Therefore, for each night of measurement, a density pro-
file from a nearby radiosonde ascent (chosen using the
wind direction at 200 mb) was used to construct a molec-

Atmos. Chem. Phys., 21, 5597–5604, 2021                                                https://doi.org/10.5194/acp-21-5597-2021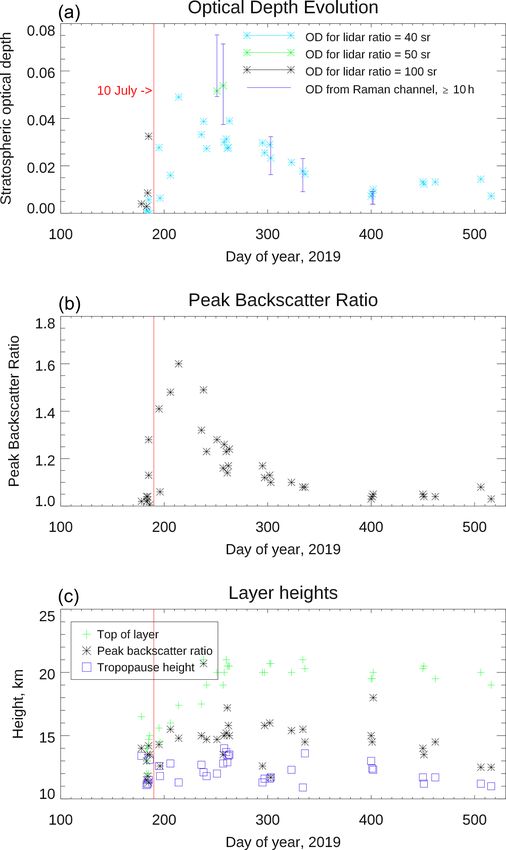
G. Vaughan et al.: Lidar measurements of Raikoke aerosol 5599
using the UK Met Office’s NAME dispersion model. This
model is based on the global winds from the Met Office
Unified Model analyses and includes chemical reactions for
converting SO2 to sulfate, as well as mixing through tur-
bulence and subgrid-scale dynamics. Its simulations of SO2
were found to agree well with the TROPOMI satellite for the
3 weeks after the eruption. de Leeuw et al. (2020) provide
video files of model simulations as supplements to their pa-
per, one of which shows the spread of volcanic aerosol across
the Northern Hemisphere after the eruption. Up to the end of
June the cloud was confined to North America and eastern
Asia. Between 1 and 4 July there are hints that small amounts
of aerosol were reaching Europe, with a more prominent fil-
ament reaching Scotland by 7 July. The main aerosol cloud
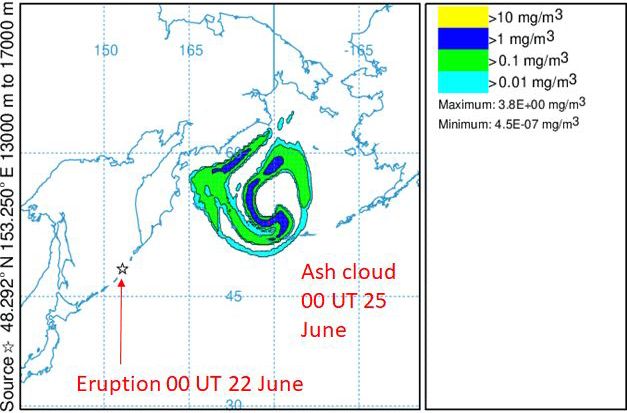
Figure 1. Dispersion of the volcanic ash cloud according to the in this simulation reached the southern UK on 10 July. These
HYSPLIT model 72 h after the eruption. The model was initialised conclusions are consistent with the CLAMS model simula-
with a uniform ash injection between 13 and 17 km. Mass loadings tions presented by Kloss et al. (2020) (their Fig. 5), suggest-
are arbitrary and serve only to delineate the position of the cloud. ing that lidar observations over Europe might detect volcanic
aerosol from 1 July onwards and would definitely do so af-
ter 10 July. The analysis of OMPS satellite data by Kloss
3 The Raikoke eruption et al. (2020) showed small amounts of stratospheric aerosol
over Europe between 24 June and 6 July 2019 (their Fig. 3b),
Following the eruption of the Raikoke volcano on 21– which they attribute using CLAMS modelling calculations to
22 June 2019, the ash and sulfur dioxide plume initially plumes from pyroconvection in Alberta.
moved eastward before being entrained in a cyclonic circu- We now turn to the lidar measurements at Capel Dewi and
lation over the North Pacific. The on-line NOAA HYSPLIT the arrival of the volcanic cloud in Europe.
model (Stein et al., 2015) provides a tool for estimating the
dispersion of a volcanic plume, and Fig. 1 shows the sim-
ulated ash cloud 72 h after the eruption, confined to a re- 4 Results
gion between Kamchatka and Alaska. Profiles from CALIOP
(available from https://www-calipso.larc.nasa.gov/products/ Lidar profiles at the end of June and the first few days of
lidar/browse_images/std_v4_index.php, last access: 26 Au- July 2019 showed numerous small aerosol layers in the lower
gust 2020) confirm the location of the ash plume at this stratosphere, consistent with the OMPS observations. An ex-
time, along an orbit between 56◦ N, 177.8◦ E and 61.5◦ N, ample, from the night of 1–2 July, is shown in Fig. 3a. Two
173.5◦ E, at an altitude of 12–14 km. aerosol layers are shown in this figure – one around 12 km,
CALIOP profiles in the period 25–28 June show that the just above the tropopause, which seems from its optical prop-
volcanic ash stayed broadly in the same region, becoming erties to have been smoke (a lidar ratio of 100 sr was needed
thin, patchy and generally confined below 15 km. The de- to account for the attenuation of the laser beam through the
polarisation ratio at 532 nm decreased from 30 %–40 % on layer) and another between 13 and 14 km where a lidar ratio
25 June to below 20 % by 28 June. HYSPLIT trajectory cal- of 40 sr sufficed. A CALIPSO orbit around 3◦ east of the li-
culations (Fig. 2) are consistent with the observations, sug- dar at 02:50 UT on 2 July measured an aerosol layer around
gesting little transport of material from the cyclonic circula- 12–13 km between 53.7 and 55.5◦ N with a depolarisation ra-
tion until the end of June; they are remarkably non-dispersive tio of 10 %–20 %, confirming the presence of non-spherical
for 8 d trajectories. A further set of HYSPLIT trajectories particles in the lower layer, but showing no trace of the upper
(not shown), initialised from the end points of those in Fig. 2, layer. The CALIPSO aerosol subtype algorithm (Kim et al.,
suggested the plume was confined until around 6 July, but 2018) identified this as Type 10 (sulfate/other), which gives
these trajectories were more dispersive and cannot rule out little clue to its identity.
a certain amount of transport westward in the first week of A much more prominent aerosol layer was measured 2 d
July. later (Fig. 3b); the maximum backscatter ratio was now
The HYSPLIT model calculates air parcel trajectories 1.3 rather than 1.09 on 1 July. Again there are two layers,
based on 3-D advection by winds from an operational anal- with the lower one more variable and more absorbing than
ysis model, and its predictions become increasingly sensi- the upper one. Both probably consisted of depolarising par-
tive to initial conditions as time goes on (e.g. Vaughan et al., ticles: CALIOP measured patches of depolarising aerosol
2018). An alternative approach to simulating the spread of (δv ≈ 0.1–0.2) at 52.0◦ N, 4.4◦ E, at both 11 and 14 km, at
the aerosol cloud was presented by de Leeuw et al. (2020), 02:20 UT on 4 July (Fig. 4). The aerosol subtype algorithm
https://doi.org/10.5194/acp-21-5597-2021 Atmos. Chem. Phys., 21, 5597–5604, 2021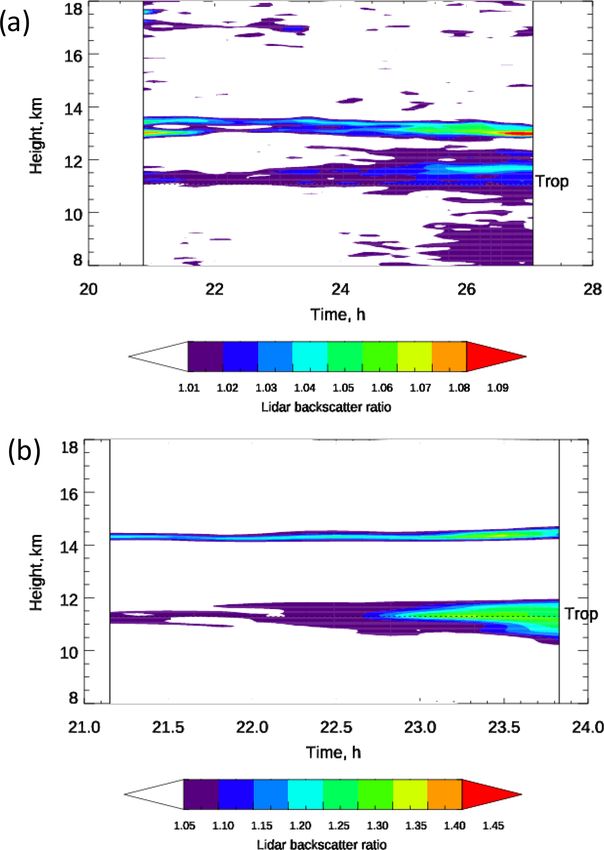
5600 G. Vaughan et al.: Lidar measurements of Raikoke aerosol
Figure 2. The 8 d forward trajectories from nine points surrounding Raikoke, calculated using HYSPLIT and initialised at 18:00 UT,
21 June 2019, at three lower stratospheric heights.
gave Type 10 for the lower layer around 52◦ N. The aerosol in
Fig. 3 is therefore most likely due to pyroconvection, but it is
not possible to rule out a contribution from volcanic aerosol
over Europe at this time. To emphasise the patchy nature of
the observations in early July, there was no aerosol above
the tropopause on the following night (4–5 July) and only
a faint layer on 5–6 July (12–14 km, maximum backscatter
ratio 1.03).
Consistent with the simulations of de Leeuw et al. (2020)
and Kloss et al. (2020), the first unambiguous measure-
ment of the volcanic aerosol cloud was on the night of 13–
14 July (Fig. 5a), when a prominent layer of aerosol with a
peak backscatter ratio of 1.4 was detected between 12.5 and
15 km. The figure shows the whole-night average (21:30–
03:30 UTC); individual profiles showed multiple thin lay-
ers 200–300 m thick lasting about an hour (corresponding to
around 60 km in length with the wind speed of 18 m s−1 mea-
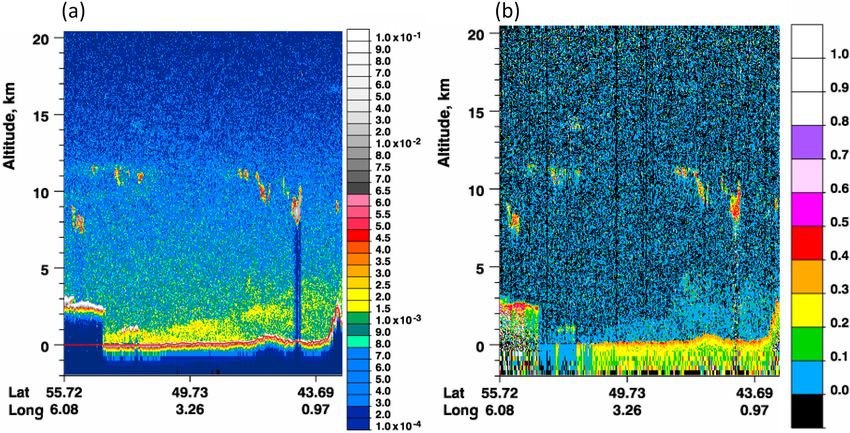
sured by the sonde at 14 km). A CALIOP orbit passing to the
east of the UK on this night measured stratospheric aerosol
up to 15 km (Fig. 6), with very little depolarisation north of
47◦ N. This indicates that the aerosol consisted of spherical
sulfuric acid droplets by this time, with little or no ash.
Measurements after 13 July are consistent with the con-
tinued presence of spherical sulfuric acid aerosol over the
lidar site. The actual profiles were variable during the first
2–3 months after the eruption, with multiple layers in the
height range 12–20 km. A notable example is shown in
Fig. 5b, taken between 20:37 and 21:47 UTC on 25 August.
This has a very prominent layer at 21 km – reminiscent of
that seen by Chouza et al. (2020) at 26 km over Hawaii on
24 September, which they tracked back to the Kamchatka
region. Although CALIOP profiles around 25–26 August Figure 3. Lidar backscatter ratio at 355 nm measured at Capel Dewi
showed numerous thin (< 1 km) aerosol layers below 19 km, during the nights of (a) 1 July and (b) 3 July 2019. Dotted black line
they showed nothing above 20 km in the vicinity of the UK. denotes the tropopause height from the radiosonde at Valentia Ob-
The wind speed at 21 km according to the Herstmonceux ra- servatory, Ireland (51.93◦ N, 10.25◦ W). Note the different colour
scale on the two panels.
diosonde at 00:00 UTC on 26 August was 5 m s−1 , so the
layer in Fig. 5b could have been as small as 24 km in horizon-
Atmos. Chem. Phys., 21, 5597–5604, 2021 https://doi.org/10.5194/acp-21-5597-2021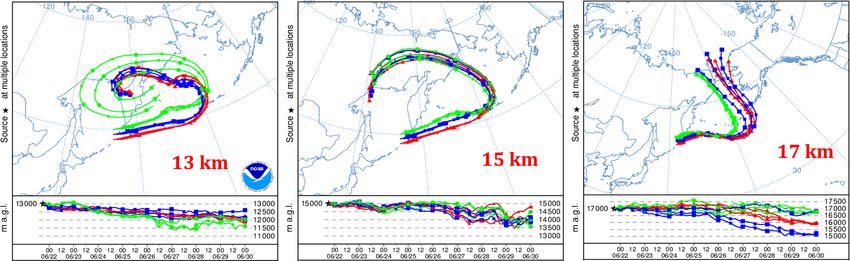
G. Vaughan et al.: Lidar measurements of Raikoke aerosol                                                                       5601

Figure 4. CALIOP lidar measurements along an orbit over central England between 02:14 and 02:17 UTC on 4 July 2019.
(a) Total attenuated backscatter at 532 nm, in sr−1 km−1 ; (b) depolarisation ratio. Image courtesy of NASA, https://www-
calipso.larc.nasa.gov/products/lidar/browse_images/std_v4_showdate.php?browse_date=2019-07-04 (last access: 31 January 2021).

tal extent, perhaps explaining why CALIOP did not observe           nights clear enough to collect sufficient counts. In this anal-
it. We note that Kloss et al. (2020) report OMPS satellite          ysis, an aerosol-free lidar profile was calculated from the
measurements reaching up to 22 km in the month after the            radiosonde data and fitted to the Raman channel above the
eruption, which is consistent with this observation.                aerosol layer; the optical depth could then be derived from
   For consistency in the analysis from 13 July onwards, a          the ratio of the two profiles at 12 km. Even with long nights
lidar ratio of 40 sr was adopted, except for two nights (7 and      of data (and in the case of 4–6 February 2020, two nights
13 September) when a value of 50 sr was needed to return the        of combined data), the precision error bars on these esti-
backscatter ratio to 1 in the troposphere, where the Raman          mates are large – but they are consistent with the estimates
measurements indicated no aerosol. For non-depolarising             from the elastic channel, justifying the choice of lidar ratio.
aerosol, this is the actual value of the lidar ratio, which falls   In contrast to the Raman estimates, where the precision er-
within the range of 30–60 sr reported by Mattis et al. (2010).      ror dominates, errors on the optical depth estimates from the
   Figure 7a shows the evolution of the aerosol optical depth       elastic channel are dominated by the systematic uncertainty
(AOD) above 12 km between 27 June 2019 and 30 May 2020              in the lidar ratio, since the precision errors are very small
as measured by the Capel Dewi lidar. The optical depths             (and not plotted on the figure). For this reason, many lidar
reached around 0.05 by mid-August 2019, declining slowly            groups prefer to present their results as integrated backscatter
for the remainder of the autumn, which is consistent with the       (e.g. Trickl et al., 2013; Zuev et al., 2017; Grebennikov et al.,
results of Grebennikov et al. (2020) at 532 nm. An analysis         2020), which does not depend directly on lidar ratio. Here
of stratospheric AOD (sAOD) from the SAGE-III/ISS and               we present the results as optical depth for comparison with
TROPOMI satellites was presented by Kloss et al. (2020).            the Raman measurements and because it is a more gener-
They show that the average sAOD from 55 to 70◦ N mea-               ally useful quantity. The uncertainty may be estimated from
sured by SAGE-III reached a maximum of 0.045 at 449 nm,             the range of lidar ratios used in our analysis of the volcanic
falling to 0.030 at 1020 nm with an overall Ångström expo-          aerosol cases: 40–50 sr. This implies an uncertainty of 20 %–
nent of 1.2. Corresponding sAOD values of 0.03 and 0.02             25 % in the optical depth measurements. Other than the two
were measured for the latitude belt 40 to 55◦ N. TROPOMI            points marked on the figure, where the use of 50 sr best fit the
sAODs at 675 nm were about 10 % lower than SAGE-III                 data (i.e. returned the profile to the molecular profile in the
sAODs at 676 nm. (The corresponding maximum sAOD for                upper troposphere, where independent measurements from
Ulawun at 449 nm was 0.01 between 20◦ N and 20◦ S.) As the          the Raman channel showed no aerosol), the use of 40 sr pro-
Capel Dewi measurements are at 355 nm, a slightly higher            duced consistent analyses for the rest of the dataset, suggest-
peak sAOD of 0.050 is consistent with these other estimates.        ing that the particle size spectrum did not change substan-
   Also shown on the figure are calculations of the aerosol         tially during the period of this study (Vaughan et al., 1994).
optical depth above 12 km from the Raman channel, for               For the period 27 June–5 July 2019, when smoke aerosol was

https://doi.org/10.5194/acp-21-5597-2021                                             Atmos. Chem. Phys., 21, 5597–5604, 2021
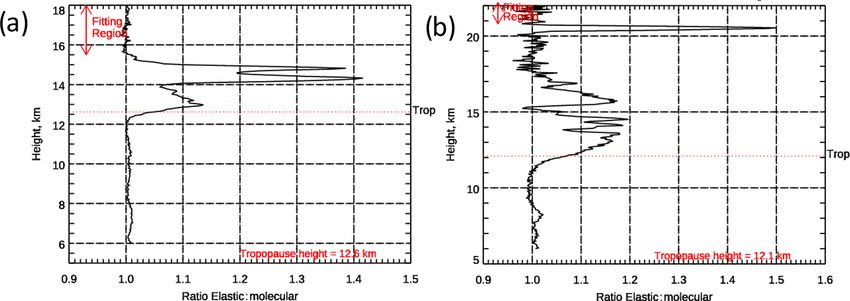
5602                                                              G. Vaughan et al.: Lidar measurements of Raikoke aerosol

Figure 5. Average backscatter ratios at 355 nm for (a) 13–14 July 2019 (21:31–03:22 UTC) and (b) 25 August 2019 (20:37–21:47 UTC).
The tropopause height as derived from the radiosonde is shown by the dotted red line.

Figure 6. CALIPSO lidar measurements along an orbit to the east of the UK between 02:10 and 02:13 UTC on 14 July 2019.
(a) Total attenuated backscatter at 532 nm, in sr−1 km−1 ; (b) depolarisation ratio. Image courtesy of NASA, https://www-
calipso.larc.nasa.gov/products/lidar/browse_images/std_v4_showdate.php?browse_date=2019-07-14 (last access: 1 August 2020).

present in the upper troposphere and lower stratosphere, the       the end of the year – an exponential decay time of around
value of 100 sr for the lidar ratio is unrealistically high be-    3 months. The optical depth measurements reached a min-
cause the lidar is sensitive only to light polarised parallel      imum of 0.008 on 4–5 February 2020, increasing slightly
to the laser. As it does not detect the perpendicular contri-      thereafter and reaching 0.014 on 20 May 2020.
bution to the backscatter, the measured aerosol backscatter           Figure 7b shows how the maximum measured backscat-
ratios are too small. However, the method by which the li-         ter ratio for each night increased to a peak of 1.6 on 1 Au-
dar ratio is estimated, which involves returning the backscat-     gust 2019 before decreasing sharply to an average value of
ter profile to the molecular value beneath the aerosol layer,      1.045 in 2020. Figure 7c shows the height of the highest ex-
compensates for the reduced backscatter and gives the cor-         tent of the aerosol layer, the peak backscatter ratio and (for
rect optical depth values. These are therefore as accurate as      reference) the tropopause. The maximum height increased
in the later period (±20 %–25 %).                                  from around 15 km in mid-July to 20 km in September, re-
   The peak optical depth of around 0.05 was reached at            maining more or less constant thereafter at 20–21 km. The
the beginning of August 2019, declining to around 0.01 by          height of maximum backscatter ratio was more variable, with

Atmos. Chem. Phys., 21, 5597–5604, 2021                                              https://doi.org/10.5194/acp-21-5597-2021
G. Vaughan et al.: Lidar measurements of Raikoke aerosol                                                                                  5603

                                                                          in the general region between Kamchatka and Alaska, with
                                                                          the SO2 oxidising to sulfuric acid in the form of spherical
                                                                          droplets (de Leeuw et al., 2020). Small patches of volcanic
                                                                          aerosol may have reached the UK in first few days of July, but
                                                                          they were indistinguishable from the elevated aerosol back-
                                                                          ground in the lower stratosphere at that time. The first un-
                                                                          ambiguous observation of volcanic aerosol at Capel Dewi,
                                                                          as suggested by the supplemental video of de Leeuw et al.
                                                                          (2020) showing the dispersion of the aerosol cloud, was
                                                                          therefore the night of 13–14 July 2019. CALIPSO profiles in
                                                                          the vicinity measured low depolarisation, indicating that the
                                                                          cloud mostly consisted of spherical sulfuric acid droplets.
                                                                             The measurements show that the aerosol optical depth be-
                                                                          tween 12 and 21 km reached 0.05 at the beginning of Au-
                                                                          gust 2019, decaying to 0.01 by the end of 2019, and persist-
                                                                          ing up to May 2020 at around the same level. The maximum
                                                                          lidar backscatter ratio was 1.6 on 1 August 2019, with a sharp
                                                                          decrease reaching values < 1.1 from December onwards. It
                                                                          is likely that aerosol from the eruption of Ulawun in Papua
                                                                          New Guinea on 26 June 2019 mixed with the Raikoke aerosol
                                                                          over the months following the eruptions, so that the residual
                                                                          aerosol from August 2019 onward (Chouza et al., 2020) con-
                                                                          tained contributions from both sources.

                                                                          Code availability. Please contact the authors for details of the
                                                                          FORTRAN/IDL code.

                                                                          Data availability. The     data    may     be     accessed          at
                                                                          https://doi.org/10.17632/6j67sfwkjx.1 (Vaughan, 2020).
Figure 7. (a) Optical depth of the stratosphere at 355 nm between
27 June 2019 and 30 May 2020. Measurements after 10 July are
considered to be volcanic aerosol, for which a lidar ratio of 40 or       Author contributions. DW performed the measurements, GV and
50 sr was assumed (see text for discussion of errors on this plot).       HR performed the analysis, and all authors contributed to writing
Earlier measurements are of smoke layers, where the lidar ratio has       the paper.
to be artificially increased to account for the depolarising particles.
Also shown are estimates of optical depth from the Raman chan-
nel where more than 10 h of data were measured; the bars denote           Competing interests. The authors declare that they have no conflict
±1σ limits. (b) The corresponding peak backscatter ratio for each         of interest.
night (random error ±0.02). (c) The height of the peak backscatter
ratio (black asterisks), the top of the aerosol layer (green crosses)
and tropopause height as calculated from a nearby radiosonde (blue        Special issue statement. This article is part of the special issue
squares).                                                                 “Satellite observations, in situ measurements and model simulations
                                                                          of the 2019 Raikoke eruption (ACP/AMT/GMD inter-journal SI)”.
                                                                          It is not associated with a conference.
some outliers like that in Fig. 5b, but for the most part was
around 15 km during 2019, with an apparent descent in 2020
to around 13 km.                                                          Acknowledgements. We thank Jim Haywood and Martin Osborne
                                                                          for fruitful discussions regarding the arrival of the volcanic aerosol
                                                                          over Europe and Vladislav Gerasimov and the anonymous reviewer
                                                                          for their thorough comments on the original manuscript.
5   Conclusions

The eruption of Raikoke on 22 June 2019 introduced a cloud
of ash and sulfur dioxide into the lower stratosphere. For the
first couple of weeks after the eruption the cloud remained

https://doi.org/10.5194/acp-21-5597-2021                                                    Atmos. Chem. Phys., 21, 5597–5604, 2021
5604 G. Vaughan et al.: Lidar measurements of Raikoke aerosol
Financial support. This research has been supported by the Natural Kloss, C., Berthet, G., Sellitto, P., Ploeger, F., Taha, G., Tidiga,
Environment Research Council (National Centre for Atmospheric M., Eremenko, M., Bossolasco, A., Jégou, F., Renard, J.-B., and
Science). Legras, B.: Stratospheric aerosol layer perturbation caused by the
2019 Raikoke and Ulawun eruptions and their radiative forcing,
Atmos. Chem. Phys., 21, 535–560, https://doi.org/10.5194/acp-
Review statement. This paper was edited by Matthias Tesche and 21-535-2021, 2021.
reviewed by Vladislav Gerasimov and one anonymous referee. Korshunov, V. A. and Zubachev, D. S.: Determination of
stratospheric aerosol parameters from two-wavelength lidar
sensing data, Izvestiya Atmos. Ocean. Phys., 49, 176–186,
https://doi.org/10.1134/S0001433813020114, 2013.
References Lopes, F. J. S., Silva, J. J., Antuna Marrero, J. C., Taha, G., and
Landulfo, E.: Synergetic Aerosol Layer Observation After the
Chouza, F., Leblanc, T., Barnes, J., Brewer, M., Wang, P., and Koon, 2015 Calbuco Volcanic Eruption Event, Remote Sensing, 11,
D.: Long-term (1999–2019) variability of stratospheric aerosol 195, https://doi.org/10.3390/rs11020195, 2019.
over Mauna Loa, Hawaii, as seen by two co-located lidars and Mattis, I., Siefert, P., Mueller, D., Tesche, M., Hiebsch, A., Kanitz,
satellite measurements, Atmos. Chem. Phys., 20, 6821–6839, T., Schmidt, J., Finger, F., Wandinger, U., and Ansmann, A.: Vol-
https://doi.org/10.5194/acp-20-6821-2020, 2020. canic aerosol layers observed with multiwavelength Raman li-
Crafford, A. and Venzke, E.: Global Volcanism Program dar over central Europe in 2008–2009, J. Geophys. Res.-Atmos.,
Report on Raikoke (Russia), Bulletin of the Global 115, D00L04, https://doi.org/10.1029/2009JD013472, 2010.
Volcanism Network, Smithsonian Institution, 44, 8, Stein, A. F., Draxler, R. R., Rolph, G. D., Stunder, B. J. B., Co-
https://doi.org/10.5479/si.GVP.BGVN201908-290250, 2019. hen, M. D., and Ngan, F.: NOAA’s HYSPLIT Atmospheric
de Leeuw, J., Schmidt, A., Witham, C. S., Theys, N., Taylor, I. Transport and Dispersion Modeling System, B. Am. Meteo-
A., Grainger, R. G., Pope, R. J., Haywood, J., Osborne, M., rol. Soc., 96, 2059–2077, https://doi.org/10.1175/BAMS-D-14-
and Kristiansen, N. I.: The 2019 Raikoke volcanic eruption: Part 00110.1, 2015.
1 Dispersion model simulations and satellite retrievals of vol- Thomas, L., Jenkins, D. B., Wareing, D. P., Vaughan, G., and Far-
canic sulfur dioxide, Atmos. Chem. Phys. Discuss. [preprint], rington, M.: Lidar observations of stratospheric aerosols associ-
https://doi.org/10.5194/acp-2020-889, in review, 2020. ated with the El Chichon eruption, Ann. Geophys., 5A, 47–56,
Fox, A.: This sulfur-spewing Russian volcano is turning sunsets 1987.
purple, Science, https://doi.org/10.1126/science.aaz4993, 2019. Trickl, T., Giehl, H., Jäger, H., and Vogelmann, H.: 35 yr of strato-
Grebennikov, V. S., Zubachev, D. S., Korshunov, V. A., Sakhibga- spheric aerosol measurements at Garmisch-Partenkirchen: from
reev, D. G., and Chernikh, I. A.: Observations of Stratospheric Fuego to Eyjafjallajökull, and beyond, Atmos. Chem. Phys., 13,
Aerosol at Rosgidromet Lidar Stations after the Eruption of the 5205–5225, https://doi.org/10.5194/acp-13-5205-2013, 2013.
Raikoke Volcano in June 2019, Atmos. Ocean. Optics, 33, 519– Vaughan, G.: Raikoke Lidar data, Mendeley Data, V1,
523, https://doi.org/10.1134/S1024856020050097, 2020. https://doi.org/10.17632/6j67sfwkjx.1, 2020.
Hedelt, P., Efremenko, D. S., Loyola, D. G., Spurr, R., and Clarisse, Vaughan, G., Wareing, D. P., Jones, S. B., Thomas, L., and Larsen,
L.: Sulfur dioxide layer height retrieval from Sentinel-5 Precur- N.: Lidar measurements of Mt. Pinatubo aerosols at Aberystwyth
sor/TROPOMI using FP_ILM, Atmos. Meas. Tech., 12, 5503– from August 1991 through March 1992, Geophys. Res. Lett., 21,
5517, https://doi.org/10.5194/amt-12-5503-2019, 2019. 1315–1318, 1994.
Hoffmann, A., Ritter, C., Stock, M., Maturilli, M., Eckhardt, Vaughan, G., Draude, A. P., Ricketts, H. M. A., Schultz, D. M.,
S., Herber, A., and Neuber, R.: Lidar measurements of the Adam, M., Sugier, J., and Wareing, D. P.: Transport of Canadian
Kasatochi aerosol plume in August and September 2008 in Ny- forest fire smoke over the UK as observed by lidar, Atmos. Chem.
Alesund, Spitsbergen, J. Geophys. Res.-Atmos., 115, D00L12, Phys., 18, 11375–11388, https://doi.org/10.5194/acp-18-11375-
https://doi.org/10.1029/2009JD013039, 2010. 2018, 2018.
Kim, M.-H., Omar, A. H., Tackett, J. L., Vaughan, M. A., Winker, Zuev, V. V., Burlakov, V. D., Nevzorov, A. V., Pravdin, V. L.,
D. M., Trepte, C. R., Hu, Y., Liu, Z., Poole, L. R., Pitts, M. C., Savelieva, E. S., and Gerasimov, V. V.: 30-year lidar obser-
Kar, J., and Magill, B. E.: The CALIPSO version 4 automated vations of the stratospheric aerosol layer state over Tomsk
aerosol classification and lidar ratio selection algorithm, At- (Western Siberia, Russia), Atmos. Chem. Phys., 17, 3067–3081,
mos. Meas. Tech., 11, 6107–6135, https://doi.org/10.5194/amt- https://doi.org/10.5194/acp-17-3067-2017, 2017.
11-6107-2018, 2018.
Atmos. Chem. Phys., 21, 5597–5604, 2021 https://doi.org/10.5194/acp-21-5597-2021You can also read