Measurement report: Long-emission-wavelength chromophores dominate the light absorption of brown carbon in aerosols over Bangkok: impact from ...
←
→
Page content transcription
If your browser does not render page correctly, please read the page content below
Atmos. Chem. Phys., 21, 11337–11352, 2021
https://doi.org/10.5194/acp-21-11337-2021
© Author(s) 2021. This work is distributed under
the Creative Commons Attribution 4.0 License.

Measurement report: Long-emission-wavelength chromophores
dominate the light absorption of brown carbon in aerosols over
Bangkok: impact from biomass burning
Jiao Tang1,2,3 , Jiaqi Wang1,2,3,4 , Guangcai Zhong1,2,3 , Hongxing Jiang1,2,3,4 , Yangzhi Mo1,2,3 , Bolong Zhang1,2,3,4 ,
Xiaofei Geng1,2,3,4 , Yingjun Chen5 , Jianhui Tang6 , Congguo Tian6 , Surat Bualert7 , Jun Li1,2,3 , and Gan Zhang1,2,3
1 StateKey Laboratory of Organic Geochemistry and Guangdong Key Laboratory of Environmental Protection and Resources
Utilization, Guangzhou Institute of Geochemistry, Chinese Academy of Sciences, Guangzhou 510640, China
2 CAS Center for Excellence in Deep Earth Science, Guangzhou 510640, China
3 Guangdong–Hong Kong–Macao Joint Laboratory for Environmental Pollution and Control, Guangzhou Institute of

Geochemistry, Chinese Academy of Sciences, Guangzhou 510640, China
4 University of Chinese Academy of Sciences, Beijing 100049, China
5 Department of Environmental Science and Engineering, Fudan University, Shanghai 200092, P.R. China
6 Key Laboratory of Coastal Environmental Processes and Ecological Remediation, Yantai Institute of Coastal Zone Research,

Chinese Academy of Sciences, Yantai 264003, China
7 Faculty of Environment, Kasetsart University, Bangkok 10900, Thailand

Correspondence: Guangcai Zhong (gczhong@gig.ac.cn)

Received: 26 February 2021 – Discussion started: 9 April 2021
Revised: 9 June 2021 – Accepted: 28 June 2021 – Published: 28 July 2021

Abstract. Chromophores represent an important portion of         were oxygen-rich and highly aromatic with high molecular
light-absorbing species, i.e., brown carbon. Yet knowledge of    weights were the key contributors of light absorption, prefer-
what and how chromophores contribute to aerosol light ab-        ably at longer emission wavelengths (λmax > 500 nm). Pos-
sorption is still sparse. To address this problem, we examined   itive matrix factorization analysis further suggested that up
soluble independent chromophores in a set of year-round          to 50 % of these responsible chromophores originated from
aerosol samples from Bangkok. The water-soluble fluores-         biomass burning emissions.
cent chromophores identified via excitation–emission ma-
trix (EEM) spectroscopy and follow-up parallel factor analy-
sis could be mainly assigned as humic-like substances and
protein-like substances, which differed in their EEM pat-        1   Introduction
tern from that of the methanol-soluble fraction. The emis-
sion wavelength of fluorescent chromophores in environmen-       Atmospheric aerosols play a substantial role in climate
tal samples tended to increase compared with that of the         change through radiative forcing (Alexander et al., 2008).
primary combustion emission, which could be attributed to        Carbonaceous aerosols mainly include organic carbon (OC)
secondary formation or the aging process. Fluorescent in-        and elemental carbon (EC). Brown carbon (BrC) is a spe-
dices inferred that these light-absorbing chromophores were      cific type of OC that absorbs radiation efficiently in the near-
not significantly humified and comprised a mixture of or-        ultraviolet and visible (UV–Vis) range (Laskin et al., 2015;
ganic matter of terrestrial and microbial origin, which ex-      Kirchstetter et al., 2004) and may contribute 15 % or more of
hibited a different characteristic from primary biomass burn-    total light absorption over the UV–Vis spectrum (Kirchstetter
ing and coal-combustion results. A multiple linear regression    and Thatcher, 2012; Liu et al., 2013). This fraction can sig-
analysis revealed that larger fluorescent chromophores that      nificantly affect atmospheric chemistry, air quality, and cli-
                                                                 mate change (Marrero-Ortiz et al., 2018; Laskin et al., 2015).

Published by Copernicus Publications on behalf of the European Geosciences Union.
11338                      J. Tang et al.: Long-emission-wavelength chromophores dominate the light absorption of BrC

Forest fires, residential heating by wood and coal, biogenic      standing of the chemical properties of BrC, but it should be
release, and secondary formation contribute to BrC in the at-     noted that not all chromophores in BrC compounds are fluo-
mosphere (Laskin et al., 2015). Many studies have indicated       rescent (Chen et al., 2019a). There is evidence that BrC ab-
that the optical properties of BrC may significantly evolve       sorption is closely correlated with fluorescent chromophores
as a result of atmospheric processes such as oxidation (Fan       (Huo et al., 2018). However, the intrinsic relationship be-
et al., 2020), solar irradiation (Wong et al., 2017), and rela-   tween fluorescent chromophores and BrC absorption has not
tive humidity (Kasthuriarachchi et al., 2020). These factors      been explored.
cause variability in the chemical compositions and levels of         Southeast Asia is subject to intensive regional biomass
BrC across source regions and receptors, resulting in a high      burning, the emissions from which may contribute to atmo-
degree of uncertainty regarding the effects of BrC (Dasari et     spheric brown clouds (Ramanathan et al., 2007; Laskin et al.,
al., 2019; Xie et al., 2019).                                     2015). The contribution of biomass burning to aerosol opti-
   Light absorption of BrC is associated with its molecular       cal depth was evaluated to be more than 56 % over this re-
composition and chemical structure (Song et al., 2019; Lin        gion (Huang et al., 2013). Despite many studies focused on
et al., 2018; Mo et al., 2018; Jiang et al., 2020). Detailed      the characterization of atmospheric black carbon (BC) (See
structural characterization of BrC compounds is essential to      et al., 2006; Fujii et al., 2014; Permadi et al., 2018), stud-
understand their sources and chemical processes in the at-        ies on BrC in the region are still limited. A recent study in
mosphere. High-resolution mass spectrometry (HRMS) is a           Singapore indicated that water-soluble OC (WSOC) exhibits
powerful tool for molecular-level chemical analysis of or-        strong wavelength dependence and even higher values of BrC
ganic aerosols (Laskin et al., 2018). Combinations of offline     absorption than those from Korea, India, China, and Nepal
high-performance liquid chromatography (HPLC), a photo-           (Adam et al., 2020), indicating abundant water-soluble BrC
diode array detector, and HRMS allow the chemical char-           in the air over Southeast Asia.
acterization of aerosols specific to BrC (Lin et al., 2018,          This study was performed to explore the relationships be-
2016, 2015, 2017). With these combination approaches, ni-         tween EEM chromophores and BrC light absorption in solu-
troaromatics, aromatic acids, phenols, polycyclic aromatic        ble aerosol organic matter. A set of year-round aerosol sam-
hydrocarbons, and their derivatives are basically identified      ples from Bangkok, Thailand, was analyzed. Water-soluble
as BrC chromophores (X. Wang et al., 2020; Yan et al.,            and methanol-soluble BrC in the aerosol samples was char-
2020). However, it should be noted that it is difficult to ion-   acterized by EEM, followed by statistical analyses to re-
ize some organic compounds for detection using HRMS, and          trieve information on the contributions of fluorescent chro-
even for those that can be detected, HRMS can only provide        mophores to BrC light absorption and their emission sources.
possible molecular structures based on empirical deduction        This study provides a comprehensive dataset on seasonal
(Song et al., 2018; Lin et al., 2015). The isomeric complex-      variability in the light absorption properties, sources, and
ity of natural organic matter may have exceeded achievable        chemical components of BrC, which may be useful for im-
one-dimensional chromatographic resolution (Hawkes et al.,        proving further modeling and field observation.
2018), and therefore the majority of components in the BrC
mixture remain undetermined.
   Excitation–emission matrix (EEM) fluorescence spec-            2     Experiment
troscopy detects bulk chromophores in a solution (Chen et
al., 2016b). Chromophores can be revealed by EEM with             2.1    Sample collection and extraction
information on their chemical structures associated with
molecular weight, aromatic rings, and conjugated systems          A total of 85 total suspended particulate (TSP) samples were
(Wu et al., 2003). For example, a red shift in emission spec-     collected on the roof (57 m above ground level) of the Fac-
tral maxima can be caused by an increase in the number of         ulty of Environment at Kasetsart University (100◦ 570 E and
aromatic rings condensed in a straight chain, conjugated dou-     13◦ 850 N) in Bangkok, Thailand (Fig. S1 in the Supplement).
ble bonds, or formational changes that permit vibrational en-     Detailed information about the sampling site is presented
ergy losses of the promoted electrons (Wu et al., 2003). A        elsewhere (J. Wang et al., 2020). Sampling was performed
significant Stokes shift with emission wavelength can be ob-      from 18 January 2016 to 28 January 2017, and the sam-
served in aged secondary organic aerosol (SOA) using EEM          pling period was divided into four seasons: the pre-hot sea-
spectroscopy (Lee et al., 2013). Parallel factor (PARAFAC)        son (18 January–28 February 2016), hot season (2 March–
analysis has been widely used to decompose the EEM spec-          30 May 2016), monsoon (2 June–30 October 2016), and
tral signature into independent underlying components (Han        cool season (1 November 2016–28 January 2017). Table S1
et al., 2020; Yue et al., 2019; Wu et al., 2019; Chen et al.,     lists the average meteorological data in the four seasons.
2019b), adding valuable information to absorbance-based           Generally, during the sampling period, the hot season was
measurements (Yan and Kim, 2017). This technique helps to         characterized by high temperatures and wind speeds, and
categorize groups of similar fluorophores or chromophores         the monsoon season was characterized by high humidity.
or similar optical properties, thereby allowing a better under-   TSP samples were collected over 24 h using a high-volume

Atmos. Chem. Phys., 21, 11337–11352, 2021                                         https://doi.org/10.5194/acp-21-11337-2021
J. Tang et al.: Long-emission-wavelength chromophores dominate the light absorption of BrC                                   11339

(0.3 m3 min−1 ) sampler with quartz-fiber filters (QFFs, pre-     method (Bahram et al., 2006). The two- to nine-component
baked for 6 h at 450 ◦ C). All samples and field blanks were      PARAFAC model was explored within the context of spectral
stored under dark conditions at −20 ◦ C until analysis.           loading, core consistency, and residual analysis (Figs. S2–
   WSOC was prepared by ultrasonication extraction of fil-        S5). Finally, seven and six components were identified in
ter punches with ultrapure deionized water (resistivity of        the WSOC and MSOC fractions, which explained 99.89 %
> 18.2 M). The methanol-soluble OC (MSOC) fraction               and 99.76 % of the variance, respectively. Both the seven-
was then obtained by extracting the freeze-dried residue          and six-component PARAFAC solutions passed the split-half
on the same QFFs after water extraction with HPLC-grade           analysis with the split style of S4 C6 T3 , and residuals were ex-
methanol, which is used for water-insoluble fractions (Chen       amined to ensure that there was no systematic variation. The
and Bond, 2010). It is worth noting that the MSOC in this         parameters obtained from the PARAFAC model were used
study is not necessarily like that of the same name in other      to calculate the approximate abundance of each component,
studies. The extract solutions were passed through 0.22 µm        expressed as Fmax (in RU), corresponding to the maximum
PTFE filters and subjected to follow-up UV–Vis absorption         fluorescence intensity for a particular sample.
and fluorescence spectral analysis. The mass concentrations          Fluorescence indices based on intensity ratios provide in-
of WSOC and MSOC were measured, and the methods are               sight into the origins of dissolved BrC, such as the humifica-
shown in the Supplement.                                          tion index (HIX) (the ratio of average emission intensity in
                                                                  the 435–480 nm range to that in the 300–345 nm range fol-
2.2   Absorption spectra and fluorescence spectra                 lowing excitation at 254 nm, which was used to reflect the de-
                                                                  gree of humification) (Zsolnay et al., 1999), the biological in-
The extract solutions were placed in quartz cells with a path-    dex (BIX) (the ratio of emission intensities at 380 and 430 nm
length of 1 cm and subjected to analysis using a fluorometer      following excitation at 310 nm, reflecting autochthonous bi-
(Aqualog; Horiba Scientific, USA). Absorption spectra and         ological activity in water samples) (Huguet et al., 2009), and
EEM spectra were obtained simultaneously using this instru-       the fluorescence index (FI) (the ratio of emission intensities
ment. The contribution of solvents was subtracted from the        at 470 and 520 nm following excitation at 370 nm, reflecting
extract spectra. UV–Vis absorption spectra were scanned in        the possibility of microbial origin and for examining differ-
the range of 239 to 800 nm with a step size of 3 nm. The fluo-    ences in precursor organic materials) (Lee et al., 2013; Mur-
rescence spectra were recorded with an emission wavelength        phy et al., 2018).
(Em) ranging from 247.01 to 825.03 nm and excitation wave-
length (Ex) ranging from 239 to 800 nm. The wavelength in-        2.4    Statistical analysis
crements of the scans for Em and Ex were 4.66 and 3 nm,
respectively. The calculation of optical parameters and the       A hierarchical cluster method was used to classify aerosol
relative contributions of BrC to total aerosol light absorption   samples based on the relative contributions of PARAFAC
are presented in the Supplement.                                  components to the respective samples. The squared Eu-
                                                                  clidean distance method was used to evaluate the distances
2.3   Factor analysis                                             between samples, and the between-group linkage method
                                                                  was chosen for hierarchical cluster analysis. The multiple
In this study, we built a PARAFAC model based on 85 TSP           linear regression (MLR) model was applied to elucidate the
sample fluorescence (samples × Ex × Em: 85 × 188 × 125,           relationship between fluorescent chromophores and light ab-
85-model). Original EEM spectra were corrected and de-            sorption of BrC using a stepwise screening process. Analyses
composed via PARAFAC analysis with reference to earlier           were performed using SPSS software (SPSS Inc., Chicago,
methods using drEEM toolbox version 2.0 with MATLAB               IL, USA).
software (http://models.life.ku.dk/drEEM, last access: June
2014) (Murphy et al., 2013; Andersson and Bro, 2000). The         3     Results and discussion
absorbance, all below 1 at 239 nm, was deemed suitable for
correcting the EEM spectra for inner filter effects (IFEs) (Lu-   3.1    EEM of dissolved organic substances
ciani et al., 2009; Gu and Kenny, 2009; Fu et al., 2015), and
the sample EEM spectra and blanks were normalized rela-           Fluorescence spectra coupled with PARAFAC results can
tive to the Raman peak area of ultrapure deionized water col-     provide more information about the chemical structures of
lected on the same day to correct fluorescence in Raman units     chromophores. Figure 1 and Table S2 show the seven-
(RU) (Murphy et al., 2013, 2010). Spectra with Em > 580 nm        component (P1–P7) PARAFAC solutions of WSOC in the
and Ex < 250 nm were removed to eliminate noisy data.             samples of aerosol over Bangkok, the peaks of which fell
The non-negativity constraint is necessary to obtain reason-      mainly into the humic-like and protein-like chromophore re-
able spectra, and signals of first-order Rayleigh and Ra-         gions in the plots. Components P2, P3, P4, and P6 were
man scattering as well as second-order Rayleigh scattering        identified as humic-like substances (HULIS) (H. Chen et al.,
in the EEM spectra were removed using the interpolation           2017; Stedmon and Markager, 2005; Wu et al., 2019; Chen et

https://doi.org/10.5194/acp-21-11337-2021                                        Atmos. Chem. Phys., 21, 11337–11352, 2021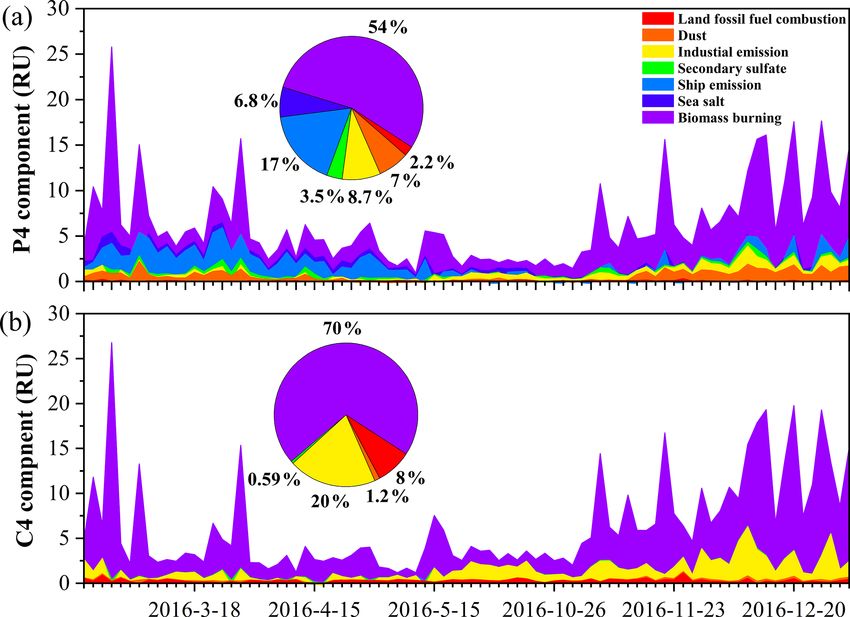
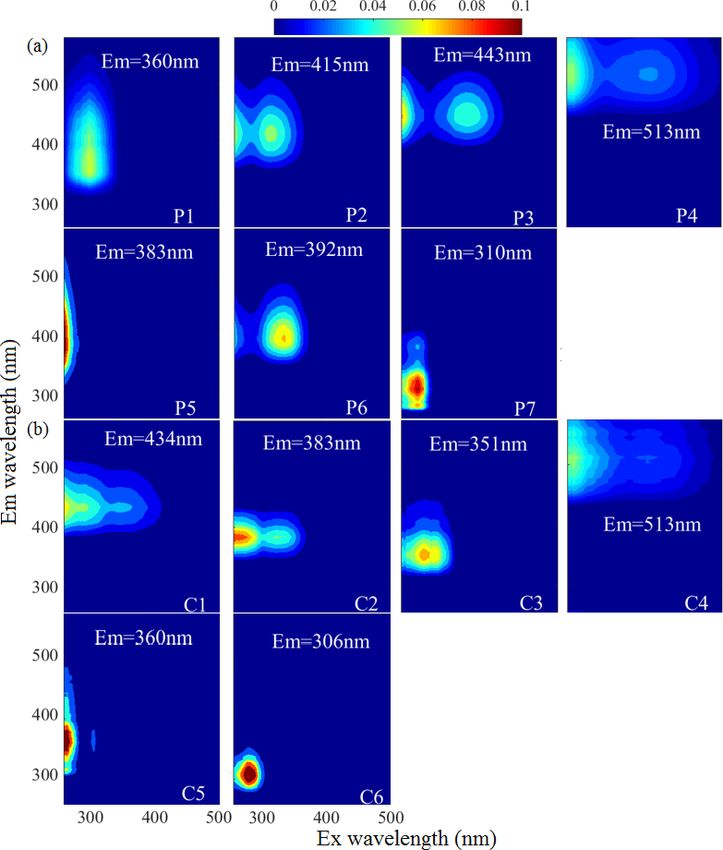
11340                      J. Tang et al.: Long-emission-wavelength chromophores dominate the light absorption of BrC

al., 2003). A second peak was observed at a high excitation      modeling. PARAFAC analysis successfully decomposed the
wavelength for these components, indicating the existence        dataset, and the output was the same as for the 85-model. The
of a large number of condensed aromatic moieties, conju-         component solutions are presented in Fig. S6. To validate the
gated bonds, and nonlinear ring systems (Matos et al., 2015).    stability of the model after loading by the new matrix, the
Among them, P2, P3, and P4 had a longer emission wave-           Tucker congruence coefficient (TCC) was calculated to de-
length (> 400 nm) than P6, likely due to the low probability     termine the similarity of two fluorescence spectra between
of fluorescence emission from quinonoid n − π ∗ transitions      the two models (refer to Text S3 of the Supplement). Note
(Cory and McKnight, 2005). P3 produced spectra similar to        that a higher TCC value would indicate a higher degree of
those of aqueous reaction products of hydroxyacetone with        similarity of the spectra. As shown in Table S2 and Fig. S7,
glycine (Gao and Zhang, 2018) and dissolved organic mat-         high TCC values were found as expected between the 85-
ter (DOM) in the surface water of Xiangxi Bay and Three          model components and the 145-model components, indicat-
Gorges Reservoir (Wang et al., 2019). P6 had a peak simi-        ing that the two models identified similar fluorescent chro-
lar to those in the fluorescence spectra of N-containing SOA     mophores. It should be noted that one additional fluorescent
species formed by α-pinene under ozonolysis and photoox-         component each was identified for the WSOC and MSOC
idation with NH3 in a flow reactor (Babar et al., 2017) as       fractions in the new 145-model, but these components were
well as pyridoxine (Pöhlker et al., 2012), indicating a possi-   only highly characterized by source emission samples, as re-
ble biological source. P5 was similar to a previously identi-    ported in our previous study (Tang et al., 2020b).
fied fluorophore in PM2.5 from Xi’an (Chen et al., 2019b).           Using the distribution proportions of the EEM–PARAFAC
P1 and P7 could be assigned as protein-like organic matter       fitted components (145-model), we conducted hierarchical
(PLOM) due to their short emission wavelengths (Wu et al.,       cluster analysis of the mixed ambient and source samples.
2003). Specifically, P7 resembled a tyrosine-like fluorophore    The results are shown in Figs. S9 and S10. For the WSOC
(Zhou et al., 2019; Chen et al., 2003) and may be related to     fraction, all aerosol samples from Bangkok and tunnel sam-
non-N-containing species (Chen et al., 2016b).                   ples were assigned to cluster A, whereas biomass burn-
   The MSOC fraction extracted from the filter residue af-       ing and coal-combustion aerosols were assigned to clus-
ter water extraction produced fluorescence signals with flu-     ters C and D, respectively. This implied that the fluores-
orescence patterns different from those of the WSOC frac-        cent chromophore types could be somewhat related to the
tion, indicating a different chemical composition from that      emission precursors of the aerosol components. However,
of WSOC. Thus, WSOC with the addition of MSOC may                the distribution of fluorescent chromophores clearly varied
provide a more comprehensive description of the optical and      between the ambient aerosols and source samples. The am-
chemical characteristics of BrC compared to WSOC alone.          bient aerosol samples contained higher levels of fluorescent
Six components (C1–C6) were resolved for the MSOC.               chromophores with longer emission wavelengths that were
Among them, C1 and C2 were associated with shorter ex-           related to humic-like or fulvic-like chromophores (compo-
citation wavelengths (< 250 nm) but longer emission wave-        nents 145M-P1 – the P1 component in the 145-model, 145M-
lengths (> 380 nm), indicating the presence of fulvic-like       P5, and 145M-P6), whereas the primary biomass burning
substances (Chen et al., 2003; Mounier et al., 1999). C6 pro-    and coal-combustion samples contained high-intensity flu-
duced a pattern similar to that of tyrosine-like fluorescence    orescent chromophores with shorter emission wavelengths
(Stedmon and Markager, 2005). Although C4 had a similar          that were related to protein-like fluorescence (145M-P2 and
EEM spectrum as P4 of WSOC, the two components were              145M-P4). These phenomena was similarly reported previ-
chemically different in polarity, suggesting different behav-    ously; i.e., protein-like substances produce compounds with
iors in the environment (Ishii and Boyer, 2012). Note that       similar fluorescence properties as humic substances under
there were no special chemical structures for the different      irradiation conditions (Bianco et al., 2014). Similar differ-
types of chromophores, and therefore the origins and chemi-      ences between field samples and source samples were found
cal structures of HULIS and PLOM studied here are not nec-       for the MSOC fraction. Therefore, our results confirmed that
essarily like those with the same names in other types of or-    chemical reaction or “aging” in the atmosphere greatly mod-
ganic matter.                                                    ifies the chromophore patterns of emission sources by both
   To further explore the potential sources of the EEM–          bleaching the source chromophores and producing new chro-
PARAFAC components, we added 60 source samples to the            mophores, and, at least in this case, it shifts the chromophore
matrices. The source sample EEM data were described in our       emission wavelength toward longer wavelengths, i.e., from
previous study (Tang et al., 2020b), including those of 33       protein-like to fulvic-like (Bianco et al., 2014, 2016; Lee et
biomass burning samples (IDs: 1–33), 17 coal-combustion          al., 2013).
samples (IDs: 34–50) samples, eight tunnel samples (IDs:
51–58), and two vehicle exhaust samples from trucks (IDs:        3.2   Fluorescence-derived indices
59–60), which are important sources of BrC in the atmo-
sphere. This, in combination with our Bangkok field sam-         The ratios of fluorescence intensity from specific spectral re-
ples, yielded a new matrix (145 × 188 × 125, 145-model) for      gions of an EEM were used as indicators for the relative con-

Atmos. Chem. Phys., 21, 11337–11352, 2021                                        https://doi.org/10.5194/acp-21-11337-2021
J. Tang et al.: Long-emission-wavelength chromophores dominate the light absorption of BrC                                    11341

Figure 1. The fluorescent components identified by the PARAFAC (parallel factor) analysis for the EEM of water-soluble organic carbon
(P1–P7, WSOC, a) and methanol-soluble organic carbon (C1–C6, MSOC, b) in the aerosol samples over Bangkok in Thailand (n = 85). The
color represents the fact that the intensity was normalized to set the maximum as 0.1.

tributions of organic matter derived from terrestrial or mi-         and coal-combustion samples, which were much lower than
crobial sources in natural waters (Shimabuku et al., 2017;           those in the ambient samples, indicating that the lower val-
Birdwell and Engel, 2010; Mcknight et al., 2001). HIX was            ues of HIX in the atmosphere likely correspond to freshly in-
initially introduced to estimate the degree of maturation of         troduced material. Lee et al. (2013) reported that fresh SOA
DOM in soil (Zsolnay et al., 1999), representing the degree          had low HIX values, but these values increased significantly
of humification of organic matter, for which higher HIX val-         upon aging with ammonia. The much higher HIX values in
ues also indicate a higher degree of polycondensation (low           the WSOC compared to the MSOC suggest that WSOC may
H / C ratio) and aromaticity (Qin et al., 2018). Generally,          have a higher degree of aromaticity or a more condensed
high HIX values (> 10) correspond to strongly humified or            chemical structure. Our previous study revealed that MSOC
aromatic organics, principally of terrestrial origin, whereas        has a higher molecular weight but lower aromaticity index
low values (< 4) are indicative of autochthonous or micro-           than the corresponding WSOC in combustion experiment
bial origin. As shown in Table 1 and Fig. 2, the HIX values          aerosol samples, indicating a more aliphatic structure in the
were 3.4 ± 0.99 and 2.0 ± 0.59 for WSOC and MSOC, re-                MSOC (Tang et al., 2020b). The HIX values of WSOC were
spectively, in aerosol samples from Bangkok. All HIX values          highest in the hot season (3.9 ± 1.1), followed by the pre-hot
were less than 10, which could be viewed as a nominal cut-           season (3.3 ± 1.1), cool season (2.9 ± 0.36), and monsoon
off below which DOM is not significantly humified (Birdwell          (2.5 ± 0.22), whereas those of the MSOC tended to be higher
and Valsaraj, 2010; Zsolnay et al., 1999; Huguet et al., 2009).      in the hot and cool seasons than in the monsoon and pre-hot
Figure 2 shows the HIX values in primary biomass burning             seasons. The HIX values in the WSOC fraction were com-

https://doi.org/10.5194/acp-21-11337-2021                                          Atmos. Chem. Phys., 21, 11337–11352, 2021
11342                            J. Tang et al.: Long-emission-wavelength chromophores dominate the light absorption of BrC

Table 1. Seasonal averages of the concentration of organic carbon (OC), elemental carbon (EC), water-soluble organic carbon (WSOC),
and methanol-soluble organic carbon (MSOC), as well as BrC absorption, fluorescence indices, and levoglucosan levels for aerosol samples
collected from Bangkok in Thailand. The pre-hot season is from 18 January to 29 February 2016, the hot season is from 2 March to 31 May
2016, the monsoon is from 2 June to 30 October 2016, and the cool season is from 1 November 2016 to 28 January 2017.

                                                                Annual     Pre-hot season   Hot season      Monsoon      Cool season
                                                               (n = 85)           (n = 7)     (n = 41)        (n = 7)       (n = 30)
                                                              Ave ± SD         Ave ± SD      Ave ± SD       Ave ± SD      Ave ± SD
               OC∗ (µg C m−3 )                                  12 ± 7.3         19 ± 9.3     9.6 ± 6.7     6.5 ± 0.97      16 ± 5.6
               EC∗ (µg C m−3 )                                1.4 ± 0.48       2.0 ± 0.45    1.2 ± 0.47     1.2 ± 0.15    1.5 ± 0.40
               OC / EC∗                                        8.9 ± 5.2        9.6 ± 3.4     8.4 ± 6.8     5.4 ± 0.51      10 ± 2.5
               WSOC
               µg C m−3                                        6.2 ± 4.2       9.9 ± 5.7      5.3 ± 4.1     2.6 ± 0.31      7.4 ± 3.4
               AAE (330–400 nm)                               5.1 ± 0.68      5.0 ± 0.52     5.4 ± 0.56     6.2 ± 0.11    4.5 ± 0.34
               Abs365 (Mm−1 )                                  5.6 ± 4.9        10 ± 7.4      4.5 ± 4.5     1.2 ± 0.21      7.2 ± 4.1
               MAE365 (m2 g−1 C)                             0.83 ± 0.25     0.96 ± 0.19    0.78 ± 0.23    0.45 ± 0.06   0.95 ± 0.21
               FI                                             1.6 ± 0.10      1.6 ± 0.09     1.6 ± 0.08     1.7 ± 0.07    1.7 ± 0.07
               BIX                                           0.82 ± 0.13     0.83 ± 0.14    0.74 ± 0.13    0.92 ± 0.05   0.89 ± 0.07
               HIX                                            3.4 ± 0.99       3.3 ± 1.1      3.9 ± 1.1     2.5 ± 0.22    2.9 ± 0.36
               MSOC
               µg C m−3                                        6.0 ± 3.4       9.2 ± 4.0      4.3 ± 2.9     3.9 ± 0.86      8.1 ± 2.6
               AAE (330–400 nm)                               5.2 ± 0.94      4.9 ± 0.69       5.5 ± 1.1    5.1 ± 0.15    4.7 ± 0.55
               Abs365 (Mm−1 )                                  1.7 ± 1.4       1.9 ± 1.6     1.0 ± 0.99    0.72 ± 0.23      2.7 ± 1.4
               MAE365 (m2 g−1 C)                             0.26 ± 0.12     0.19 ± 0.08    0.23 ± 0.11    0.19 ± 0.06   0.33 ± 0.11
               FI                                             1.8 ± 0.20      1.5 ± 0.20     1.8 ± 0.23     2.0 ± 0.10    1.8 ± 0.06
               BIX                                            1.2 ± 0.18      1.4 ± 0.20     1.2 ± 0.19     1.3 ± 0.09    1.3 ± 0.14
               HIX                                            2.0 ± 0.59      1.3 ± 0.41     2.1 ± 0.68     1.9 ± 0.17    2.1 ± 0.42
               Levoglucosan∗ (ng C m−3 )                      222 ± 485       362 ± 438      185 ± 654        42 ± 16     280 ± 185
               Levoglucosan / TSP∗ (×10−3 )                    2.9 ± 2.9       3.4 ± 3.1      2.3 ± 3.6     1.9 ± 0.98     3.9 ± 1.8
             ∗ Described elsewhere (J. Wang et al., 2020).

parable to those of water-soluble organic aerosols in the high                    the presence of organic matter freshly released into water,
Arctic atmosphere (mean: 2.9) (Fu et al., 2015) and higher                        whereas values ≤ 0.6 indicate the presence of little biologi-
than those of water-soluble aerosols (1.2 ± 0.1 in winter and                     cal material (Huguet et al., 2009).
2.0 ± 0.3 in summer) over northwestern China (Qin et al.,                            The FI and BIX values of the Bangkok aerosol samples
2018), likely indicating a higher degree of chromophore hu-                       are summarized in Table 1 and Fig. 2. The FI values of the
mification.                                                                       WSOC and MSOC were 1.6 ± 0.10 and 1.8 ± 0.20, respec-
   The BIX and FI were previously proposed as proxies                             tively, suggesting that these chromophores are representative
for the contribution of biogenic organic matter and au-                           of both terrestrially and microbially derived organic matter.
tochthonous biological activity in natural water, respectively                    The BIX values of the WSOC and MSOC were 0.82 ± 0.13
(Fu et al., 2015; Qin et al., 2018). For example, the FI de-                      and 1.2 ± 0.18, respectively. Almost all BIX values were
creased by up to 20 %, indicating that the samples appeared                       greater than 0.6 in the two fractions, suggesting biological
increasingly like “terrestrial” DOM, whereas the BIX in-                          or microbial contribution. Lee et al. (2013) reported that the
creased by up to 37 %, indicating that the samples became                         BIX values of SOA samples averaged 0.6 and increased upon
more “autochthonous” in character (Murphy et al., 2018;                           aging. In addition, the results of our source samples showed
Gabor et al., 2014). FI values ≤ 1.4 correspond to terrestri-                     that primary biomass burning and coal-combustion samples
ally derived organics and higher aromaticity, whereas values                      had high FI and BIX values (Fig. 2). These results indicate
≥ 1.9 correspond to microbial sources and a lower aromatic                        that these chromophores in Bangkok were likely freshly in-
carbon content (Mcknight et al., 2001). An increase in BIX                        troduced or derived from biomass burning and coal com-
is related to an increase in the contribution of microbially de-                  bustion. Further, an increase in BIX in the MSOC in com-
rived organics, with high values (> 1) shown to correspond to                     parison with the WSOC was observed in primary biomass
a predominantly biological or microbial origin of DOM and                         burning and coal-combustion samples, consistent with the

Atmos. Chem. Phys., 21, 11337–11352, 2021                                                          https://doi.org/10.5194/acp-21-11337-2021
J. Tang et al.: Long-emission-wavelength chromophores dominate the light absorption of BrC 11343
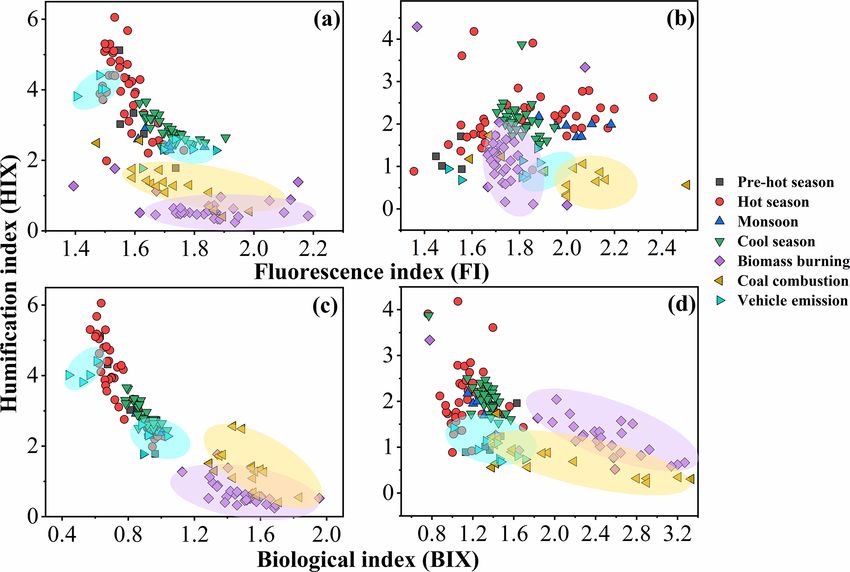
Figure 2. Fluorescence index (FI), biological index (BIX), and humification index (HIX) of water-soluble organic carbon (WSOC, a, c) and
methanol-soluble organic carbon (MSOC, b, d) in aerosol samples from Bangkok, Thailand, as well as source emission samples including
biomass burning, coal combustion, and vehicle emissions, which are encircled by a violet, yellow, and blue region, respectively. Note that the
fluorescence characteristic of source samples was described elsewhere (Tang et al., 2020b), but the fluorescence indices were first reported
in this study. The pre-hot season is from 18 January to 29 February 2016, the hot season is from 2 March to 31 May 2016, the monsoon is
from 2 June to 30 October 2016, and the cool season is from 1 November 2016 to 28 January 2017.
Bangkok samples. The BIX values were similar to those in both fractions were considerably stable. Furthermore, light
the WSOC in Arctic aerosols (0.6–0.96, mean: 0.72), which absorption at 365 nm was higher in the pre-hot season, hot
were within the extreme values for the predominance of season, and cool season than that in the monsoon season.
humic- or protein-like fluorophores (Fu et al., 2015). BIX According to the levoglucosan level, which is generally re-
values exhibited the opposite trend from HIX values, with garded as a biomass burning tracer, and the ratios of levoglu-
low BIX values in the hot season. This may be explained by cosan / TSP (Table 1), we infer that the non-monsoon season
a previous study showing that a high BIX appears to indi- was more affected by biomass burning and also showed high
cate little humification (Birdwell and Engel, 2010). It should absorption.
be noted that the fluorescence indices (FI, BIX, and HIX) The absorption Ångström exponent (AAE) and mass ab-
were first applied for aquatic and soil organic compounds and sorption efficiency (MAE) are important optical parameters
further extended to the atmosphere due to the similarities in reflecting the spectral dependence and light absorption abil-
the properties of organic matter (Graber and Rudich, 2006). ity of BrC, respectively. The magnitude of the AAE reflects
However, the values observed for primary biomass burning the differences in BrC source and atmospheric processes
and coal combustion in this study differ from the previously (Lack et al., 2013). Typically, the AAE value is close to
established fluorescence standards for aquatic environments 1 when light absorption is dominated by soot (Kirchstet-
and soil. Therefore, caution is required when using these ter et al., 2004), roughly 1–3 for simulated biomass burn-
indices to appoint the source of atmospheric chromophores ing aerosols (Hopkins et al., 2007), and up to 6–7 for water-
(Wu et al., 2021). soluble HULIS in biomass-burning-impacted aerosols (Hof-
fer et al., 2006). The AAE values of the WSOC and MSOC
3.3 Optical properties of dissolved BrC between 330 and 400 nm in this study were up to 5.1 ± 0.68
and 5.2 ± 0.94 (Fig. 4), respectively, indicating strong wave-
length dependence in the light absorption capability. These
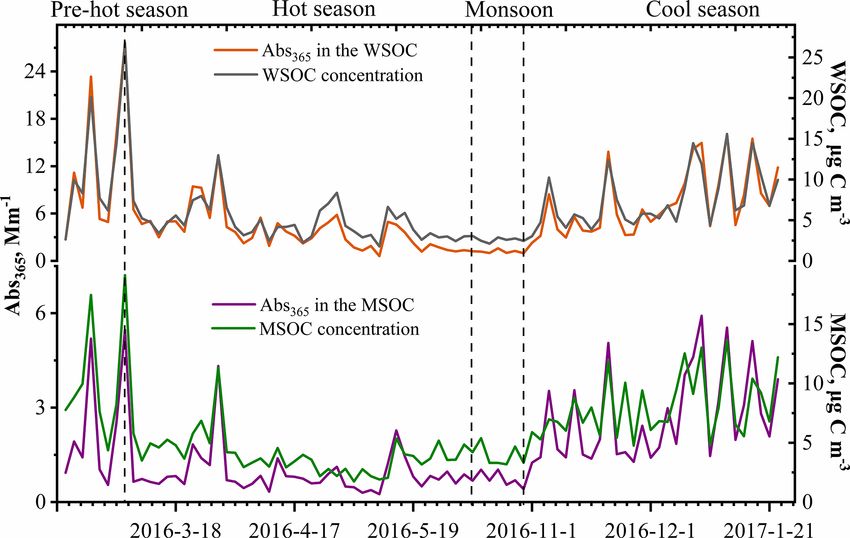
Figure 3 shows the variations in soluble OC concentrations
high values show that BrC tends to absorb more solar ir-
and the corresponding light absorption coefficient at 365 nm
radiation over ultraviolet wavelengths, which is compara-
(Abs365 ). In general, the Abs365 closely tracked the vari-
ble to BC absorption as shown in Fig. S12. These obser-
ations in the mass concentrations of WSOC and MSOC
vations indicate that BrC has important impacts on photo-
(p < 0.000, R 2 = 0.95 and p < 0.000, R 2 = 0.75, respec-
chemical reactions in the atmosphere (Barnard et al., 2008).
tively) (Fig. S11), indicating that the portions of BrC in
https://doi.org/10.5194/acp-21-11337-2021 Atmos. Chem. Phys., 21, 11337–11352, 202111344 J. Tang et al.: Long-emission-wavelength chromophores dominate the light absorption of BrC
Figure 3. Time series plots of the water-soluble organic carbon (WSOC) and methanol-soluble organic carbon (MSOC) concentration
(µg C m−3 ) as well as the water- and methanol-extract light absorption coefficient at 365 nm (Abs365 ) (Mm−1 ) in the aerosol samples from
Bangkok, Thailand, during 2016–2017.
The AAE values in this study are similar to those of water-
soluble BrC over biomass-burning-impacted regions, such as
Beijing (Mo et al., 2018; Yan et al., 2015) and Guangzhou
(Liu et al., 2018), but lower than those of aerosols from
simulated biomass burning and coal-combustion experiments
(Fan et al., 2018; Tang et al., 2020a; Li et al., 2018). How-
ever, it should be noted that the BrC AAE varies in the at-
mosphere. Dasari et al. (2019) reported that AAE values of
water-soluble BrC increase continuously due to photolysis of
chromophores and atmospheric oxidation during long-range
transport over the Indo-Gangetic Plain (IGP). In addition,
pH changes can cause the absorption spectra of some BrC
species to shift to longer wavelengths upon deprotonation,
decreasing AAE values (Mo et al., 2017). The pH values of
the WSOC fraction for all the samples were within the range
of 5–7, generally indicating no effect on the absorbance ac- Figure 4. Time series plots of the absorption Ångström exponent
cording to a prior study (Chen et al., 2016a). (AAE, a) as well as the mass absorption efficiency at 365 nm
The MAE at 365 nm (MAE365 ) of the WSOC was (MAE365 , b) in the water-soluble organic carbon (WSOC) and
methanol-soluble organic carbon (MSOC) in aerosols samples from
0.83 ± 0.25 m2 g−1 C, which was higher than that of the
Bangkok in Thailand during 2016–2017.
MSOC (0.26 ± 0.12 m2 g−1 C), indicating that more water-
soluble BrC with stronger light absorption capability could
be extracted with ultrapure deionized water, whereas water-
insoluble BrC is characterized by lower light absorp- than the MSOC fraction (only extract using methanol), and
tion capability over Bangkok. These results are consis- they explained it due to two plausible reasons. First, the BrC
tent with those from vehicular exhaust samples in our aerosols over the Bay of Bengal have a contribution from a
previous study, wherein MAE365 values of the WSOC different source (i.e., maritime influence) and contain BrC
(0.71 ± 0.30 m2 g−1 C) were higher than those of the MSOC chromophores that are more soluble in water than methanol.
(0.26 ± 0.09 m2 g−1 C) (Tang et al., 2020b). Opposite results Second, there could be significant photobleaching effects
have been shown for primary biomass burning and coal com- of different chromophores. However, G. Wu et al. (2020)
bustion (Tang et al., 2020b). Similarly, Bikkina et al. (2020) reported that the MAE365 values of methanol extracts are
observed that the marine-impacted aerosols of the Bay of higher than those of WSOC in summer, whereas the situation
Bengal showed higher MAE365 values in the WSOC fraction is reversed in winter. Therefore, we infer that the different
sources and atmospheric processes would impact the distri-
Atmos. Chem. Phys., 21, 11337–11352, 2021 https://doi.org/10.5194/acp-21-11337-2021J. Tang et al.: Long-emission-wavelength chromophores dominate the light absorption of BrC 11345
bution of water-soluble and methanol-soluble chromophores. The linear regression slopes in the scatter plots of Abs365
The high temperature and humidity (Table S1) and the trop- versus WSOC or MSOC could mathematically represent the
ical monsoon climate in Thailand seem to promote more average MAE values of WSOC or MSOC at 365 nm, respec-
water-soluble chromophores over Thailand. As not all water- tively (Fig. S11a, b). The phenomenon indicates that both
insoluble components can be extracted with methanol, the fluorescence and Abs365 data point to similar relationships
observed light absorption by MSOC would therefore likely between sources or chemical processes with organic matter
reflect the lower limit. Table S3 shows a comparison of the concentrations, and therefore we attempted to link the fluo-
MAE values of Bangkok aerosols with those of other regions, rescence results to BrC absorption. It should be noted that
indicating a medium light absorption capacity. The MAE365 light-absorbing substances in atmospheric particulate matter
values of the water-soluble fraction in this study were com- are not necessarily all fluorescent, such as nitrophenol com-
parable to those of Nanjing (Chen et al., 2018), Guangzhou pounds, which are a type of BrC commonly found in the
(Liu et al., 2018), and Beijing in summer (Yan et al., 2015) atmospheric particulate matter; however, there is no strong
but lower than those of PM2.5 from Singapore (Adam et al., fluorescence signal with which to scan the nitrophenol stan-
2020), PM10 from Godavari, Nepal, in the pre-monsoon sea- dards (Chen et al., 2019a).
son (Wu et al., 2019), and smoke particles from biomass In order to evaluate the light absorption from different
burning and coal combustion (Park and Yu, 2016; Fan et al., fluorescent chromophores, we used MLR to explore the
2018; Tang et al., 2020b). Lower MAE365 values of both relationship between the fluorescence intensities of chro-
fractions were observed in the monsoon season than in the mophores and Abs365 . In this study, light absorption proper-
non-monsoon seasons, likely due to the heavy monsoon rains ties were treated as the dependent variables, and the fluores-
that effectively remove soluble gases and aerosols (Lawrence cence was an independent variable. During MLR, insignifi-
and Lelieveld, 2010) and/or reduce biomass burning activity cant fluorescent components were excluded from the regres-
(levoglucosan level in Table 1). A previous study reported sion using a stepwise screening process to avoid overfitting
similar findings in the USA in that the MAE365 was approxi- (Finclusion : p < 0.05; Felimination : p > 0.10). The MLR statis-
mately 3-fold higher in biomass-burning-impacted samples tical metrics are listed in Tables S4 and S5. For the indepen-
than in non-biomass-burning-impacted samples (Hecobian dent variables with significant correlations with the depen-
et al., 2010). Another study in the central Tibetan Plateau dent variable (p < 0.05) or with positive contributions to the
highlighted the fact that BrC emitted by biomass burning independence, Abs365 , they will be retained in the statisti-
has stronger light absorption capability than secondary BrC cal model as the efficiency factors to Abs365 . Thus, for the
formed in the atmosphere (Wu et al., 2018). On the Indo- WSOC fraction, a revised model (regression 3) equation was
China peninsula, Bangkok receives 99 % of the fire-derived used with an adjusted R 2 of 0.995. The final optimized equa-
aerosols from December to April (Lee et al., 2017), which tions were Abs365 = 0.765 × P4 + 0.051 × P2 + 0.091 × P7
may explain the high absorption levels in the non-monsoon for the WSOC fraction and Abs365 = 0.238 × C4 for the
seasons. MSOC fraction (Table S5). The model errors for water-
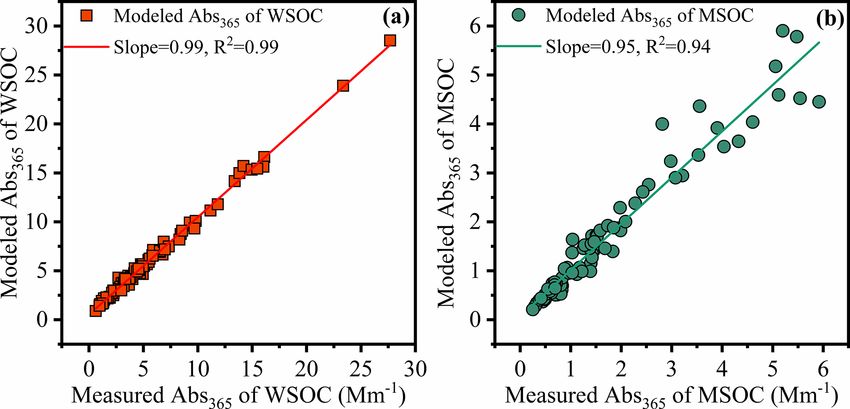
soluble and methanol-soluble Abs365 were −5.5 %–64 % and
3.4 Chromophores responsible for BrC light −34 %–58 %, respectively. The predicted Abs365 values fit
absorption the measured values well (Fig. 5; slope = 0.99 and 0.95,
R 2 = 0.99 and 0.94 for WSOC and MSOC, respectively).
EEM analysis enables the probing of the chemical structure For water-soluble BrC, the P4 component had the largest
of DOM because of its ability to distinguish among differ- coefficient with Abs365 , which was much higher than those
ent classes of organic matter (Wu et al., 2003). Generally, for P2 and P7. The C4 component had the largest coeffi-
BrC absorption is related to the chromophores within it and cient with Abs365 for methanol-soluble BrC. These results
is susceptible to change with variations in chemical proper- indicate that the light absorption by BrC is more dependent
ties, e.g., oxidation level (Mo et al., 2018), degree of unsat- on chromophores with longer emission wavelengths (P4 and
uration (Jiang et al., 2020), molecular weight (Tang et al., C4). These characteristics also indicate that the strongly ab-
2020b; Di Lorenzo et al., 2017), functional groups (Q. Chen sorbing substances in BrC probably originate from large con-
et al., 2017), and molecular composition (Song et al., 2019; jugated electron functional groups or include donor and ac-
Lin et al., 2018). The fluorescence intensity of each EEM ceptor molecules for charge–transfer interactions (Del Vec-
component was shown to be associated with light absorption chio and Blough, 2004; Cory and McKnight, 2005). Keller-
indices, such as MAE365 and AAE, of HULIS in controlled man et al. (2015) reported that these components are highly
crop-straw-combustion experiments (Huo et al., 2018). As aromatic and oxygen-rich with a high apparent molecular
a linear relationship between organic matter concentration weight. These important findings highlight the fact that larger
and fluorescence intensity can be assumed for very dilute chromophores may be the most persistent BrC species in the
samples due to the IFE (Murphy et al., 2013), we have cor- atmosphere and hence exert the greatest influence for per-
rected our fluorescence data for IFE using absorbance to en- turbing the global radiative balance.
able “clean” correlation analysis (as shown in Fig. S13a, b).
https://doi.org/10.5194/acp-21-11337-2021 Atmos. Chem. Phys., 21, 11337–11352, 202111346 J. Tang et al.: Long-emission-wavelength chromophores dominate the light absorption of BrC Figure 5. Linear correlation analysis between modeling Abs365 using multiple linear regression (MLR) analysis and measured Abs365 in the water-soluble organic carbon (WSOC, a) and methanol-soluble organic carbon (MSOC, b) in aerosols samples from Bangkok in Thailand during 2016–2017, respectively. Note that the fluorescent intensities of parallel factor (PARAFAC) model results (fluorescent components) were used as variables in MLR analysis. Figure 6. The time series of the P4 component of the WSOC (a) and C4 of the MSOC (b) in TSP samples over Bangkok in Thailand contributed by each factor resolved by positive matrix factorization. To further interpret the BrC source profiles as real-world physically reasonable source profiles (Fig. S14), including TSP sources, we examined 84 (minus one missing value) ship emissions, secondary sulfate, dust, land fossil-fuel com- TSP samples from Bangkok using the US EPA PMF5.0 bustion, sea salt, biomass burning, and industrial emissions, model. All samples were merged together to form an 84 × 30 consistent with our previous study (J. Wang et al., 2020). dataset (84 samples with 30 species). The initial data of pos- Figure S15 shows the contributions of the above sources to itive matrix factorization input were from our previous study light absorption at λ = 365 nm, which represent the fraction (J. Wang et al., 2020). We further added Abs365 values of of BrC for each factor. Biomass burning was found to be WSOC and MSOC, as well as the fluorescence intensities the main source of BrC over Bangkok: 58 % and 74 % for (in RU) of P2, P4, P7, and C4 components to the model. A water-soluble and methanol-soluble BrC, respectively. These seven-factor solution was achieved that provided the most were comparable to previous observations using a similar Atmos. Chem. Phys., 21, 11337–11352, 2021 https://doi.org/10.5194/acp-21-11337-2021
J. Tang et al.: Long-emission-wavelength chromophores dominate the light absorption of BrC                                    11347

approach in Xi’an (55 %) (C. Wu et al., 2020). The time           Data availability. The data used in this study are available in the
series of Abs365 of WSOC and MSOC contributed by fac-             Harvard Dataverse (https://doi.org/10.7910/DVN/GQ04LG, Tang,
tors shows that the high biomass burning contribution is re-      2021).
lated to the higher local fire spots (i.e., pre-hot season, hot
season, and cool season) and/or air mass from the conti-
nent (Figs. S16–S17). Jiang et al. (2021) observed increases      Supplement. The supplement related to this article is available on-
in biomass burning contributions to BrC absorption during         line at: https://doi.org/10.5194/acp-21-11337-2021-supplement.
the winter period that was dominant in continental-origin
air masses. Furthermore, the P4 and C4 components, which
                                                                  Author contributions. JiaoT, GaZ, JL, and GuZ designed the ex-
were more closely associated with Abs365 , could be mostly
                                                                  periment. JiaoT and JW carried out the measurements and analyzed
attributed to biomass burning (54 % and 70 %, respectively)       the data. JW and SB organized and performed the samplings. JianT
as shown in Fig. 6. Our previous study showed that biomass        supported the fluorescence instruments and laboratory. CT and HJ
burning accounted for a considerably large portion (mean:         supported the models. JiaoT wrote the paper. JL, GuZ, YC, YM,
26 %) of the TSP mass concentration in the same samples           BZ, XG, and GaZ reviewed and commented on the paper.
(J. Wang et al., 2020). This result suggests that biomass burn-
ing makes a significant contribution to not only particulate
matter but also BrC light absorption.                             Competing interests. The authors declare that they have no conflict
                                                                  of interest.

4   Conclusions
                                                                  Disclaimer. Publisher’s note: Copernicus Publications remains
This study presents a comprehensive analysis of water-            neutral with regard to jurisdictional claims in published maps and
and methanol-soluble chromophores in aerosol samples over         institutional affiliations.
Bangkok in Thailand during 2016–2017. EEM combined
with PARAFAC analysis showed that the identified fluo-
rescent components were humic-like and protein-like sub-          Acknowledgements. This is contribution no. IS-3042 from GIG-
stances but with different patterns in the WSOC and MSOC,         CAS.
indicating different chemical compositions. By adding three-
source fluorescence into the original PARAFAC model, we
found that chromophores with longer emission wavelengths          Financial support. This research has been supported by the Na-
in the atmosphere may be due to atmospheric chemical reac-        tional Natural Science Foundation of China (grant nos. 42030715,
tions or “aging” by both bleaching the source chromophores        41430645, and 41773120), the International Partnership Program of
and producing new chromophores. We also suggest that cau-         Chinese Academy of Sciences (grant no. 132744KYSB20170002),
tion is required when using fluorescence indices to appoint       the Guangdong Foundation for Program of Science and Tech-
                                                                  nology Research (grant nos. 2017BT01Z134, 2018A030310022,
the source of atmospheric chromophores. In addition, more
                                                                  2019B121205006, and 2020B1212060053), and the China Postdoc-
water-soluble BrC with stronger light absorption capabil-
                                                                  toral Science Foundation (grant no. 2020M682937).
ity could be extracted with ultrapure deionized water over
Bangkok (0.83 ± 0.25 vs. 0.26 ± 0.12 m2 g−1 C), and both
water-soluble and methanol-soluble BrC exhibited high light       Review statement. This paper was edited by Alex Lee and reviewed
absorption in non-monsoon seasons due to the influence of         by two anonymous referees.
biomass burning. The MLR analysis showed that the light
absorption of BrC at 365 nm in the two fractions was signif-
icantly dependent on the special fluorescent chromophores
with longer emission wavelengths that are generally highly
                                                                  References
aromatic and oxygen-rich with a high apparent molecular
weight. Positive matrix factorization model results further       Adam, M. G., Chiang, A. W. J., and Balasubramanian, R.: Insights
showed that biomass burning was the main contributor of             into characteristics of light absorbing carbonaceous aerosols
these fluorescent chromophores (up to 50 %). In summary,            over an urban location in Southeast Asia, Environ. Pollut., 257,
this study provides new insight into BrC absorption and             113425, https://doi.org/10.1016/j.envpol.2019.113425, 2020.
sources, which may promote the application of EEM spec-           Alexander, D. T. L., Crozier, P. A., and Anderson, J.
troscopy to predict and model the light absorption of BrC in        R.: Brown carbon spheres in East Asian outflow
the atmosphere.                                                     and their optical properties, Science, 321, 833–836,
                                                                    https://doi.org/10.1126/science.1155296, 2008.
                                                                  Andersson, C. A. and Bro, R.: The N-way Toolbox
                                                                    for MATLAB, Chemom. Intell. Lab. Syst., 52, 1–4,
                                                                    https://doi.org/10.1016/s0169-7439(00)00071-x, 2000.

https://doi.org/10.5194/acp-21-11337-2021                                        Atmos. Chem. Phys., 21, 11337–11352, 2021
11348 J. Tang et al.: Long-emission-wavelength chromophores dominate the light absorption of BrC Babar, Z. B., Park, J.-H., and Lim, H.-J.: Influence of NH 3 on ban Submicrometer Aerosols, Environ. Sci. Technol., 51, 8293– secondary organic aerosols from the ozonolysis and photooxida- 8303, https://doi.org/10.1021/acs.est.7b01630, 2017. tion of α-pinene in a flow reactor, Atmos. Environ., 164, 71–84, Chen, Q., Mu, Z., Song, W., Wang, Y., Yang, Z., Zhang, L., https://doi.org/10.1016/j.atmosenv.2017.05.034, 2017. and Zhang, Y. L.: Size-Resolved Characterization of the Chro- Bahram, M., Bro, R., Stedmon, C., and Afkhami, A.: Handling mophores in Atmospheric Particulate Matter From a Typical of Rayleigh and Raman scatter for PARAFAC modeling of flu- Coal-Burning City in China, J. Geophys. Res.-Atmos., 124, orescence data using interpolation, J. Chemom., 20, 99–105, 10546–10563, https://doi.org/10.1029/2019jd031149, 2019a. https://doi.org/10.1002/cem.978, 2006. Chen, Q., Wang, M., Wang, Y., Zhang, L., Li, Y., and Han, Barnard, J. C., Volkamer, R., and Kassianov, E. I.: Estimation of Y.: Oxidative Potential of Water-Soluble Matter Asso- the mass absorption cross section of the organic carbon compo- ciated with Chromophoric Substances in PM2.5 over nent of aerosols in the Mexico City Metropolitan Area, Atmos. Xi’an, China, Environ. Sci. Technol., 53, 8574–8584, Chem. Phys., 8, 6665–6679, https://doi.org/10.5194/acp-8-6665- https://doi.org/10.1021/acs.est.9b01976, 2019b. 2008, 2008. Chen, W., Westerhoff, P., Leenheer, J. A., and Booksh, K.: Fluores- Bianco, A., Minella, M., De Laurentiis, E., Maurino, V., cence excitation - Emission matrix regional integration to quan- Minero, C., and Vione, D.: Photochemical generation of tify spectra for dissolved organic matter, Environ. Sci. Technol., photoactive compounds with fulvic-like and humic-like flu- 37, 5701–5710, https://doi.org/10.1021/es034354c, 2003. orescence in aqueous solution, Chemosphere, 111, 529–536, Chen, Y. and Bond, T. C.: Light absorption by organic carbon https://doi.org/10.1016/j.chemosphere.2014.04.035, 2014. from wood combustion, Atmos. Chem. Phys., 10, 1773–1787, Bianco, A., Passananti, M., Deguillaume, L., Mailhot, G., and Brig- https://doi.org/10.5194/acp-10-1773-2010, 2010. ante, M.: Tryptophan and tryptophan-like substances in cloud Chen, Y., Ge, X., Chen, H., Xie, X., Chen, Y., Wang, J., Ye, Z., water: Occurrence and photochemical fate, Atmos. Environ., Bao, M., Zhang, Y., and Chen, M.: Seasonal light absorption 137, 53–61, https://doi.org/10.1016/j.atmosenv.2016.04.034, properties of water-soluble brown carbon in atmospheric fine 2016. particles in Nanjing, China, Atmos. Environ., 187, 230–240, Bikkina, P., Bikkina, S., Kawamura, K., Sudheer, A. K., Mahesh, https://doi.org/10.1016/j.atmosenv.2018.06.002, 2018. G., and Kumar, S. K.: Evidence for brown carbon absorption over Cory, R. M. and McKnight, D. M.: Fluorescence spectroscopy re- the Bay of Bengal during the southwest monsoon season: a pos- veals ubiquitous presence of oxidized and reduced quinones in sible oceanic source, Environ. Sci. Process Impacts, 22, 1743– dissolved organic matter, Environ. Sci. Technol., 39, 8142–8149, 1758, https://doi.org/10.1039/d0em00111b, 2020. https://doi.org/10.1021/es0506962, 2005. Birdwell, J. E. and Engel, A. S.: Characterization of dissolved or- Dasari, S., Andersson, A., Bikkina, S., Holmstrand, H., Budha- ganic matter in cave and spring waters using UV–Vis absorbance vant, K., Satheesh, S., Asmi, E., Kesti, J., Backman, J., Salam, and fluorescence spectroscopy, Org. Geochem., 41, 270–280, A., Bisht, D. S., Tiwari, S., Hameed, Z., and Gustafsson, O.: https://doi.org/10.1016/j.orggeochem.2009.11.002, 2010. Photochemical degradation affects the light absorption of water- Birdwell, J. E. and Valsaraj, K. T.: Characterization of dis- soluble brown carbon in the South Asian outflow, Sci. Adv., 5, solved organic matter in fogwater by excitation–emission ma- 1–10, https://doi.org/10.1126/sciadv.aau8066, 2019. trix fluorescence spectroscopy, Atmos. Environ., 44, 3246–3253, Del Vecchio, R. and Blough, N. V.: On the Origin of the Opti- https://doi.org/10.1016/j.atmosenv.2010.05.055, 2010. cal Properties of Humic Substances, Environ. Sci. Technol., 38, Chen, H., Liao, Z. L., Gu, X. Y., Xie, J. Q., Li, H. Z., and 3885–3891, https://doi.org/10.1021/es049912h, 2004. Zhang, J.: Anthropogenic Influences of Paved Runoff and San- Di Lorenzo, R. A., Washenfelder, R. A., Attwood, A. R., Guo, itary Sewage on the Dissolved Organic Matter Quality of Wet H., Xu, L., Ng, N. L., Weber, R. J., Baumann, K., Edger- Weather Overflows: An Excitation-Emission Matrix Parallel ton, E., and Young, C. J.: Molecular-Size-Separated Brown Factor Analysis Assessment, Environ. Sci. Technol., 51, 1157– Carbon Absorption for Biomass-Burning Aerosol at Mul- 1167, https://doi.org/10.1021/acs.est.6b03727, 2017. tiple Field Sites, Environ. Sci. Technol., 51, 3128–3137, Chen, Q., Ikemori, F., and Mochida, M.: Light Absorp- https://doi.org/10.1021/acs.est.6b06160, 2017. tion and Excitation-Emission Fluorescence of Urban Or- Fan, X., Li, M., Cao, T., Cheng, C., Li, F., Xie, Y., Wei, S., Song, ganic Aerosol Components and Their Relationship to Chem- J., and Peng, P. a.: Optical properties and oxidative potential ical Structure, Environ. Sci. Technol., 50, 10859–10868, of water- and alkaline-soluble brown carbon in smoke particles https://doi.org/10.1021/acs.est.6b02541, 2016a. emitted from laboratory simulated biomass burning, Atmos. Env- Chen, Q., Miyazaki, Y., Kawamura, K., Matsumoto, K., Coburn, iron., 194, 48–57, https://10.1016/j.atmosenv.2018.09.025, 2018. S., Volkamer, R., Iwamoto, Y., Kagami, S., Deng, Y., Fan, X., Cao, T., Yu, X., Wang, Y., Xiao, X., Li, F., Xie, Y., Ji, Ogawa, S., Ramasamy, S., Kato, S., Ida, A., Kajii, Y., W., Song, J., and Peng, P.: The evolutionary behavior of chro- and Mochida, M.: Characterization of Chromophoric Water- mophoric brown carbon during ozone aging of fine particles Soluble Organic Matter in Urban, Forest, and Marine Aerosols from biomass burning, Atmos. Chem. Phys., 20, 4593–4605, by HR-ToF-AMS Analysis and Excitation-Emission Ma- https://doi.org/10.5194/acp-20-4593-2020, 2020. trix Spectroscopy, Environ. Sci. Technol., 50, 10351–10360, Fu, P., Kawamura, K., Chen, J., Qin, M., Ren, L., Sun, Y., Wang, https://doi.org/10.1021/acs.est.6b01643, 2016b. Z., Barrie, L. A., Tachibana, E., Ding, A., and Yamashita, Y.: Chen, Q., Ikemori, F., Nakamura, Y., Vodicka, P., Kawamura, Fluorescent water-soluble organic aerosols in the High Arctic at- K., and Mochida, M.: Structural and Light-Absorption Charac- mosphere, Sci. Rep., 5, 9845, https://doi.org/10.1038/srep09845, teristics of Complex Water-Insoluble Organic Mixtures in Ur- 2015. Atmos. Chem. Phys., 21, 11337–11352, 2021 https://doi.org/10.5194/acp-21-11337-2021
You can also read