MEASUREMENT REPORT: ONLINE MEASUREMENT OF GAS-PHASE NITRATED PHENOLS UTILIZING A CI-LTOF-MS: PRIMARY SOURCES AND SECONDARY FORMATION
←
→
Page content transcription
If your browser does not render page correctly, please read the page content below
Atmos. Chem. Phys., 21, 7917–7932, 2021
https://doi.org/10.5194/acp-21-7917-2021
© Author(s) 2021. This work is distributed under
the Creative Commons Attribution 4.0 License.

Measurement report: Online measurement of gas-phase nitrated
phenols utilizing a CI-LToF-MS: primary sources and
secondary formation
Kai Song1,2 , Song Guo1,2 , Haichao Wang3 , Ying Yu1 , Hui Wang1 , Rongzhi Tang1 , Shiyong Xia4 , Yuanzheng Gong1 ,
Zichao Wan1 , Daqi Lv1 , Rui Tan1 , Wenfei Zhu1 , Ruizhe Shen1 , Xin Li1 , Xuena Yu1 , Shiyi Chen1 , Liming Zeng1 , and
Xiaofeng Huang4
1 StateKey Joint Laboratory of Environmental Simulation and Pollution Control, International Joint Laboratory for Regional
Pollution Control, Ministry of Education (IJRC), College of Environmental Sciences and Engineering, Peking University,
Beijing, 100871, China
2 Collaborative Innovation Center of Atmospheric Environment and Equipment Technology, Nanjing University of

Information Science and Technology, Nanjing, 210044, China
3 School of Atmospheric Sciences, Sun Yat-sen University, Zhuhai, 519082, China
4 Key Laboratory for Urban Habitat Environmental Science and Technology, School of Environment and Energy,

Peking University Shenzhen Graduate School, Shenzhen, 518055, China

Correspondence: Song Guo (songguo@pku.edu.cn)

Received: 19 December 2020 – Discussion started: 15 January 2021
Revised: 24 March 2021 – Accepted: 17 April 2021 – Published: 25 May 2021

Abstract. To investigate the composition, variation, and         ment results by NMF indicated the importance of combustion
sources of nitrated phenols (NPs) in the winter of Bei-          sources (> 50 %) to the gas-phase NPs. The industry source
jing, gas-phase NPs were measured by a chemical ioniza-          contributed 30 % and 9 % to DNP and MDNP, respectively,
tion long time-of-flight mass spectrometer (CI-LToF-MS).         which was non-negligible. The concentration weighted tra-
A box model was applied to simulate the secondary for-           jectory (CWT) analysis demonstrated that regional transport
mation process of NPs. In addition, the primary sources of       from provinces that surround the Yellow and Bohai seas con-
NPs were resolved by a non-negative matrix factorization         tributed more primary NPs to Beijing. Both primary sources
(NMF) model. Our results showed that secondary formation         and secondary formation at either local or regional scale
contributed 38 %, 9 %, 5 %, 17 %, and almost 100 % of the        should be considered when making control policies of NPs.
nitrophenol (NP), methyl-nitrophenol (MNP), dinitrophe-
nol (DNP), methyl-dinitrophenol (MDNP or DNOC), and
dimethyl-nitrophenol (DMNP) concentrations. The phenol–
OH reaction was the predominant loss pathway (46.7 %) dur-       1   Introduction
ing the heavy pollution episode, which produced the phe-
noxy radical (C6 H5 O). The phenoxy radical consequently re-     Nitrated phenols (NPs) refer to aromatic compounds with at
acted with NO2 and produced nitrophenol. By estimating the       least a hydroxyl (–OH) group and a nitro (–NO2 ) group. They
primarily emitted phenol from the ratio of phenol/CO from        are crucial species in forest decline (Grosjean and Williams,
freshly emitted vehicle exhaust, this study proposed that oxi-   1992; Qingguo Huang et al., 1995). In addition, NPs are im-
dation of primary phenol contributes much more nitrophenol       portant components of brown carbon with absorption prop-
(37 %) than that from benzene oxidation (< 1 %) in the win-      erties in near-UV light (Iinuma et al., 2010; Laskin et al.,
ter of Beijing. The latter pathway was widely used in models     2015; C. Lu et al., 2019a; Xie et al., 2017). As a result, NPs
and might lead to great uncertainties. The source apportion-     have been widely detected around the world in the gas and
                                                                 particle phase, in fog, cloud, rain, snow, and surface water

Published by Copernicus Publications on behalf of the European Geosciences Union.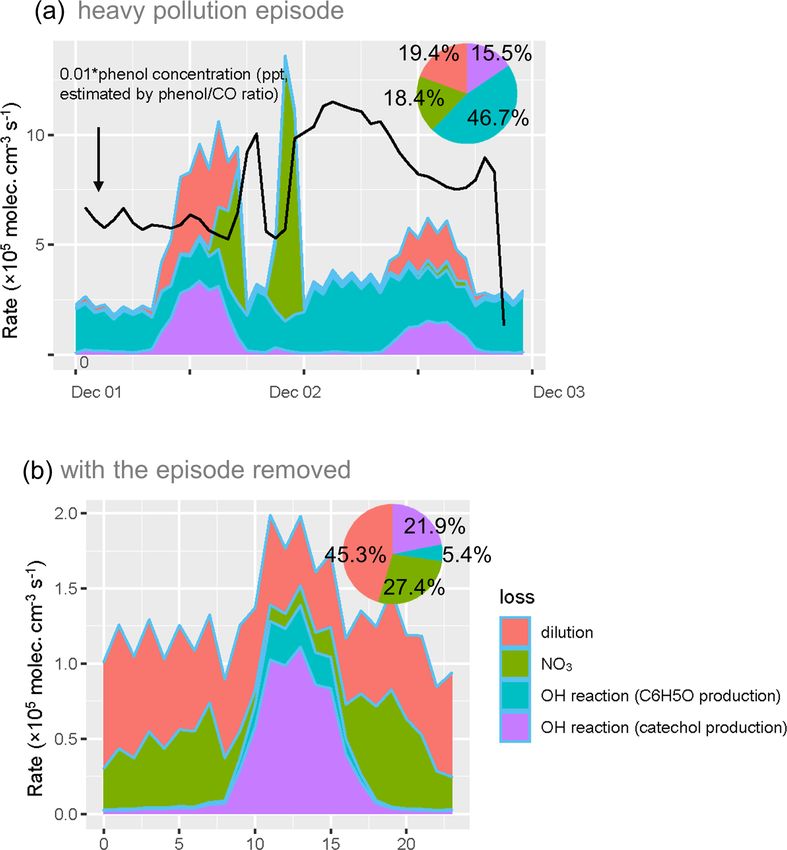
7918                                                                     K. Song et al.: Gas-phase nitrated phenols in Beijing

since the 1980s (Harrison et al., 2005). Among these stud-         mata et al., 2014; Laskin et al., 2015; Sekimoto et al., 2013).
ies, gas-phase NPs were detected in urban, suburban, and re-       To make more useful control strategies of NPs, it is of vital
mote regions (Mohr et al., 2013; Morville et al., 2006; Priest-    importance to distinguish the proportion of secondary forma-
ley et al., 2018). The concentrations of NPs varied signif-        tion of NPs from benzene and that from the oxidation of the
icantly from place to place (Harrison et al., 2005). Beijing       directly emitted phenols.
is the capital city of China which has a population of more           In the present work, we conducted high time resolution
than 20 million and more than 5 million private cars (Tang et      measurement of the gas-phase nitrated phenols using a chem-
al., 2021); yet the occurrence of gas-phase NPs in Beijing is      ical ionization long time-of-flight mass spectrometer (CI-
rarely investigated. Most of the studies in Beijing focused on     LToF-MS, CIMS) in the winter of Beijing. The secondary
particle-phase NPs (or so-called nitro-aromatic compounds,         formation process of NPs was simulated by a box model. The
NACs) (Li et al., 2020; Wang et al., 2019). The estimated gas-     primary phenol oxidation process was distinguished from
phase concentration of nitrophenol from the particle phase         benzene oxidation to investigate its role in the secondary for-
was as much as 600 ppt without direct evidence of measure-         mation of NPs. Non-negative matrix factorization (NMF) and
ment (Wang et al., 2019). Consequently, it is of vital impor-      concentration weighted trajectory (CWT) analysis were uti-
tance to identify the concentration and sources of NPs in Bei-     lized to conduct the source apportionment and identify the
jing.                                                              potential region of these sources.
   Gas chromatography–mass spectrometer (GC-MS) and
high-performance liquid chromatography–mass spectrome-
ter (HPLC-MS) instruments were commonly used to quan-              2     Materials and methods
tify the ambient concentration of NPs with accurate molecu-
lar information (Belloli et al., 1999; Harrison et al., 2005;      2.1     Measurements of nitrated phenols and other
Lüttke et al., 1997). Conversely, the pretreatment proce-                  gaseous pollutants
dure is frustrating, and the time resolution is rather low.
                                                                   2.1.1    Measurement location
The measurement of reactive atmospheric phenolic com-
pounds demands a real-time, high time resolution, and ac-          The sampling site is at an urban site, i.e., Peking University
curate method. In recent years, the chemical ionization mass       Atmosphere Environment MonitoRing Station (PKUERS;
spectrometer (CIMS) has become popular for its high ac-            39◦ 590 N, 116◦ 180 E), which is located on the campus of
curacy and time resolution (< 1 s) (Priestley et al., 2018;        Peking University. Details about this site are reported in pre-
Yatavelli et al., 2012). The oxidation routines of different or-   vious work (Guo et al., 2012, 2014; Wehner et al., 2008).
ganic compounds have been clarified by the online approach         In brief, the site is situated about 20 m a.g.l. No significant
of CIMS (Bannan et al., 2015; Mohr et al., 2013; Yuan et al.,      sources are found nearby. The compositions and variations
2016; Zheng et al., 2015). Accordingly, CIMS is a power-           of air pollutants at this site are representative of the urban
ful approach in measuring atmospheric organic compounds,           area of Beijing (Guo et al., 2020; Wang et al., 2019; Tang et
which is appropriate for the quantification of ambient NPs.        al., 2018). The measurement was conducted from 1 to 31 De-
   NPs in the atmosphere come from both primary emission           cember 2018, which was in the winter of Beijing.
and secondary formation. Coal combustion, biomass burn-
ing, and vehicle exhaust are the common sources of pri-            2.1.2    Quantification of gas-phase nitrated phenols
mary NPs emissions (C. Lu et al., 2019a, b; Wang et al.,
2017). Additionally, phenolate compounds are widely used           A chemical ionization long time-of-flight mass spectrome-
as drugs, plastics, and antioxidants (Heberer and Stan, 1997).     ter (CI-LToF-MS; Aerodyne Research, Inc.) equipped with a
Dinitrophenol (DNP) and methyl-dinitrophenol (MDNP, also           nitrate ionization source was utilized to determine the gas-
known as DNOC) have been used as pesticides for more               phase concentrations of NPs. Detailed information about the
than 50 years (Chaara et al., 2010). As a result, the pesti-       instrumentation of CIMS can be found elsewhere (Bean and
cide industry may be a probable source of DNP and MDNP             Hildebrandt Ruiz, 2016; Fang et al., 2020). Briefly, in a high-
emissions. Despite the complex primary emissions, the sec-         purity flow of nitrogen, an X-ray source was used to ionize
ondary formation of atmospheric NPs is also crucial (Har-          the reagent gas, which then entered the ion-molecule region
rison et al., 2005; Yuan et al., 2016). Photooxidation of          (IMR). Nitrated phenols reacted with these reagent ions, i.e.,
benzene, toluene, and xylene by OH and NO3 forms phe-              NO− 3 (HNO3 )0−2 , to form the product ions. Seven NPs were
nol, cresol, and xylenol, respectively. The further oxidation      quantified in the present work, i.e., nitrophenol (NP), methyl-
of these phenols results in the secondary formation of ni-         nitrophenol (MNP), dimethyl-nitrophenol (DMNP), nitro-
trophenol (NP), methyl-nitrophenol (MNP), and dimethyl-            catechol (NC), methyl-nitrocatechol (MNC), dinitrophenol
nitrophenol (DMNP) (Harrison et al., 2005). However, not           (DNP), and methyl-dinitrophenol (MDNP or DNOC). The
only do the atmospheric phenols come from the oxidation            original time resolution of the concentration of NPs was 1 s.
of aromatics, but they are also emitted directly from vehicle      The CIMS data were processed by Tofware 3.0.3 (Tofwerk
exhaust, biomass burning, and other primary sources (Ino-          AG, Aerodyne Research) in Igor Pro 7.08 (WaveMetrics Inc)

Atmos. Chem. Phys., 21, 7917–7932, 2021                                              https://doi.org/10.5194/acp-21-7917-2021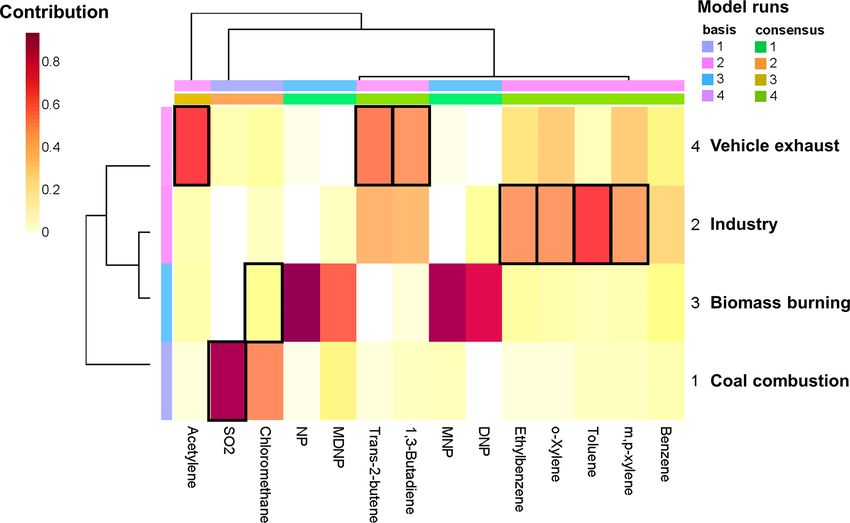
K. Song et al.: Gas-phase nitrated phenols in Beijing                                                                      7919

(Stark et al., 2015; Yatavelli et al., 2014). The chemical for-   Biobase (Huber et al., 2015), NMF (Gaujoux and Seoighe,
mula compositions of these NPs were detected by the time-         2010), and ggplot2 (Valero-Mora, 2010).
of-flight mass spectrometer (ToF-MS). See more detail in
Fig. S1 in the Supplement.                                        2.2.1   Estimation of secondary formation of nitrated
                                                                          phenols by a box model
2.1.3    Calibration of gas-phase nitrated phenols

The calibration of CIMS is challenging because of the wide        The secondary formation process of NPs was simulated by
detection range of CIMS and unknown molecular structures          a zero-dimensional box model equipped with the Master
of the compound detected by the ToF-MS (Priestley et al.,         Chemical Mechanism (MCMv3.3.1; http://mcm.york.ac.uk/
2018). In this study, we used a Dynacalibrator® permeator         home.htt, last access: 2 March 2021). The related mechanism
(Modle 500, VICI, MetronIcs Inc.) to generate nitrophenol         is presented in Fig. 1. Water vapor, temperature, pressure,
standard gas with high stability and accuracy. The perme-         and the concentration of NO, NO2 , O3 , and CO were used
ation rate of the NP permeation tube (Dynacal® , VICI) is         to constrain the model simulation in all scenarios. The ba-
97 ng min−1 . The standard gas-phase nitrophenol was mixed        sic model constrained the concentration of benzene, toluene,
with 2–15 L min−1 synthetic air in the permeator to create        and xylene measured by an online GC-MS/FID. This basic
different concentrations and then was diluted by 8 L min−1        model illustrated the secondary formation process of the NPs
synthetic air. The calibration curve was made by plotting the     from the oxidation of aromatic hydrocarbons. However, less
actual gas-phase NP concentration as the function of ion sig-     than 1 % of the total nitrophenol (NP) concentration could
nals detected. The uncertainty in quantifying other NPs from      be explained (Fig. S3 in the Supplement), which was incon-
the sensitivity of NP ranged from −26 % to 22 % (Schwantes        sistent with the estimation from the NP/CO ratio in other
et al., 2017; Yuan et al., 2016). The addressed NPs calibrated    studies (Inomata et al., 2013; Sekimoto et al., 2013), im-
by NP were correct in concentration levels and magnitudes.        plying there are probably missing sources of phenol. For
See more detail in Fig. S2 in the Supplement.                     instance, nitrophenol not only comes from the benzene–
                                                                  phenol–nitrophenol oxidation pathway, but it also originates
2.1.4    Supplementary measurements                               from the oxidation of directly emitted phenol (so-called pri-
                                                                  mary phenol). As a result, we constrained the phenol concen-
Relative humidity (RH) and temperature (T ) were measured         tration rather than benzene to investigate the nitrophenol for-
by Met One Instruments, Inc. at the PKUERS site. NO–              mation from primary phenol. As the concentration of primary
NO2 –NOx gas analyzers (Thermo Fisher Scientific, model           phenol was not determined in this study, we used the ratio of
42i-TLE) and a UV photometric O3 analyzer (Thermo Fisher          phenol/NOy (0.3 ppt ppb−1 ) and phenol/CO (0.4 ppt ppb−1 )
Scientific model 49i) were utilized to measure the concentra-     from fresh emitted vehicle exhaust (Inomata et al., 2013;
tion of NO, NO2 , NOx , and O3 . Volatile organic compounds       Sekimoto et al., 2013). Atmospheric CO is inert so that the
(VOCs) were measured by an online gas chromatography              VOC to CO ratio is widely used to quantify anthropogenic
system equipped with a mass spectrometer and a flame ion-         emissions (Li et al., 2019). The estimation of phenol from
ization detector (online GC-MS/FID; Tianhong, China) (Liu         the phenol/CO ratio showed good agreement in trend and
et al., 2005; Shao et al., 2009). In total, 98 kinds of VOCs      concentration level (Fig. S3). The estimated phenol concen-
were measured, including alkanes, alkenes, aromatics, acety-      tration in this approach was comparable to the measured con-
lene, and oxygenated volatile organic compounds (OVOCs).          centration from other sites (Table 1). As a result, the budget
Detailed information of these VOCs can be found elsewhere         analysis and the source apportionment were composed based
(Yu et al., 2021; Yuan et al., 2013).                             on the constrained results of estimated phenol concentration
                                                                  by the ratio of phenol/CO.
2.2     Estimation of primary sources and secondary
        formation of nitrated phenols
                                                                  2.2.2   Source apportionment of nitrated phenols by
Overall, a zero-dimensional box model equipped with the                   non-negative matrix factorization (NMF)
Master Chemical Mechanism (MCMv3.3.1) was utilized to
simulate the secondary formation process of NPs. NPs from         In this work, a non-negative matrix factorization (NMF) ap-
the oxidation of primary phenol and benzene were appor-           proach was used to estimate the primary contributions of
tioned. The primary emission was calculated by the subtrac-       NPs. The total primary NPs were calculated by subtract-
tion from the total measured concentration and then resolved      ing the secondary NPs from the box model by the total
by non-negative matrix factorization (NMF). The concentra-        NPs. NMF is a model that is good at dealing with multi-
tion weighted trajectory (CWT) analysis was also utilized to      dimensional data and shares the same principle with the
identify the source regions of the regional transport.            well-known positive matrix factorization (PMF). In princi-
   The data were analyzed by R 3.6.3 (R Core Team, 2015),         ple, NMF decomposes a matrix X (the concentration matrix)
including the packages openair (Ropkins and Carslaw, 2012),       into two non-negative matrices W (the source contribution

https://doi.org/10.5194/acp-21-7917-2021                                           Atmos. Chem. Phys., 21, 7917–7932, 2021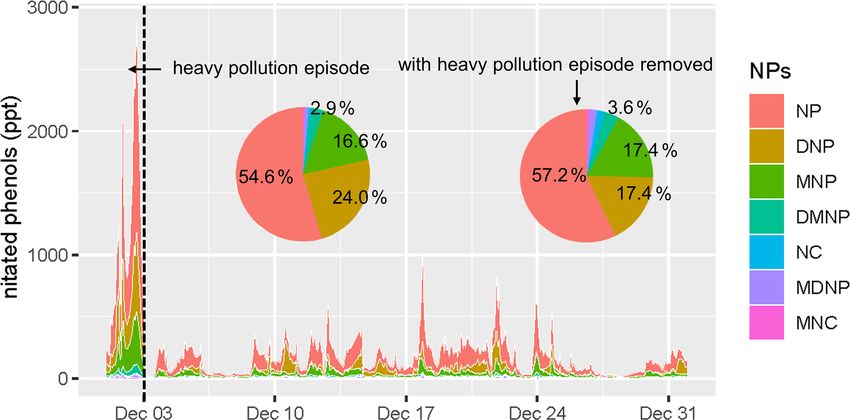
K. Song et al.: Gas-phase nitrated phenols in Beijing
https://doi.org/10.5194/acp-21-7917-2021
Table 1. The concentration of phenol and nitrated phenols (NPs) in different sampling sites and their site categories, sampling time, and analytical methods (ng m−3 ).
Sampling site Site category Sampling time Method Phenol NP DNP MNP DMNP NC MDNP MNC References
Strasbourg area, urban and rural sites annual mean GC-MS 0.4–58.7 0.01–2.2 5.6 2.6 0.1–0.3a 1
France
Rome, Italy downtown winter–spring GC-MS 14.3 13.9 2.0 (1.0)b 2
Great Dun Fell, remote site spring GC-MS 14–70 2–41c 0.1–8.5 0.2–6.6 3
UK
Beijing, China regional site spring LC-MS 143–566d 7.1–62e 0.06–0.79f 0.017g 4
Milan, Italy polluted urban site summer HPLC 400 300 5
Northern dairy farms autumn–winter TD-GC 3000–50 000 6
Sweden
Manchester, UK with bonfire plume re- autumn–winter ToF-CIMS 780 630 7
moved
Ottawa, Canada selected dwelling sites winter TD-GC-MS 10–1410 8
Santa Catarina, near a coal-fired power winter GC-FID 980–1600 9
Brazil station
Switzerland urban site winter GC-MS 40 350h 250i 50j 10
Manchester, UK measured during the winter ToF-CIMS 3700 3600 7
bonfire night
Atmos. Chem. Phys., 21, 7917–7932, 2021
Detling, UK rural site winter MOVI-HR 0.02 3 5 2.5 8.2 11
ToF-CIMS
Beijing, China urban site winter ToF 63k 606.3 243.5 203.5 46.2 22.1 26.0 10.4
(this study) CIMS 1013l (511.1) (339.6) (156.6) (32.6) (12.4) (25.8) (6.3)
The estimated concentrations are displayed in bold. Standard variations are displayed in brackets. Nitrated phenols investigated in this study referred to nitrophenol (NP), dinitrophenol (DNP), methyl-nitrophenol (MNP), dimethyl-nitrophenol (DMNP),
nitrocatechol (NC), methyl-dinitrophenol (MDNP), and methyl-nitrocatechol (MNC).
Symbols: a gas + particle phase; b 2,6-dimethyl-4-nitrophenol; c 2/4-nitrophenol; d 4NP, estimated; e 2M4NP + 3M4NP, estimated; f 4NC, estimated; g 3M6NC + 3M5NC + 4M5NC, estimated; h 2-nitrophenol; i 3M2NP + 4M2NP; j 2,4-dinitro-6-methyl
phenol; k estimated by 0.3NOy ; l estimated by 0.4CO.
References: 1: Delhomme et al. (2010). 2: Cecinato et al. (2005). 3: Lüttke et al. (1997). 4: Wang et al. (2019). 5: Belloli et al. (1999). 6: Sunesson et al. (2001). 7: Priestley et al. (2018). 8: Zhu et al. (2005). 9: Moreira Dos Santos et al. (2004). 10: Leuenberger
et al. (1988). 11: Mohr et al. (2013).
7920
K. Song et al.: Gas-phase nitrated phenols in Beijing                                                                             7921

Figure 1. Mechanism related to the secondary formation of the nitrated phenols (NPs) in MCM 3.3.1 applied in this study. Different model
scenarios differed in the constraints of the precursors. The basic model constrained the concentration of benzene by measurement from
an online GC-MS/FID. The other model scenarios constrained primary phenol concentration rather than benzene estimated by the ratio of
phenol/NOy or phenol/CO from fresh vehicle exhaust.

matrix) and H (the source profile matrix) (Devarajan, 2008).          where D is the Kullback–Leibler (KL) divergence utilized in
                                                                      this study:

X ≈ WH,                                                       (1)
                                                                                              X            ai,j
                                                                      D : A, B 7−→ KL(A||B) =        a log
                                                                                                  i,j i,j
                                                                                                                − ai,j + bi,j . (3)
                                                                                                           bi,j

where X, W, and H are n × p, n × r, and r × p non-negative            R(W, H) is an optional regularization function enforcing the
matrices, and r is a positive integer that indicates the number       constraints of W and H (Gaujoux and Seoighe, 2015).
of the factors.                                                          NMF has been widely used in facial pattern recognition
   The approach of NMF is to minimize the estimation of W             (Lee and Seung, 1999), signal and data analytics (Fu et al.,
and H:                                                                2019), and computational biology (Devarajan, 2008). Strictly
                                                                      speaking, PMF is a specific NMF model used in environmen-
                                                                      tal sciences (Paatero and Tapper, 1994). In recent years, NMF
 min [D(X, WH) + R(W, H)],                                    (2)     has turned out to be a powerful technique to distinguish oxy-
W,H≥0|       {z         }
                =F (W,H)                                              genated organic compounds from numerous urban sources

https://doi.org/10.5194/acp-21-7917-2021                                                Atmos. Chem. Phys., 21, 7917–7932, 2021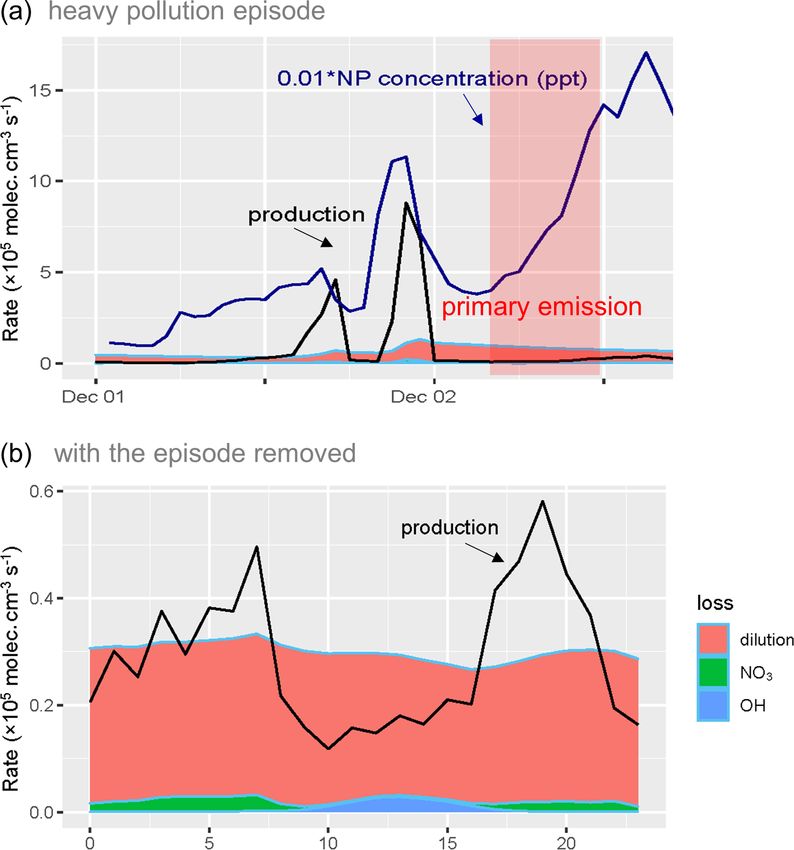
7922                                                                       K. Song et al.: Gas-phase nitrated phenols in Beijing

(Karl et al., 2018). Compared with PMF, the NMF approach               170 ± 132 ppt, while nitrophenol (NP) was the predominant
is equipped with more algorithms for matrix factorization,             species, with a concentration of 662 ± 459 ppt (55 %) and
e.g., brunet (Brunet et al., 2004), lee (Lee and Seung, 2001),         97 ± 83 ppt (57 %), respectively. To compare the representa-
nsNMF (Pascual-Montano et al., 2006), and other methods                tive concentrations of NP all around the world, we evaluated
listed on the NMF vignette (Gaujoux and Seoighe, 2015).                the concentration in Beijing (with the episode removed) and
In addition, the cophenetic coefficient is a fundamental way           other cities in Table 1. The concentrations were converted
to give the optimal choice of factorization rank r, while the          to nanograms per cubic meter (ng m−3 ), with the aim of a
consensus map approach avoids overfitting. The advantage               wide-ranging comparison. From Table 1, it is noticeable that
of NMF is the convincing factor choice rather than the ca-             the concentrations of NPs ranged extensively from time to
sual selection by PMF.                                                 time, with relatively higher values in winter. As for sampling
                                                                       sites, urban sites and those influenced by biomass burning
2.2.3    Concentration weighted trajectory (CWT)                       were more likely to be polluted by NPs. Different analyti-
         analysis                                                      cal methods showed discrepancies; this might be clarified by
                                                                       their distinct instrumental principles. Likewise, the concen-
Back trajectory analysis was accomplished by the interface             trations of NPs in Beijing were higher than those in rural and
of HYSPLIT (Rolph et al., 2017; Stein et al., 2015) and R.             remote sites. Nevertheless the concentrations of NPs were
The primary source resolved by NMF was then distinguished              much lower than the sites that were influenced by biomass
by the concentration weighted trajectory (CWT) approach                burning (Priestley et al., 2018). The concentration of gas-
(Seibert et al., 1994) in an attempt to identify the location          phase DNP in Beijing was considerably higher than that of
of the probable source. The CWT calculated the logarithmic             other sites.
mean concentration of NPs for every grid as the Eq. (4). Nor-             Composition of NPs in Beijing during the episode and the
mally, a high value of C¯ij indicates higher concentration at          rest period showed no significant difference, except that the
the grid (i, j ).                                                      proportion of DNP was 24 % during the episode and 17 %
                                                                       without the episode, respectively (Fig. 2). In contrast, a large
          1 XN
ln Cij = PN       k
                    ln(ck )τij k ,                              (4)    proportion of MNP (comparable to nitrophenol) was found in
          k τij k                                                      other cities (Cecinato et al., 2005; Leuenberger et al., 1988;
                                                                       Priestley et al., 2018). The non-negligible secondary forma-
where i and j are the indices of the grid cell (i, j ), k and N
                                                                       tion of nitrophenol from phenol oxidation was a plausible
are the trajectory index and the total number of trajectories,
                                                                       explanation for the higher concentration of DNP in Beijing.
ck is the concentration of NPs when trajectory k passes by,
                                                                          The diurnal variations of NPs were exhibited in Fig. 3. In-
and τij k is the resistance time of trajectory k in the cell (i, j )
                                                                       terestingly, NPs with different functional groups revealed dif-
(Ropkins and Carslaw, 2012).
                                                                       ferent diurnal patterns. Nitrophenol (NP), MNP, and DMNP
                                                                       (NPs with one –OH group and one –NO2 group) demon-
3     Results and discussions                                          strated higher concentrations at night and lower concentra-
                                                                       tions during the day. The strong loss of gas-phase NPs due
3.1     Overview of the meteorological conditions and air              to photolysis or OH reaction during the daytime (Harrison et
        pollutants                                                     al., 2005; Yuan et al., 2016) might be a plausible explana-
                                                                       tion. Additionally, the stable boundary layer at night might
The measurement started with a heavy pollution episode                 cause the accumulation of NPs as well. This indicated consis-
from 1 to 2 December, with an average wind speed of                    tency with the studies carried out during the UBWOS 2014
0.61 m s−1 , an average RH of 63 %, and average concen-                campaign (Yuan et al., 2016). Nonetheless, NC and MNC
tration of PM2.5 , NOy , and CO of 166 µg m−3 , 118 ppb,               (NPs with two –OH groups and one –NO2 group) displayed
and 1912 ppb, respectively. The average concentration of               a small peak at about 10:00 and revealed high concentrations
PM2.5 , NOy , and CO with the heavy pollution removed was              at night. DNP and MDNP (NPs with one –OH group and
37 µg m−3 , 49 ppb, and 598 ppb, respectively. The average             two –NO2 groups) displayed distinct patterns from either NP
wind speed from 3 to 31 December was 1.96 m s−1 , and the              or NC. DNP accumulated during the afternoon and began to
average RH was 20 %. The heavy pollution episode was ac-               decline after 17:00, suggesting that NO3 oxidation of DNP
companied by high relative humidity and slow wind speed.               might be a non-negligible sink. The diurnal profile of MDNP
The time series of wind speed, RH, PM2.5 , NOy , and CO                did not vary much during the whole day, with a slight in-
during the whole sampling period can be found in Fig. S4 in            crease at night.
the Supplement.
   The concentration and composition of gas-phase NPs dur-
ing the measurement are displayed in Fig. 2. The average
concentrations of NPs (total nitrated phenols) during and
without the heavy pollution episode were 1213±769 ppt and

Atmos. Chem. Phys., 21, 7917–7932, 2021                                                  https://doi.org/10.5194/acp-21-7917-2021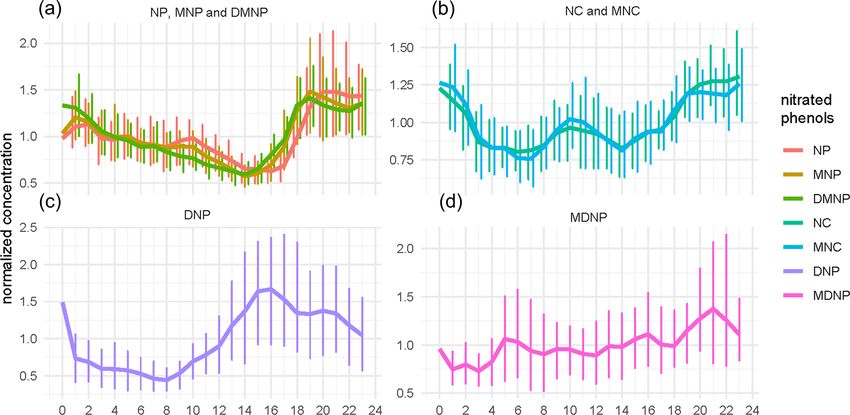
K. Song et al.: Gas-phase nitrated phenols in Beijing                                                                             7923

Figure 2. Time series (local time) and compositions of nitrated phenols (NPs) during the heavy pollution episode (1 and 2 December)
and with the heavy pollution episode removed (3 to 31 December). NPs in the legend referred to nitrophenol (NP), dinitrophenol (DNP),
methyl-nitrophenol (MNP), dimethyl-nitrophenol (DMNP), nitrocatechol (NC), methyl-dinitrophenol (MDNP), and methyl-nitrocatechol
(MNC).

Figure 3. Diurnal profiles of nitrated phenols (NPs) with 95 % confidence interval shown by the error bars. The concentration of NPs was
normalized by their mean values. (a) Diurnal profiles of nitrophenol (NP), methyl-nitrophenol (MNP), and dimethyl-nitrophenol (DMNP).
These are NPs with one –OH group and one –NO2 group. (b) Diurnal profiles of nitrocatechol (NC) and methyl-nitrocatechol (MNC). These
are NPs with two –OH groups and one –NO2 group). Diurnal profiles of (c) dinitrophenol (DNP) and (d) methyl-dinitrophenol (MDNP).
These are NPs with one –OH group and two –NO2 groups.

3.2   Estimation of secondary formation and budget of                    Overall, the secondary formation accounted for 38 %, 9 %,
      nitrated phenols                                                5 %, and 17 % for ambient nitrophenol (NP), MNP, DNP,
                                                                      and MDNP respectively. Almost 100 % of DMNP could be
In this section, gas-phase nitrophenol (NP), MNP, DMNP,               explained by the oxidation of xylenes. The simulation re-
DNP, and MDNP were taken into account because of their                sults can be found in Fig. S3. For nitrophenol, the simula-
higher concentrations and larger fractions in the gas phase.          tion of the basic model and with primary phenol estimated
The concentrations of gas-phase NC and MNC were rather                by NOy was quite similar (both the contributions of these
low (< 4 % that of nitrophenol) in this study, and they were          two model scenarios were less than 1 %). When considering
found mainly in the particle phase (Wang et al., 2019). As            the primary emission of phenol by the ratio of phenol/CO
a result, they were excluded from the box model results and           (see Sect. 2.2.1), significant improvement of NP was found
the source apportionment.                                             (37 %). The results indicated a sensitivity of NP production

https://doi.org/10.5194/acp-21-7917-2021                                                Atmos. Chem. Phys., 21, 7917–7932, 2021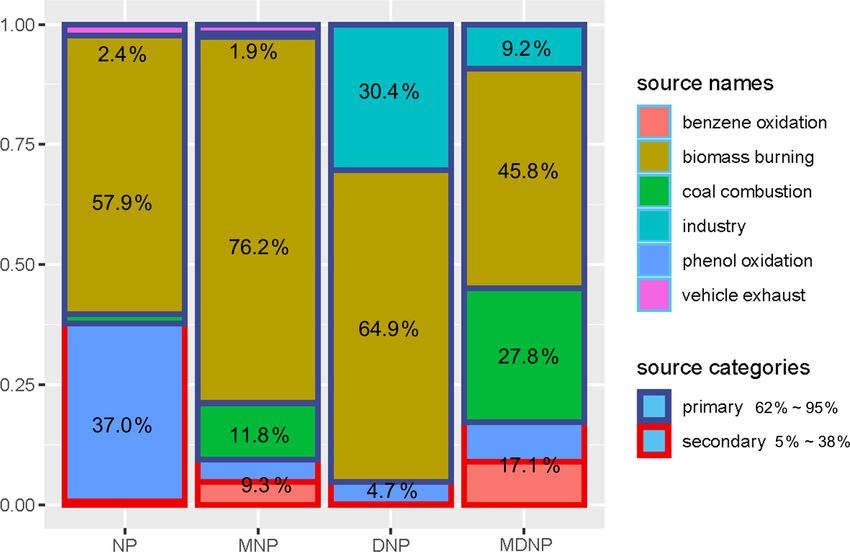
7924 K. Song et al.: Gas-phase nitrated phenols in Beijing
from the primarily emitted phenol so that when NP control The production and loss of xylenol displayed peaks at 12:00
policies are made, it is of vital importance to control the and 13:00 respectively. Xylenol mainly accumulated at noon.
emission of phenol rather than the classical precursor, i.e., The reactions with OH and NO3 radicals accounted for
benzene. Meanwhile, the nonlinear effect of oxidation capac- 42.6 % and 42.5 % of the loss of xylenol. The OH reaction
ities and radical concentration might result in an improve- pathway was the predominant loss of xylenol during the day-
ment of MNP or MDNP when phenol is constrained. The time and resulted in the formation of DMNP. The produc-
model results of MDNP did not vary much as the xylene– tion of DMNP increased rapidly from the xylenol–NO2 reac-
xylenol–MDNP pathways can explain most of the secondary tion during the daytime and decreased from noon. The loss
formation pathways of MDNP. of DMNP increased during the afternoon and started to de-
crease after 18:00. DMNP mainly originated from the sec-
3.2.1 Production and loss of phenol and nitrophenol ondary formation process, and its accumulation mainly took
place in the afternoon, while nitrophenol mainly occurred at
Time series and diurnal profile of the loss of phenol dur- night, which was mainly derived from primary emission.
ing and without the heavy pollution episode were shown in
Fig. 4. It was obvious that the OH loss mainly took place 3.3 Source apportionment of primarily emitted
during the day, while NO3 loss mainly happened at night. nitrated phenols and the impact of regional
However, the fraction of these two pathways diverged dra- transport
matically when taking the episode into account. During the
heavy pollution episode, 46.7 % of phenol was lost from The NMF approach equipped with Brunet, KL, offset, lee,
the pathway of the OH reaction, which caused the produc- nsNMF, and snmf/l algorithms was used to investigate the
tion of the phenoxy radical (C6 H5 O). C6 H5 O then reacted sources of primary emitted NPs. These different algorithms
with NO2 and formed nitrophenol (Berndt and Böge, 2003). were used to choose a better calculation method for the
With the heavy pollution episode removed, the proportion source apportionment. The consensus maps of the simulation
of the C6 H5 O production pathway of the OH reaction was are displayed in Fig. S5 in the Supplement. The KL approach
only 5.4 %. The phenol–OH reaction which produced cate- was chosen because of its well-estimated pattern. In addition,
chol (which then reacted with OH/NO3 and NO2 to produce three to seven factors were tested by NMF so as to get an op-
NC) was the predominant OH reaction (21.9 %). The distinct timal one. The NMF rank survey is shown in Fig. S6 in the
pattern of the phenol–OH pathway which formed C6 H5 O in- Supplement, in which four factors were chosen.
dicated a probable source of the nitrophenol accumulation The mixture coefficients of KL algorithm with factor 4 are
during the heavy pollution episode. The high atmospheric re- displayed in Fig. 7. SO2 was the tracer of factor 1, while
activity and oxidation capacity in Beijing (K. Lu et al., 2019; aromatics (mainly toluene, xylene, and ethylbenzene) were
Yang et al., 2020) might be the foundation of high potential markers of factor 2. Chloromethane was the tracer of factor
reactivity between phenol and the OH radical. 3, while acetylene, trans-2-butene, and 1,3-butadiene were
The production of nitrophenol displayed two peaks at markers of factor 4. The diurnal patterns of the resolved
about 08:00 and 18:00, while the loss remained unchanged sources are displayed in Fig. S7 in the Supplement. Com-
throughout the whole day. The accumulation of nitrophe- bined with results from the markers and the diurnal profiles
nol mainly occurred in the afternoon and at night (Fig. 5). of the sources, we identified these factors as coal combustion,
The simulation during the heavy pollution episode indicated industry, biomass burning, and vehicle exhaust. As 30.4 % of
a strong primary emission on the afternoon of 2 December. DNP and 9.2 % of MDNP came from factor 2, the pesticide
The production rate of nitrophenol from 12:00 to 20:00 on industry was the most probable contributor.
2 December was lower than 105 molec. cm−3 s−1 , with a con- The source contribution of NPs combining primary emis-
centration of 1357 ppt, while that during the same period on sion and secondary formation is displayed in Fig. 8. 58 %
1 December was higher than 2.5×10⁵ molec. cm−3 s−1 , with of the total NP concentration originated from biomass burn-
a concentration of 434 ppt. The underestimation of the box ing, while 2.4 % was derived from vehicle exhaust. A total
model indicated the occurrence of other sources during the of 76.2 %, 11.8 %, and 1.9 % of the total MNP concentra-
afternoon of 2 December, when primary emissions might be tion came from biomass burning, coal combustion, and ve-
probable. hicle exhaust, respectively. As for DNP and MDNP, despite
64.9 % and 45.8 % of them being derived from biomass burn-
3.2.2 Impact of secondary formation on ing, 30.4 % and 9.2 % of DNP and MDNP concentrations re-
dimethyl-nitrophenol sulted from industrial emissions. This suggests that the pesti-
cide industry was still an important source of dinitrophenols.
The box model simulation of DMNP signified the impor- When coal combustion and biomass burning were re-
tance of secondary formation. Production and loss of xylenol garded as combustion sources, the four-factor results of
and DMNP were shown in Fig. 6. The production and loss NMF, as well as the same species in PMF, were compara-
showed no distinct patterns during and without the episode. ble (Fig. S8 in the Supplement). The combustion source ac-
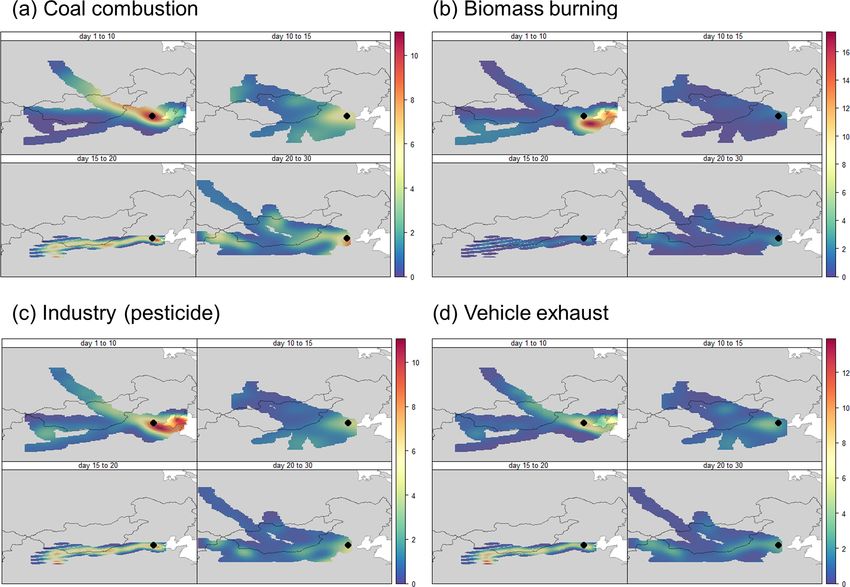
Atmos. Chem. Phys., 21, 7917–7932, 2021 https://doi.org/10.5194/acp-21-7917-2021K. Song et al.: Gas-phase nitrated phenols in Beijing 7925 Figure 4. Time series and the loss rate of phenol during the heavy pollution episode (a) and diurnal profile of the loss of phenol with the heavy pollution removed (b). counts for 61.5 %, 91 %, 10.2 %, and 38 % of NP, MNP, DNP, and was more likely to be influenced by primary emission and MDNP concentration, respectively. Meanwhile, 80.1 % which came from regional transport nearby. and 45.3 % of DNP and MDNP concentrations were derived In this study, the concentration weighted trajectory (CWT) from industry. was used to identify the probable source of these primary Overall, the contribution of primary emission was more emissions. Considering the different pollution patterns of important than secondary formation during the measurement. the sampling period as well as the amount of data for in- Among all sources, combustion was the predominant one terpolation in CWT, we divided the sampling period into (> 50 % of total NPs concentration), which was consistent four sub-periods, i.e., 1–10, 10–15, 15–20, and 20–30 De- with other studies focusing on the sources of particulate mat- cember. CWT analysis was conducted for each period, and ter (PM) in the winter of Beijing (Fan et al., 2018; Lyu the results are displayed in Fig. 9. Strong regional transport et al., 2019; Xu et al., 2018). This result was different from was observed during the first period. The biomass burning the study carried out during the UBWOS 2014 (Yuan et al., and industry sources mainly originated from provinces sur- 2016), in which less than 2 % of NP concentration came rounding the Yellow and Bohai seas (especially the city of from combustion sources. UBWOS 2014 was carried out at Tianjin and Shandong Province). Cities located in this area an oil and gas production site abundant in the precursors of have a long history of pesticide production and use and have NPs, i.e., VOCs (such as benzene and toluene) and NOx . been reported to reveal a relatively high residual concentra- Therefore, the secondary process was indeed the predomi- tion of pesticide (Li et al., 2018). As for the vehicle exhaust nant one in UBWOS 2014. By contrast, the PKUERS site source, local emissions were predominant. The coal combus- was far away from industrial zones and combustion sources tion source mainly came from Inner Mongolia, which was the https://doi.org/10.5194/acp-21-7917-2021 Atmos. Chem. Phys., 21, 7917–7932, 2021
7926                                                                      K. Song et al.: Gas-phase nitrated phenols in Beijing

                                                                      most coal-abundant area across China (Lv et al., 2020). The
                                                                      CWT analysis proved the accuracy of NMF source appor-
                                                                      tionment and demonstrated the importance of regional trans-
                                                                      port when control strategies of NPs are made.
                                                                         The estimation of secondary formation and primary emis-
                                                                      sion of NPs in this study faced uncertainties, as detailed be-
                                                                      low. The simulation of NPs in this study was restricted by
                                                                      the estimation of phenol and the mechanisms of MCM, as
                                                                      well as the simulation of the NO3 radical in winter. The box
                                                                      model results of NPs were not identical to secondary forma-
                                                                      tion, and the estimation of primary emissions by subtracting
                                                                      the NPs from the box model results by the total concentra-
                                                                      tion remained uncertain. The main missing reaction pathway
                                                                      in this study is the gas–particle partitioning of NPs. Accord-
                                                                      ing to Wang et al. (2019), the estimated proportions of gas-
                                                                      phase NP, MNP, and DMNP in Beijing were 99.2 %, 94.9 %,
                                                                      and < 1 %, respectively. Simulation of NP and MNP without
                                                                      gas–particle partitioning pathways faced small uncertainties
                                                                      as they mainly occurred in the gas phase. The small propor-
                                                                      tion of DMNP in the gas phase and rather low concentration
                                                                      in the particle phase (0.55 ng m−3 , Wang et al., 2019) made
                                                                      the missing pathway not important. Meanwhile, gas-phase
                                                                      DMNP mainly came from secondary formation in this study,
                                                                      and the concentration level of DMNP could be explained
Figure 5. Time series of production and loss of nitrophenol (NP)      well by the box model. As a result, the missing pathway of
during the heavy pollution episode (a) and diurnal profiles of pro-   gas–particle partitioning may not be important in this study.
duction and loss of NP with the heavy pollution removed (b).

                                                                      4   Conclusions

                                                                      Gas-phase nitrated phenols (NPs) were measured using a
                                                                      CI-LToF-CIMS in the winter of Beijing. The total concen-
                                                                      tration of NPs in winter of Beijing was 1158 ± 892 ng m−3 ,
                                                                      which was higher than that in most of the rural and remote
                                                                      sites all around the world. Nitrophenol was the predomi-
                                                                      nant compound, with an average concentration of 606.3 ±
                                                                      511.1 ng m−3 . Strong diurnal patterns were observed, and
                                                                      NPs with different functional groups varied significantly. Ni-
                                                                      trophenol displayed higher concentration at night and lower
                                                                      concentration during the day. A box model was utilized to
                                                                      simulate the secondary formation of NPs. 38 %, 9 %, 5 %,
                                                                      17 %, and almost 100 % of the ambient nitrophenol (NP),
                                                                      MNP, DNP, MDNP, and DMNP could be explained by the
                                                                      oxidation of aromatic precursors. The oxidation of primary
                                                                      phenol estimated by the ratio of phenol/CO from fresh vehi-
                                                                      cle exhaust accounted for 37 % of the total nitrophenol, while
                                                                      < 1 % might be explained by the oxidation of benzene. The
                                                                      latter pathway was widely used in models and might lead to
                                                                      great uncertainties as the primarily emitted phenol was not
                                                                      considered. Meanwhile, control strategies that focus on the
                                                                      primarily emitted phenol might be more important than ben-
Figure 6. Production and loss of xylenol (a) and DMNP (b) during      zene when control schemes of NPs are made. Additionally,
the sampling period.                                                  during the heavy pollution episode, 46.7 % of phenol was lost
                                                                      from the pathway of the OH reaction to form the phenoxy
                                                                      radical (C6 H5 O). The phenoxy radical consequently reacted

Atmos. Chem. Phys., 21, 7917–7932, 2021                                                 https://doi.org/10.5194/acp-21-7917-2021
K. Song et al.: Gas-phase nitrated phenols in Beijing 7927 Figure 7. Mixture coefficients of the Kullback–Leibler (KL) algorithm with four factors by non-negative matrix factorization (NMF). Factor 1: coal combustion; factor 2: industry (pesticide); factor 3: biomass burning; factor 4: vehicle exhaust. “Basis” and “consensus” in the legend were the model runs, and the results are displayed in the heatmap. Figure 8. Contribution of primary emission (in dark blue border) and second formation (in red border) of nitrated phenols. Primary emission was classified as biomass burning, coal combustion industry, and vehicle exhaust, which were resolved by non-negative matrix factorization (NMF). NPs in the legend referred to dinitrophenol (DNP), methyl-dinitrophenol (MDNP), methyl-nitrophenol (MNP), and nitrophenol (NP). Secondary formation of nitrophenol was categorized as benzene oxidation (< 1 %) and the oxidation of primarily emitted phenol (phenol oxidation, 37 %). It was noticeable that nitrophenol derived from the primary phenol oxidation was much more important than the pathway from traditional benzene oxidation in the winter of Beijing. https://doi.org/10.5194/acp-21-7917-2021 Atmos. Chem. Phys., 21, 7917–7932, 2021
7928                                                                        K. Song et al.: Gas-phase nitrated phenols in Beijing

Figure 9. Concentration weighted trajectory (CWT) analysis of the sources resolved by non-negative matrix factorization (NMF), i.e., coal
combustion (a), biomass burning (b), industry (c), and vehicle exhaust (d).

with NO2 and produced nitrophenol. During the non-polluted             Data availability. The data used in this publication can be accessed
period, the reaction that produced catechol (then produced             upon request to the corresponding author (songguo@pku.edu.cn).
NC) was the predominant phenol loss pathway by OH re-
action (21.9 %). This stressed that the phenol–C6 H5 O path-
way might play a role in the nitrophenol accumulation during           Supplement. The supplement related to this article is available on-
the heavy pollution episode. Primary source apportionment              line at: https://doi.org/10.5194/acp-21-7917-2021-supplement.
was conducted by the NMF (KL algorithm) model with four
factors. Combustion was the predominant source of primary
NPs; yet 30.4 % of DNP and 9.2 % of MDNP were from non-                Author contributions. SG designed the study. RT, SX, and HW col-
                                                                       lected the samples. KS analyzed the samples and processed the data.
combustion sources, i.e., industry. The CWT analysis indi-
                                                                       SG and HW constructed the paper, and KS wrote the paper, with
cated a probable regional transport of combustion and the
                                                                       contributions from all the coauthors.
industry source from provinces that surround the Yellow and
Bohai seas.
   In conclusion, nitrated phenols in winter of Beijing were           Competing interests. The authors declare that they have no conflict
mainly influenced by primary emissions and regional trans-             of interest.
port; yet secondary formation could not be neglected. This
study firstly stressed that primary emitted phenol rather than
benzene oxidation was crucial in the rapid accumulation of             Acknowledgements. We greatly thank the reviewers for their care-
NPs during the heavy pollution episode in Beijing. This re-            ful review. The work was supported by the National Natural Sci-
sult provides more insight into pollution control strategies of        ence Foundation of China (grant nos. 51636003, 41977179, and
NPs. Both primary sources and secondary formation at either            91844301), the National Key Research and Development Program
local or regional scale should be considered when making               of China (grant nos. 2016YFC0202000 and 2017YFC0213000),
control policies of NP in North China.                                 the Beijing Municipal Science and Technology Commission (grant
                                                                       no. Z201100008220011), and the Natural Science Foundation of
                                                                       Beijing (grant no. 8192022).

Atmos. Chem. Phys., 21, 7917–7932, 2021                                                   https://doi.org/10.5194/acp-21-7917-2021
K. Song et al.: Gas-phase nitrated phenols in Beijing 7929
Financial support. This research has been supported by the Na- Fan, X. C., Lang, J. L., Cheng, S. Y., Wang, X. Q.,
tional Natural Science Foundation of China (grant nos. 51636003, and Lü, Z.: Seasonal Variation and Source Analysis for
41977179, and 91844301), the National Key Research and De- PM2.5 , PM1 and Their Carbonaceous Components in Bei-
velopment Program of China (grant nos. 2016YFC0202000 and jing, Huanjing Kexue/Environmental Sci., 39, 4430–4438,
2017YFC0213000), the Beijing Municipal Science and Technology https://doi.org/10.13227/j.hjkx.201801186, 2018.
Commission (grant no. Z201100008220011), and the Natural Sci- Fang, X., Hu, M., Shang, D., Tang, R., Shi, L., Olenius, T.,
ence Foundation of Beijing (grant no. 8192022). Wang, Y., Wang, H., Zhang, Z., Chen, S., Yu, X., Zhu, W.,
Lou, S., Ma, Y., Li, X., Zeng, L., Wu, Z., Zheng, J., and Guo, S.:
Observational Evidence for the Involvement of Dicarboxylic
Review statement. This paper was edited by Alex Lee and reviewed Acids in Particle Nucleation, Environ. Sci. Tech. Let., 7, 388–
by Thomas Mentel and one anonymous referee. 394, https://doi.org/10.1021/acs.estlett.0c00270, 2020.
Fu, X., Huang, K., Sidiropoulos, N. D., and Ma, W. K.: Nonnegative
Matrix Factorization for Signal and Data Analytics: Identifiabil-
ity, Algorithms, and Applications, IEEE Signal Proc. Mag., 36,
References 59–80, https://doi.org/10.1109/MSP.2018.2877582, 2019.
Gaujoux, R. and Seoighe, C.: A flexible R package for non-
Bannan, T. J., Murray Booth, A., Bacak, A., Muller, J. B. A., negative matrix factorization, BMC Bioinformatics, 11, 1–9,
Leather, K. E., Le Breton, M., Jones, B., Young, D., Coe, H., https://doi.org/10.1186/1471-2105-11-367, 2010.
Allan, J., Visser, S., Slowik, J. G., Furger, M., Prévôt, A. S. H., Gaujoux, R. and Seoighe, C.: Using the package NMF, avail-
Lee, J., Dunmore, R. E., Hopkins, J. R., Hamilton, J. F., able at: http://cran.r-project.org/package=NMF (last access:
Lewis, A. C., Whalley, L. K., Sharp, T., Stone, D., Heard, D. E., 2 March 2021), 2015.
Fleming, Z. L., Leigh, R., Shallcross, D. E., and Perci- Grosjean, D. and Williams, E. L.: Environmental persistence of
val, C. J.: The first UK measurements of nitryl chloride us- organic compounds estimated from structure-reactivity and lin-
ing a chemical ionization mass spectrometer in central Lon- ear free-energy relationships, Unsaturated aliphatics, Atmos.
don in the summer of 2012, and an investigation of the role Environ. A-Gen., 26, 1395–1405, https://doi.org/10.1016/0960-
of Cl atom oxidation, J. Geophys. Res., 120, 5638–5657, 1686(92)90124-4, 1992.
https://doi.org/10.1002/2014JD022629, 2015. Guo, S., Hu, M., Guo, Q., Zhang, X., Zheng, M., Zheng, J.,
Bean, J. K. and Hildebrandt Ruiz, L.: Gas–particle partition- Chang, C. C., Schauer, J. J., and Zhang, R.: Primary
ing and hydrolysis of organic nitrates formed from the oxida- sources and secondary formation of organic aerosols in
tion of α-pinene in environmental chamber experiments, At- Beijing, China, Environ. Sci. Technol., 46, 9846–9853,
mos. Chem. Phys., 16, 2175–2184, https://doi.org/10.5194/acp- https://doi.org/10.1021/es2042564, 2012.
16-2175-2016, 2016. Guo, S., Hu, M., Zamora, M. L., Peng, J., Shang, D., Zheng, J.,
Belloli, R., Barletta, B., Bolzacchini, E., Meinardi, S., Orlandi, M., Du, Z., Wu, Z., Shao, M., Zeng, L., Molina, M. J.,
and Rindone, B.: Determination of toxic nitrophenols in the and Zhang, R.: Elucidating severe urban haze formation
atmosphere by high-performance liquid chromatography, J. in China, P. Natl. Acad. Sci. USA, 111, 17373–17378,
Chromatogr. A, 846, 277–281, https://doi.org/10.1016/S0021- https://doi.org/10.1073/pnas.1419604111, 2014.
9673(99)00030-8, 1999. Guo, S., Hu, M., Peng, J., Wu, Z., Zamora, M. L., Shang, D.,
Berndt, T. and Böge, O.: Gas-phase reaction of OH radi- Du, Z., Zheng, J., Fang, X., Tang, R., Wu, Y., Zeng, L., Shuai, S.,
cals with phenol, Phys. Chem. Chem. Phys., 5, 342–350, Zhang, W., Wang, Y., Ji, Y., Li, Y., Zhang, A. L., Wang, W.,
https://doi.org/10.1039/b208187c, 2003. Zhang, F., Zhao, J., Gong, X., Wang, C., Molina, M. J., and
Brunet, J. P., Tamayo, P., Golub, T. R., and Mesirov, J. P.: Zhang, R.: Remarkable nucleation and growth of ultrafine parti-
Metagenes and molecular pattern discovery using matrix cles from vehicular exhaust, P. Natl. Acad. Sci. USA, 117, 3427–
factorization, P. Natl. Acad. Sci. USA, 101, 4164–4169, 3432, 2020.
https://doi.org/10.1073/pnas.0308531101, 2004. Harrison, M. A. J., Barra, S., Borghesi, D., Vione, D.,
Cecinato, A., Di Palo, V., Pomata, D., Tomasi Scianò, M. C., and Arsene, C., and Iulian Olariu, R.: Nitrated phenols in
Possanzini, M.: Measurement of phase-distributed nitrophenols the atmosphere: A review, Atmos. Environ., 39, 231–248,
in Rome ambient air, Chemosphere, 59, 679–683, 2005. https://doi.org/10.1016/j.atmosenv.2004.09.044, 2005.
Chaara, D., Pavlovic, I., Bruna, F., Ulibarri, M. A., Draoui, K., Heberer, T. and Stan, H. J.: Detection of more than 50 substi-
and Barriga, C.: Removal of nitrophenol pesticides from tuted phenols as their t-butyldimethylsilyl derivatives using gas
aqueous solutions by layered double hydroxides and chromatography-mass spectrometry, Anal. Chim. Acta, 341, 21–
their calcined products, Appl. Clay Sci., 50, 292–298, 34, https://doi.org/10.1016/S0003-2670(96)00557-0, 1997.
https://doi.org/10.1016/j.clay.2010.08.002, 2010. Huber, W., Carey, V. J., Gentleman, R., Anders, S., Carlson, M.,
Delhomme, O., Morville, S., and Millet, M.: Seasonal and diurnal Carvalho, B. S., Bravo, H. C., Davis, S., Gatto, L., Girke, T., Got-
variations of atmospheric concentrations of phenols and nitro- tardo, R., Hahne, F., Hansen, K. D., Irizarry, R. A., Lawrence, M.,
phenols measured in the Strasbourg area, France, Atmos. Pollut. Love, M. I., MacDonald, J., Obenchain, V., Oleś, A. K.,
Res., 1, 16–22, 2010. Pagès, H., Reyes, A., Shannon, P., Smyth, G. K., Tenenbaum, D.,
Devarajan, K.: Nonnegative matrix factorization: An analytical and Waldron, L., and Morgan, M.: Orchestrating high-throughput ge-
interpretive tool in computational biology, PLoS Comput. Biol., nomic analysis with Bioconductor, Nat. Methods, 12, 115–121,
4, e1000029, https://doi.org/10.1371/journal.pcbi.1000029, https://doi.org/10.1038/nmeth.3252, 2015.
2008.
https://doi.org/10.5194/acp-21-7917-2021 Atmos. Chem. Phys., 21, 7917–7932, 20217930 K. Song et al.: Gas-phase nitrated phenols in Beijing Iinuma, Y., Böge, O., and Herrmann, H.: Methyl-nitrocatechols: Emissions of fine particulate nitrated phenols from vari- Atmospheric tracer compounds for biomass burning sec- ous on-road vehicles in China, Environ. Res., 179, 108709, ondary organic aerosols, Environ. Sci. Technol., 44, 8453–8459, https://doi.org/10.1016/j.envres.2019.108709, 2019b. https://doi.org/10.1021/es102938a, 2010. Lu, K., Guo, S., Tan, Z., Wang, H., Shang, D., Liu, Y., Li, X., Inomata, S., Tanimoto, H., Fujitani, Y., Sekimoto, K., Sato, K., Wu, Z., Hu, M., and Zhang, Y.: Exploring atmospheric free- Fushimi, A., Yamada, H., Hori, S., Kumazawa, Y., Shi- radical chemistry in China: The self-cleansing capacity and the mono, A., and Hikida, T.: On-line measurements of gaseous formation of secondary air pollution, Natl. Sci. Rev., 6, 579–594, nitro-organic compounds in diesel vehicle exhaust by proton- https://doi.org/10.1093/nsr/nwy073, 2019. transfer-reaction mass spectrometry, Atmos. Environ., 73, 195– Lüttke, J., Scheer, V., Levsen, K., Wünsch, G., Cape, J. N., Harg- 203, https://doi.org/10.1016/j.atmosenv.2013.03.035, 2013. reaves, K. J., Storeton-West, R. L., Acker, K., Wieprecht, W., and Inomata, S., Fujitani, Y., Fushimi, A., Tanimoto, H., Sekimoto, K., Jones, B.: Occurrence and formation of nitrated phenols in and and Yamada, H.: Field measurement of nitromethane from au- out of cloud, Atmos. Environ., 31, 2637–2648, 1997. tomotive emissions at a busy intersection using proton-transfer- Lv, H. D., Zhou, J. S., Yang, L., Li, Y. M., and Liu, L.: An account- reaction mass spectrometry, Atmos. Environ., 96, 301–309, ing of the external environmental costs of coal in Inner Mongolia https://doi.org/10.1016/j.atmosenv.2014.07.058, 2014. using the pollution damage method, Environ. Dev. Sustain., 22, Karl, T., Striednig, M., Graus, M., Hammerle, A., and 1299–1321, https://doi.org/10.1007/s10668-018-0249-1, 2020. Wohlfahrt, G.: Urban flux measurements reveal a large Lyu, R., Shi, Z., Alam, M. S., Wu, X., Liu, D., Vu, T. V., pool of oxygenated volatile organic compound emissions, P. Stark, C., Xu, R., Fu, P., Feng, Y., and Harrison, R. M.: Natl. Acad. Sci. USA, 115, 1186–1191, 2018. Alkanes and aliphatic carbonyl compounds in wintertime Laskin, A., Laskin, J., and Nizkorodov, S. A.: Chemistry of PM2.5 in Beijing, China, Atmos. Environ., 202, 244–255, Atmospheric Brown Carbon, Chem. Rev., 115, 4335–4382, https://doi.org/10.1016/j.atmosenv.2019.01.023, 2019. https://doi.org/10.1021/cr5006167, 2015. Mohr, C., Lopez-Hilfiker, F. D., Zotter, P., Prévoît, A. S. H., Xu, L., Lee, D. D. and Seung, H. S.: Learning the parts of objects Ng, N. L., Herndon, S. C., Williams, L. R., Franklin, J. P., Zah- by non-negative matrix factorization, Nature, 401, 788–791, niser, M. S., Worsnop, D. R., Knighton, W. B., Aiken, A. C., https://doi.org/10.1038/44565, 1999. Gorkowski, K. J., Dubey, M. K., Allan, J. D., and Thornton, J. A.: Lee, D. D. and Seung, H. S.: Algorithms for non-negative ma- Contribution of nitrated phenols to wood burning brown carbon trix factorization, in: 14th Annual Neural Information Process- light absorption in detling, UK during winter time, Environ. Sci. ing Systems Conference, NIPS 2000, Denver, CO, United States, Technol., 47, 6316–6324, https://doi.org/10.1021/es400683v, 27 November–2 December 2000, 2001. 2013. Leuenberger, C., Czuczwa, J., Tremp, J., and Giger, W.: Nitrated Moreira Dos Santos, C. Y., De Almeida Azevedo, D., phenols in rain: Atmospheric occurrence of phytotoxic pollu- and De Aquino Neto, F. R.: Atmospheric distribution tants, Pergamon, Chemosphere, 17, 511–515, 1988. of organic compounds from urban areas near a coal- Li, K., Li, J., Tong, S., Wang, W., Huang, R.-J., and Ge, M.: fired power station, Atmos. Environ., 38, 1247–1257, Characteristics of wintertime VOCs in suburban and urban Bei- https://doi.org/10.1016/j.atmosenv.2003.11.026, 2004. jing: concentrations, emission ratios, and festival effects, At- Morville, S., Scheyer, A., Mirabel, P., and Millet, M.: Spatial and mos. Chem. Phys., 19, 8021–8036, https://doi.org/10.5194/acp- geographical variations of urban, suburban and rural atmospheric 19-8021-2019, 2019. concentrations of phenols and nitrophenols, Environ. Sci. Pollut. Li, Q., Lu, Y., Wang, P., Wang, T., Zhang, Y., Suriyanarayanan, S., R., 13, 83–89, https://doi.org/10.1065/espr2005.06.264, 2006. Liang, R., Baninla, Y., and Khan, K.: Distribution, source, and Paatero, P. and Tapper, U.: Positive matrix factorization: A risk of organochlorine pesticides (OCPs) and polychlorinated non-negative factor model with optimal utilization of er- biphenyls (PCBs) in urban and rural soils around the Yel- ror estimates of data values, Environmetrics, 5, 111–126, low and Bohai Seas, China, Environ. Pollut., 239, 233–241, https://doi.org/10.1002/env.3170050203, 1994. https://doi.org/10.1016/j.envpol.2018.03.055, 2018. Pascual-Montano, A., Carazo, J. M., Kochi, K., Lehmann, D., Li, X., Wang, Y., Hu, M., Tan, T., Li, M., Wu, Z., Chen, S., and Pascual-Marqui, R. D.: Nonsmooth nonnegative matrix and Tang, X.: Characterizing chemical composition factorization (nsNMF), IEEE T. Pattern Anal., 28, 403–415, and light absorption of nitroaromatic compounds in https://doi.org/10.1109/TPAMI.2006.60, 2006. the winter of Beijing, Atmos. Environ., 237, 117712, Priestley, M., Le Breton, M., Bannan, T. J., Leather, K. E., Ba- https://doi.org/10.1016/j.atmosenv.2020.117712, 2020. cak, A., Reyes-Villegas, E., De Vocht, F., Shallcross, B. M. A., Liu, Y., Shao, M., Zhang, J., Fu, L., and Lu, S.: Distributions and Brazier, T., Anwar Khan, M., Allan, J., Shallcross, D. E., Coe, H., source apportionment of ambient volatile organic compounds in and Percival, C. J.: Observations of Isocyanate, Amide, Nitrate, Beijing City, China, J. Environ. Sci. Heal. A, 40, 1843–1860, and Nitro Compounds From an Anthropogenic Biomass Burning 2005. Event Using a ToF-CIMS, J. Geophys. Res.-Atmos., 123, 7687– Lu, C., Wang, X., Li, R., Gu, R., Zhang, Y., Li, W., 7704, https://doi.org/10.1002/2017JD027316, 2018. Gao, R., Chen, B., Xue, L., and Wang, W.: Emissions Huang, Q., Wang, L., and Han, S.: The genotoxicity of of fine particulate nitrated phenols from residential coal substituted nitrobenzenes and the quantitative structure- combustion in China, Atmos. Environ., 203, 10–17, activity relationship studies, Chemosphere, 30, 915–923, https://doi.org/10.1016/j.atmosenv.2019.01.047, 2019a. https://doi.org/10.1016/0045-6535(94)00450-9, 1995. Lu, C., Wang, X., Dong, S., Zhang, J., Li, J., Zhao, Y., R Core Team: R Core Team 2014 R: A language and envi- Liang, Y., Xue, L., Xie, H., Zhang, Q., and Wang, W.: ronment for statistical computing, R foundation for statistical Atmos. Chem. Phys., 21, 7917–7932, 2021 https://doi.org/10.5194/acp-21-7917-2021
K. Song et al.: Gas-phase nitrated phenols in Beijing                                                                                    7931

   computing, available at: http://www.r-project.org/ (last access:         fine particulate nitrated phenols from the burning of five
   2 March 2021), 2015.                                                     common types of biomass, Environ. Pollut., 230, 405–412,
Rolph, G., Stein, A., and Stunder, B.: Real-time En-                        https://doi.org/10.1016/j.envpol.2017.06.072, 2017.
   vironmental       Applications      and       Display     sYstem:      Wang, Y., Hu, M., Wang, Y., Zheng, J., Shang, D., Yang, Y., Liu, Y.,
   READY,        Environ.    Modell.      Softw.,    95,    210–228,        Li, X., Tang, R., Zhu, W., Du, Z., Wu, Y., Guo, S., Wu, Z., Lou,
   https://doi.org/10.1016/j.envsoft.2017.06.025, 2017.                     S., Hallquist, M., and Yu, J. Z.: The formation of nitro-aromatic
Ropkins, K. and Carslaw, D. C.: Openair – data analy-                       compounds under high NOx and anthropogenic VOC conditions
   sis tools for the air quality community, R J., 4, 20–29,                 in urban Beijing, China, Atmos. Chem. Phys., 19, 7649–7665,
   https://doi.org/10.32614/rj-2012-003, 2012.                              https://doi.org/10.5194/acp-19-7649-2019, 2019.
Schwantes, R. H., Schilling, K. A., McVay, R. C., Lignell, H.,            Wehner, B., Birmili, W., Ditas, F., Wu, Z., Hu, M., Liu, X., Mao, J.,
   Coggon, M. M., Zhang, X., Wennberg, P. O., and Sein-                     Sugimoto, N., and Wiedensohler, A.: Relationships between sub-
   feld, J. H.: Formation of highly oxygenated low-volatility prod-         micrometer particulate air pollution and air mass history in Bei-
   ucts from cresol oxidation, Atmos. Chem. Phys., 17, 3453–3474,           jing, China, 2004–2006, Atmos. Chem. Phys., 8, 6155–6168,
   https://doi.org/10.5194/acp-17-3453-2017, 2017.                          https://doi.org/10.5194/acp-8-6155-2008, 2008.
Seibert, P., Kromp-Kolb, H., Baltensperger, U., Jost, D. T., and          Xie, M., Chen, X., Hays, M. D., Lewandowski, M., Offenberg, J.,
   Schwikowski, M.: Trajectory Analysis of High-Alpine Air Pol-             Kleindienst, T. E., and Holder, A. L.: Light Absorption of Sec-
   lution Data, in: Air Pollution Modeling and Its Application X,           ondary Organic Aerosol: Composition and Contribution of Ni-
   Springer, Boston, MA, USA, 595–596, 1994.                                troaromatic Compounds, Environ. Sci. Technol., 51, 11607–
Sekimoto, K., Inomata, S., Tanimoto, H., Fushimi, A., Fujitani, Y.,         11616, https://doi.org/10.1021/acs.est.7b03263, 2017.
   Sato, K., and Yamada, H.: Characterization of nitromethane             Xu, X., Zhang, H., Chen, J., Li, Q., Wang, X., Wang, W., Zhang, Q.,
   emission from automotive exhaust, Atmos. Environ., 81, 523–              Xue, L., Ding, A., and Mellouki, A.: Six sources mainly con-
   531, https://doi.org/10.1016/j.atmosenv.2013.09.031, 2013.               tributing to the haze episodes and health risk assessment of
Shao, M., Lu, S., Liu, Y., Xie, X., Chang, C., Huang, S.,                   PM2.5 at Beijing suburb in winter 2016, Ecotox. Environ. Safe.,
   and Chen, Z.: Volatile organic compounds measured                        166, 146–156, https://doi.org/10.1016/j.ecoenv.2018.09.069,
   in summer in Beijing and their role in ground-level                      2018.
   ozone formation, J. Geophys. Res.-Atmos., 114, D00G06,                 Yang, Y., Wang, Y., Zhou, P., Yao, D., Ji, D., Sun, J., Wang, Y.,
   https://doi.org/10.1029/2008JD010863, 2009.                              Zhao, S., Huang, W., Yang, S., Chen, D., Gao, W., Liu, Z.,
Stark, H., Yatavelli, R. L. N., Thompson, S. L., Kimmel, J. R., Cu-         Hu, B., Zhang, R., Zeng, L., Ge, M., Petäjä, T., Kerminen, V.-
   bison, M. J., Chhabra, P. S., Canagaratna, M. R., Jayne, J. T.,          M., Kulmala, M., and Wang, Y.: Atmospheric reactivity and
   Worsnop, D. R., and Jimenez, J. L.: Methods to extract molecu-           oxidation capacity during summer at a suburban site between
   lar and bulk chemical information from series of complex mass            Beijing and Tianjin, Atmos. Chem. Phys., 20, 8181–8200,
   spectra with limited mass resolution, Int. J. Mass Spectrom., 389,       https://doi.org/10.5194/acp-20-8181-2020, 2020.
   26–38, https://doi.org/10.1016/j.ijms.2015.08.011, 2015.               Yatavelli, R. L. N., Lopez-Hilfiker, F., Wargo, J. D., Kimmel, J. R.,
Stein, A. F., Draxler, R. R., Rolph, G. D., Stunder, B. J. B., Co-          Cubison, M. J., Bertram, T. H., Jimenez, J. L., Gonin, M.,
   hen, M. D., and Ngan, F.: Noaa’s hysplit atmospheric trans-              Worsnop, D. R., and Thornton, J. A.: A chemical ionization high-
   port and dispersion modeling system, B. Am. Meteorol. Soc.,              resolution time-of-flight mass spectrometer coupled to a micro
   96, 2059–2077, https://doi.org/10.1175/BAMS-D-14-00110.1,                orifice volatilization impactor (MOVI-HRToF-CIMS) for analy-
   2015.                                                                    sis of gas and particle-phase organic species, Aerosol Sci. Tech.,
Sunesson, A. L., Gullberg, J., and Blomquist, G.: Airborne chemi-           46, 1313–1327, https://doi.org/10.1080/02786826.2012.712236,
   cal compounds on dairy farms, J. Environ. Monitor., 3, 210–216,          2012.
   https://doi.org/10.1039/b008873k, 2001.                                Yatavelli, R. L. N., Stark, H., Thompson, S. L., Kimmel, J. R.,
Tang, R., Wu, Z., Li, X., Wang, Y., Shang, D., Xiao, Y., Li, M.,            Cubison, M. J., Day, D. A., Campuzano-Jost, P., Palm, B. B.,
   Zeng, L., Wu, Z., Hallquist, M., Hu, M., and Guo, S.: Primary            Hodzic, A., Thornton, J. A., Jayne, J. T., Worsnop, D. R., and
   and secondary organic aerosols in summer 2016 in Beijing, At-            Jimenez, J. L.: Semicontinuous measurements of gas–particle
   mos. Chem. Phys., 18, 4055–4068, https://doi.org/10.5194/acp-            partitioning of organic acids in a ponderosa pine forest using
   18-4055-2018, 2018.                                                      a MOVI-HRToF-CIMS, Atmos. Chem. Phys., 14, 1527–1546,
Tang, R., Lu, Q., Guo, S., Wang, H., Song, K., Yu, Y., Tan, R., Liu,        https://doi.org/10.5194/acp-14-1527-2014, 2014.
   K., Shen, R., Chen, S., Zeng, L., Jorga, S. D., Zhang, Z., Zhang,      Yu, Y., Wang, H., Wang, T., Song, K., Tan, T., Wan, Z.,
   W., Shuai, S., and Robinson, A. L.: Measurement report: Distinct         Gao, Y., Dong, H., Chen, S., Zeng, L., Hu, M., Wang, H.,
   emissions and volatility distribution of intermediate-volatility or-     Lou, S., Zhu, W., and Guo, S.: Elucidating the impor-
   ganic compounds from on-road Chinese gasoline vehicles: impli-           tance of semi-volatile organic compounds to secondary or-
   cation of high secondary organic aerosol formation potential, At-        ganic aerosol formation at a regional site during the
   mos. Chem. Phys., 21, 2569–2583, https://doi.org/10.5194/acp-            EXPLORE-YRD campaign, Atmos. Environ., 246, 118043,
   21-2569-2021, 2021.                                                      https://doi.org/10.1016/j.atmosenv.2020.118043, 2021.
Valero-Mora, P. M.: ggplot2: Elegant Graphics for Data Analysis, J.       Yuan, B., Hu, W. W., Shao, M., Wang, M., Chen, W. T., Lu, S. H.,
   Stat. Softw., 35, 1–3, https://doi.org/10.18637/jss.v035.b01,            Zeng, L. M., and Hu, M.: VOC emissions, evolutions and contri-
   2010.                                                                    butions to SOA formation at a receptor site in eastern China, At-
Wang, X., Gu, R., Wang, L., Xu, W., Zhang, Y., Chen, B.,                    mos. Chem. Phys., 13, 8815–8832, https://doi.org/10.5194/acp-
   Li, W., Xue, L., Chen, J., and Wang, W.: Emissions of                    13-8815-2013, 2013.

https://doi.org/10.5194/acp-21-7917-2021                                                    Atmos. Chem. Phys., 21, 7917–7932, 2021
You can also read