MEASURES TO REDUCE GREENHOUSE GAS EMISSIONS FROM TRANSPORTATION AND LAND USE ACROSS THE MET COUNCIL REGION
←
→
Page content transcription
If your browser does not render page correctly, please read the page content below
MEASURES TO REDUCE GREENHOUSE GAS EMISSIONS
  FROM TRANSPORTATION AND LAND USE ACROSS THE MET COUNCIL REGION

                                       Recommendations Report

                                                By
                                        Dr. Jason Hawkins
                                          Matthew Dean
                          Dr. Kara Kockelman (Research Supervisor)
                Department of Civil, Architectural, and Environmental Engineering
                                 Cockrell School of Engineering
                                   1 University Station, C1700
                                         Austin, TX 78712

                                                 July 2021

EXECUTIVE SUMMARY
Climate change is among the most pressing issues of the 21 st Century. Its impacts include more severe
weather events and temperature variations, increasing home insurance premiums, increasing repair costs
of public facilities, and stresses to the economy and wellbeing of residents (Met Council, 2014b). One of
the largest sources of anthropogenic greenhouse gas (GHG) emissions is the transportation sector,
accounting for roughly a third of all emissions in the United States. This report’s objectives are to outline
a range of policy and technology strategies and their relative potentials to reduce GHG emissions from
the transportation and land use sectors. This review is then used in the development of a tool for
comparing decarbonization strategies in the MSP region.

The GHG scenario planning tool allows users to compare possible futures for land use, buildings,
transportation, and urban tree canopies. The tool operates at the level of municipalities and townships.
The main inputs are population, land use, transportation, and energy projections for the year 2040. The
transportation component of the tool also relies on projections of the adoption of electric vehicles (EVs),
autonomous vehicles (AVs), and dynamic ridesharing (DRS). The tool also examines the use of road,
parking, and decongestion pricing to reduce VMT, and therefore GHG emissions. Cost and emissions
factors are then coupled with demand elasticities to inform comparisons of alternative scenarios to a
business-as-usual (BAU) forecast.

The recommended set of decarbonization strategies for MSP are as follows:
    1. Electrification of the private vehicle fleet. The most critical factors in determining life-cycle GHG
        emissions in the coming decades are the ICE turnover rate and rate of change in vehicle size and
        power. Vehicle electrification represents the most effective and feasible means of transportation
        decarbonization in a region with the modal mix of MSP. Anticipated changes in the electricity grid
        of Minnesota will decrease the GHG emissions of EVs. However, it is important to ensure these
changes occur, and to push for further decarbonization of the electricity grid. Regardless of
       changes in the electricity grid or whether the EV mix is dominated by PHEVs or BEVs, a shift
       towards EVs is the most significant driver of cumulative emission reductions (Craglia & Cullen,
       2020). The introduction of DCFC (level 3 chargers) throughout the region would be a major
       catalyst for EV adoption. It is also recommended that level 2 chargers be a requirement in all new
       dwellings and parking structures to reduce barriers to adoption.
    2. Electrification of the public transit vehicle fleet. Public transit buses should be electrified as soon
       as feasibly possible. However, a dramatic expansion of public transit service is not anticipated to
       provide any benefit from the perspective of GHG emissions reductions. While recognizing there
       is a range of factors considered when establishing public transit investment, it was concluded that
       public transit only provides a decarbonization benefit when there is sufficient demand to fill
       vehicles (more than about 13 passengers for a standard bus). Right-sizing of vehicles and dynamic
       vehicle routing should be considered in the decarbonization strategy to increase the average
       vehicle occupancy.
    3. Shared fleets of vehicles. While the timeline for automation of road transportation remains
       uncertain, it is prudent to plan for its eventual arrival. In the short-term, shared fleets of ride-
       hailing vehicles offer a means of FMLM transit where expected vehicle occupancies are below the
       necessary threshold to make bus and rail modes effective decarbonization strategies. In the long-
       term, SAEVs will increase operational efficiency (and therefore reduce GHG emissions), reduce
       vehicle ownership, and likely decrease the size of vehicles. In addition, there is the potential to
       reduce requirements for parking structures because vehicles can continue making trips after
       dropping off a passenger. All these factors have been found to reduce the GHG emissions of
       transportation (Craglia & Cullen, 2020; Lawal et al., 2020). We recommend regulatory limits on
       empty VMT of 0% for private AVs and 15% for fleets of SAVs. Such limits would both reduce VMT
       and encourage the use of SAVs over private vehicles.
    4. Development along transit corridors. Land use change is a slow process, and it is unlikely that a
       sufficient density to induce significant decarbonization is possible for the MSP region as a single
       strategy. However, there is clear support for densification and increased land use diversity along
       existing and planned transit corridors. Coupling land use densification with locations of frequent
       transit service is expected to provide strong benefits and increase destination accessibility.

While many technology and policy strategies represent marginal changes in GHG emissions, shifts in the
electricity grid will produce step changes in the GHG emissions of transportation. Each additional EV
purchased, or dollar increase in decongestion pricing, has an associated incremental decrease in
emissions. However, replacing the generation capacity of a single coal-fired power plant with renewables
will have a positive impact on the emissions of all EVs on the road, rail stock on the track, and buildings in
the region.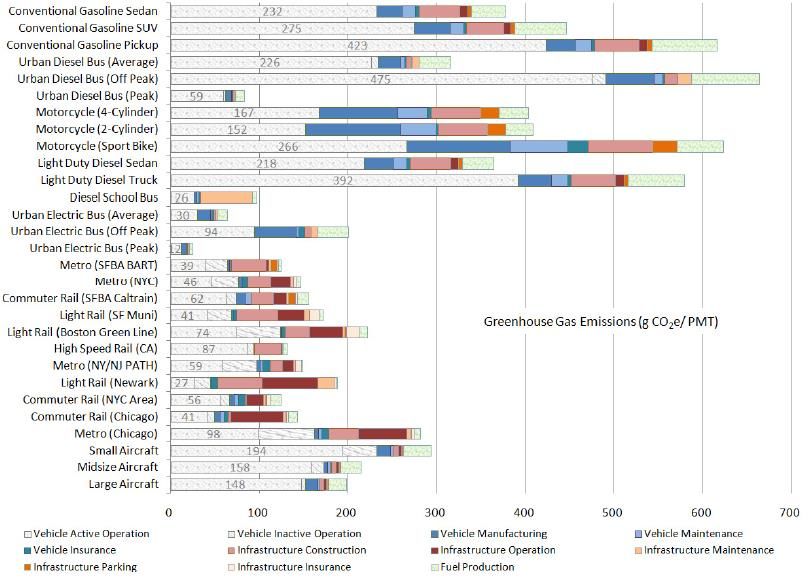
Table of Contents
Executive Summary ........................................................................................................................................ I
List of Tables .................................................................................................................................................. II
List of Figures ................................................................................................................................................. II
1. Overview .................................................................................................................................................... 1
2. Existing Conditions in MSP......................................................................................................................... 2
   2.2 Existing Climate Change Plans ............................................................................................................. 8
       2.2.2 Met Council Plans .......................................................................................................................10
       The Thrive Transportation Plan provides the following measure of effectiveness (MOE): ................10
       2.2.3 Local Government Plans .............................................................................................................11
3. Passenger GHG Reduction Strategies ......................................................................................................13
   3.1 Roadway Design Improvements ........................................................................................................13
   3.2 Vehicle Fuels ......................................................................................................................................13
   3.3 Personal Vehicle Electrification .........................................................................................................14
   3.4 Public Transit Bus Electrification .......................................................................................................19
   3.5 AVs, SAVs, and SAEVs ........................................................................................................................20
   3.6 AVs, SAVs, and SAEVs as FMLM Transit .............................................................................................21
   3.7 Carsharing and Ridesharing ...............................................................................................................22
       3.2.2 Shift from Automobile to Traditional Alternatives Modes .........................................................22
   3.8 Micromobility.....................................................................................................................................25
   3.9 Decongestion Pricing .........................................................................................................................26
   3.10 Pay-As-You-Drive Auto Insurance ....................................................................................................27
   3.11 Parking Provisions ............................................................................................................................27
   3.12 Telecommuting ................................................................................................................................29
   3.13 Long-Distance Travel........................................................................................................................31
4. Freight Transportation Strategies ............................................................................................................32
5. Land Use Strategies..................................................................................................................................33
   5.1 Upzoning at the Regional Scale .........................................................................................................34
   5.2 Urban Growth Boundary ...................................................................................................................36
   5.3 Transit-Oriented Development ..........................................................................................................36
   5.4 Infill Development .............................................................................................................................37
6. Case Studies from Other Cities ................................................................................................................37
   6.1 Boston, Massachusetts ......................................................................................................................37
   6.2 Seattle, Washington...........................................................................................................................40
   6.3 Austin, Texas ......................................................................................................................................41

                                                                                 I
6.4 Reykjavik, Iceland...............................................................................................................................43
   6.5 Toronto, Canada ................................................................................................................................44
7. Overview of GHG Assessment Tool .........................................................................................................46
8. Preferred Transportation Decarbonization Strategies ............................................................................47
References ...................................................................................................................................................48

LIST OF TABLES
Table 1 Summary of Lifecycle GHG Emissions for Various Forms of Freight Transportation .....................33
Table 2 Summary of Policies Considered in Seattle Study ..........................................................................41
Table 3 Austin, Texas GHG Phase 1 Actions ................................................................................................43

LIST OF FIGURES
Figure 1 United States ownership duration for vehicles (by class) and for dwellings .................................. 3
Figure 2 United States urban passenger rail miles by year ........................................................................... 3
Figure 3 MSP developed land by year ........................................................................................................... 4
Figure 4 MSP land use mix by year ................................................................................................................ 4
Figure 5 MSP Ethanol (E85) fuel stations ...................................................................................................... 5
Figure 6 Historical EV Sales in Minnesota by Class........................................................................................ 5
Figure 7 MSP EV recharging stations ............................................................................................................. 6
Figure 8 MSP GHG emissions by source ........................................................................................................ 7
Figure 9 Reference and mitigation scenarios for electricity mix in Upper Midwest Region......................... 8
Figure 10 Minnesota’s GHG Emissions by economic sector for the period between 2005 and 2016 .......... 9
Figure 12 Cumulative tax paid by typical 2017 EV and ICE automobiles ....................................................10
Figure 13 Life-cycle CO2 emissions aggregated at a vehicle level for 2018 and 2030 model-year, under
three electricity production scenarios (SSP1, SP2, and SSP5) .....................................................................15
Figure 14 Range of BEV forecasts from several sources .............................................................................16
Figure 15 2015-2050 U.S. LDV fleet CO2 emissions in a baseline case and changes associated with
growing LDV fleet, policies, and electrification under the EV30@30 compared to 2 °C 2015-2050 CO2
emission budget...........................................................................................................................................17
Figure 16 Box plot of daily driving range distributions for selected cities. .................................................19
Figure 17 State-Level Variability in LFCS for Low, Baseline, and High-Charging-Cost Scenarios ................20
Figure 18 Summary of GHG emissions per PMT for average and full occupancy .......................................23
Figure 19 Summary of GHG emissions in g CO2eq per PMT ........................................................................24
Figure 20 Parking policies and effects on CO2 .............................................................................................28
Figure 21 Estimated impact of one-day-per-week teleworking vs. no teleworking on annual energy,
where positive net energy indicates that teleworking uses more energy than non-teleworking ..............31
Figure 22 Distribution of freight transportation GHG emissions in the United States ...............................32
Figure 23 Annual GHG emissions associated with low and high-density development .............................35
Figure 24 Baseline projection of Boston-generated transportation GHG emissions ..................................38
Figure 25 Change in 2030 GHG Emissions for Shared Mobility, by Technology and Auto Ownership .......39
Figure 26 Contributions to 2050 Transportation GHG Reductions .............................................................40
Figure 27 Austin, Texas GHG emission reduction strategy impacts ............................................................42
Figure 28 Scenarios by density and technology change..............................................................................44
Figure 29 Emissions by sector and fuel/source in BAP 2050 scenario ........................................................45
Figure 30 Emissions by sector and fuel/source in Low Carbon 2050 scenario ...........................................46

                                                                               II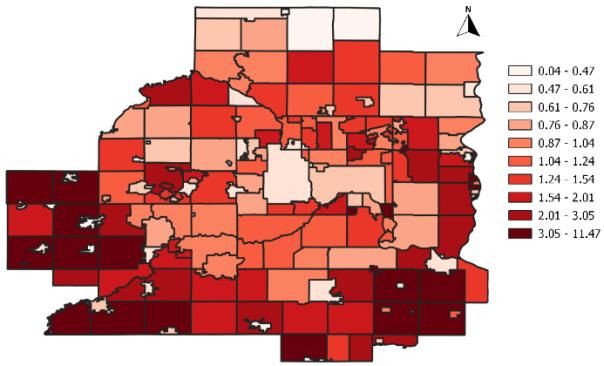
Abbreviation                                Term
     ACA                  Airport Carbon Accreditation Program
    ACRP                  Airport Cooperative Research Program
    AFDC                        Alternative Fuels Data Center
      AV                 Autonomous Vehicle (Automated Vehicle)
      BEV                          Battery Electric Vehicle
Carbon Neutral    Zero Greenhouse Gas Emissions Annually on a Net Basis
     CBD                           Central Business District
  CNG/LNG                   Compressed/Liquefied Natural Gas
      CO2                               Carbon Dioxide
     DRS                            Dynamic Ride-Sharing
     DCFC                  Direct Current Fast Charging (Level 3)
      EIA                 U.S. Energy Information Administration
      EPA                 U.S. Environmental Protection Agency
       EV                               Electric Vehicle
     EVCS                     Electric Vehicle Charging Station
     EVSE                    Electric Vehicle Supply Equipment
    FMLW                              First Mile Last Mile
      GSE                        Ground Support Equipment
     GHG                               Greenhouse Gas
      HC                                 Hydrocarbon
     HEV                            Hybrid Electric Vehicle
     LDV                              Light-Duty Vehicle
      LRT                              Light Rail Transit
    MPCA                      Minnesota Pollution Control Act
     MSP                             Minneapolis-St. Paul
      NEI                       National Emissions Inventory
      NOx                               Nitrogen Oxides
    PHEV                       Plug-in Hybrid Electric Vehicle
     SAEV                  Shared Autonomous Electric Vehicle
     SAV                        Shared Autonomous Vehicle
     SOV                           Single-Occupant Vehicle
     TOD                       Transit-Oriented Development
     UGB                           Urban Growth Boundary
   UNFCCC        United Nations Framework Convention on Climate Change
     VMT                            Vehicle-Miles Traveled

                              III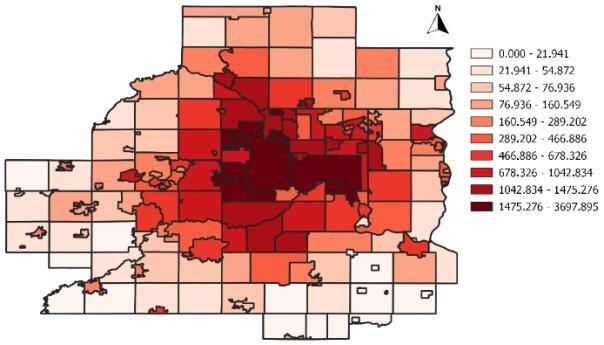
1. OVERVIEW
Climate change, and associated environmental impacts, caused by the release of greenhouse gas (GHG)
emissions is a major challenge facing the Minneapolis-St. Paul Metropolitan Area (MSP), and all species
on the planet. Addressing climate change features prominently in both local and state government
planning. Met Council’s Thrive MSP plan anticipates that more severe weather events and temperature
variations associated with climate change will increase home insurance premiums, repair costs of public
facilities, and stresses to the economy and wellbeing of residents (Met Council, 2014b). Resiliency and
climate change mitigation are central to the plan, including changes in both land use and transportation.
The state Next Generation Energy Act of 2007 sets a goal of reducing GHG emissions by 30% by 2025 and
80% by 2050 (Claflin & Steinwand, 2019). There is also strong evidence that climate change will receive a
greater focus at the federal level in the coming years (BBC News, 2020). This report focuses on the
passenger and freight travel sector as the largest source of GHG emissions that can be readily measured
and addressed through local policy. In addition, the mobile nature of transportation means that this sector
is more efficiently addressed at the regional scale (i.e., by Met Council), as compared to either building
energy or waste, which fall under the purview of individual municipal governments.

Urban form impacts residential choice, trip patterns, and total VMT (Badoe & Miller, 2000; TRB, 2009).
Policies to promote infill development or allow sprawl have major long-term effects on GHG emissions,
especially those from passenger vehicles. If planners identify investments in public EV charging
infrastructure and sustainable, efficient public transportation as key mitigation measures, congruency
with land-use regulations that in turn dictate development is just as important. For example, if cities
experience the same historical urban growth at low population density, increases in annual VMT could
undo improvements in expected vehicle technology and fuels from CAFE standards and low-carbon fuels
(Hankey & Marshall, 2010). Once in place, the built environment limits adaptation strategies to mitigate
the effects of climate change. Thus, creating land-use regulations that not only permit but promote
compact, multifamily residential complexes, with mixed-use zoning, affects the opportunities to take
multiple forms of transportation to accessible destinations.

The objectives of this project are as follows:
    1. Provide technical support for the regional GHG inventory under development by Met Council.
    2. Assist in the development of a land use and transportation scenario planning tool for the MSP
         Metropolitan Area.
    3. Provide feedback on the user interface for the scenario planning tool.
    4. Participate in education and outreach surrounding Metro Climate Stats.
The purpose of this report is to assess technology and policy options to reduce the GHG emissions impacts
of the transportation and land-use sectors. It then provides recommendations as to the preferred set of
technology and policy options for inclusion in the scenario planning tool. A separate report outlines the
methodology used in the development of the scenario planning tool. The remainder of this report is
structured as follows:
    • Section 2 outlines existing conditions in MSP in terms of transportation and land use planning.
         This section also provides a preliminary assessment of GHG emissions by the community, focusing
         on transportation and residential land use.
    • Section 3 provides a detailed review of potential technology and policy strategies that could be
         considered for inclusion in the scenario planning tool for passenger transportation.
    • Section 4 provides a detailed review of potential technology and policy strategies that could be
         considered for inclusion in the scenario planning tool for freight transportation.

                                                    1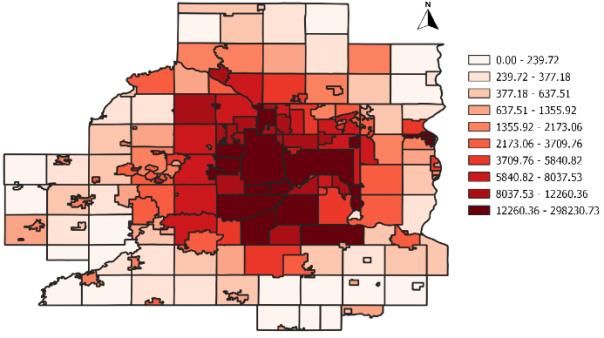
•   Section 5 provides a detailed review of potential technology and policy strategies that could be
        considered for inclusion in the scenario planning tool for land use.
    •   Section 6 outlines several examples of quantitative analysis performed in similar-sized
        metropolitan regions.
    •   Section 7 outlines the GHG planning tool.
    •   Section 8 outlines the proposed set of technology and policy strategies for inclusion in the
        scenario planning tool.

2. EXISTING CONDITIONS IN MSP
Like most urban areas in North America, MSP is heavily reliant on its road network for commuting.
According to the 2010 travel behavior inventory (TBI), 89% of commuting trips were made by private
automobile, 5% by public transit, and 6% by walk or bicycle (Met Council, 2018). However, the trend in
mode share is promising, with transit and walking increasing by 25% and 16%, respectively, between 2000
and 2010 (Met Council, 2018). The MnPass high occupancy toll lane system was introduced in 2009. The
Metropolitan Transportation Commission (2008) found that an HOT network can reduce PM10 by 10%,
CO2 by 7%, and NOx by 3% compared to an HOV network in the year 2030 (all else being equal). Another
promising indicator of transportation investment in MSP is the focus in Thrive MSP on the highway
network as a fixed asset, which will be maintained but not significantly expanded in the current planning
horizon (Met Council, 2018). Despite its cold winters, MSP is recognized as a leader in the provision of
bicycle infrastructure, including the Nice Ride network of shared bikes first deployed in 2010
(Schieferdecker, 2012).

Parking is an understudied component of the transportation system. The capital city of St. Paul did a study
of parking utilization in 2015. They found a 73% parking occupancy rate at 10 AM on weekdays (City of St.
Paul, 2016). When street parking meters are turned off during evenings and weekends, these on-street
spaces fill up and surface lot occupancy drops to 30%. There are 28,000 on/off-street parking facilities in
the St. Paul CBD and only 6% of parking in the city is on-street (SRF & Nelson Nygaard, 2015). It is estimated
that 98% of automobile trips in the Los Angeles metro area start or end with free parking (Chester et al.,
2015). Similarly, our estimate for the MSP area based on the TBI is 99% of trips.

Most climate change mitigation plans - whether at the local, state, or federal level - provide targets for
GHG reductions for a forecast year between 2030 and 2050 (in the case of MSP, we set the target as 2050).
Large-scale changes in both transportation and land use patterns are necessary to meet any of these
targets. Transportation and housing are the largest capital expenditures made by most households and
their turnover time should be considered when assessing the feasibility and timing of changes. As such,
this report begins with a summary of key statistics for the United States (and MSP where available) to
provide context for the decarbonization strategy. Currently, in the United States, only 30% of purchased
vehicles are new (U.S. Bureau of Transportation Statistics, 2020a), which means that most households are
not replacing their current vehicles with one that meets the highest fuel standards under CAFE or with
one of the growing array of alternative fuel vehicles on the market. Similarly, only 9% of residential
property sales in 2018-2019 were newly constructed dwellings (National Association of Realtors, 2020;
U.S. Census Bureau, 2020b). Capital turnover is not instantaneous (see Figure 1). The average car is owned
for 10 years, while lower fuel efficiency pickup trucks are generally kept even longer. One of the major
transportation levers under the control of MPOs, such as Met Council, is public transit. Fixed route rail
transit is the highest order - carrying the highest density of passenger volume - form of public transit.
However, the construction of this infrastructure in the 21st century has been slow. The MSP region has
contributed to this recent growth, adding 33 miles of fixed rail transit since 2004 (Metro Transit, 2010;

                                                      2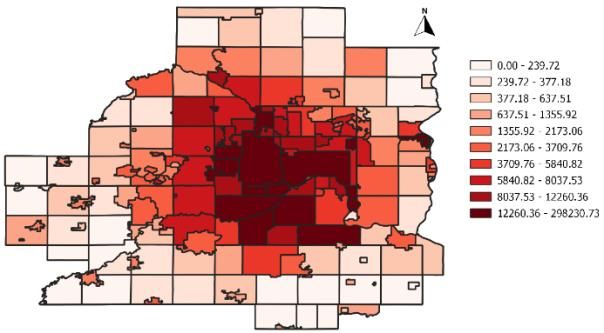
Met Council, 2014a; “Northstar Line,” 2020). This recent construction can be compared with 915 miles of
major arterial roadway in the region, which represents 5.3% of the road miles but 48% of VMT (Met
Council, 2020). These statistics provide context rather than discouragement for the prospects of
decarbonizing transportation in MSP. They suggest that strategies that utilize the existing road
infrastructure will likely be more feasible to adopt within the time horizon of 2040.

Figure 1 United States ownership duration for vehicles (by class) and for dwellings (Federal Highway
Administration, 2017; U.S. Census Bureau, 2020a)

Figure 2 United States urban passenger rail miles by year (U.S. Bureau of Transportation Statistics,
2020b)

Regarding land use, the proportion of developed land in MSP increased by 9.5%, from 17.4% to 26.9%,
over the last 35 years. One of the areas for change that could have a significant effect on climate change
is the mix of residential space. As will be outlined in subsequent sections, residential dwelling choice has
a significant impact on GHG emissions, not only through the direct consumption of energy but also
through its effect on transportation VMT. The proportion of developed land devoted to single-family
detached dwellings in the MSP region has remained steady at 68-70% since 1984. The City of Minneapolis
is addressing this pattern through an update of its zoning policy, as outlined in its Minneapolis2040 plan.
The city has built only 64,000 new homes since 2010 while adding 83,000 households (City of Minneapolis,
2019).

                                                     3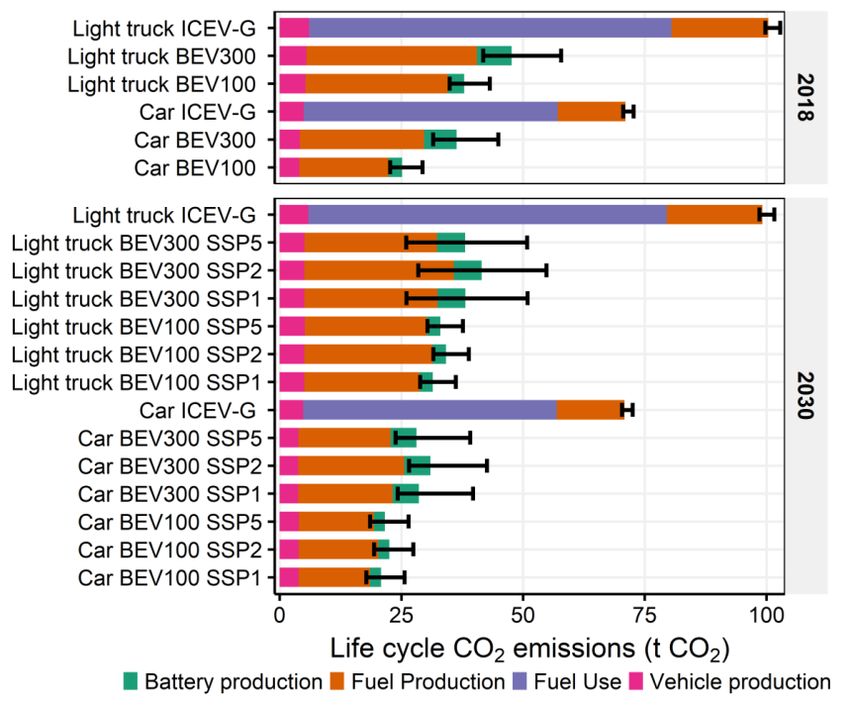
Figure 3 MSP developed land by year (Met Council, 2017)
Figure 4 MSP land use mix by year (Met Council, 2017)
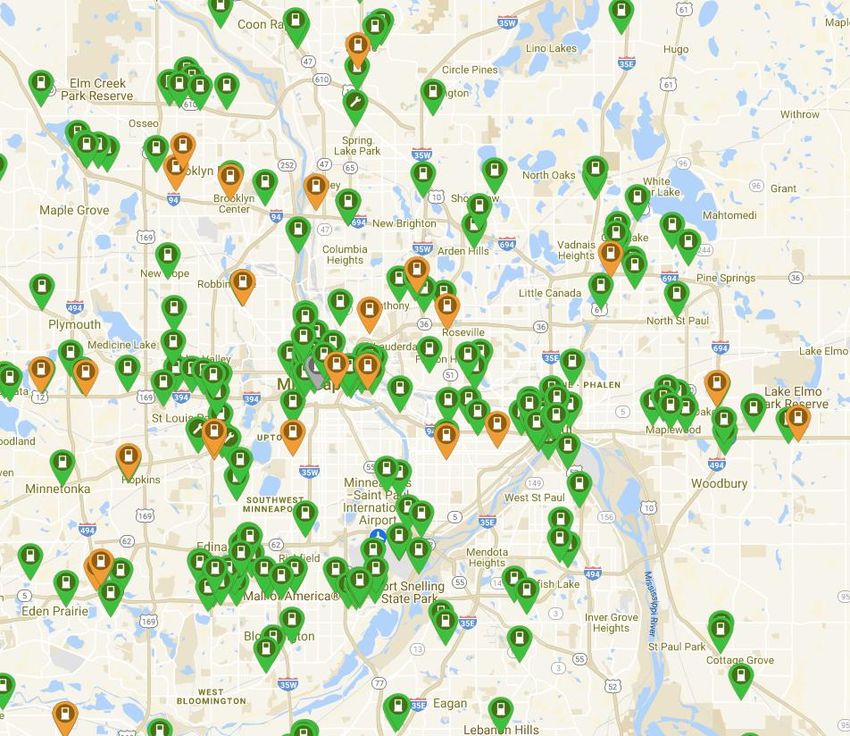
The MSP region is well-provisioned with alternative fuel and EV recharging stations. The Alternative Fuel
Data Center (AFDC) provides a map of current biofuel stations, including E85 public stations, which is
reproduced below for a section of the MSP region. Owners of FFVs are likely aware of some of these
locations, but measures to increase awareness of biofuel station locations could be useful.
4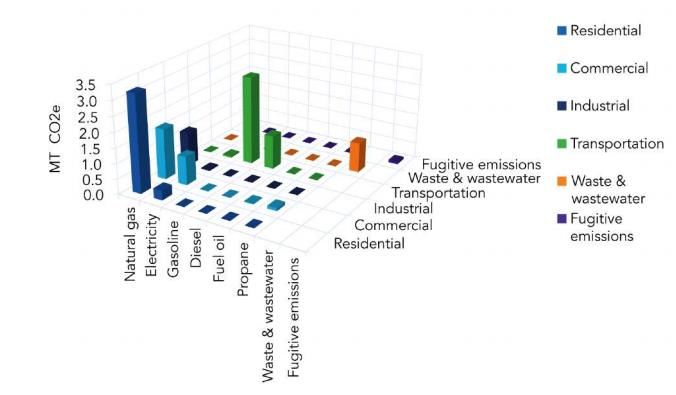
Figure 5 MSP Ethanol (E85) fuel stations (AFDC, 2020)

EV sales in Minnesota have roughly doubled from 3,917 vehicles in 2011 to 8,175 vehicles in 2019 (see
Figure 6). In addition, a larger portion of vehicle sales is now fully electric BEVs rather than HEVs. The
region is well-served by EV charging stations (see Figure 7).

Figure 6 Historical EV Sales in Minnesota by Class (Auto Alliance, 2020)

                                                     5
Figure 7 MSP EV recharging stations (PlugShare, 2020) - green = public and gold = high power
Figure 8a-d are based on data compiled by the Vulcan project at Northern Arizona University (Gurney et
al., 2020). This project produced 1-km grid cells at one-hour intervals for GHG emissions for the
continental United States for the years 2010 to 2015. The data include estimates for emissions resulting
from the combustion of fossil fuels and cement production. Sources are categorized as airports, cement,
commercial, commercial marine vessels, industrial, electricity generation, residential, non-road
transportation, rail transportation, and road transportation. Emission totals from the EPA National
Emissions Inventory (EPA NEI) are spatially and temporally allocated at a detailed scale. In the case of road
transportation, emissions are distributed among roads by AADT reported to FHWA. In the absence of
reported AADT data, values are imputed from a nearest neighbor analysis of road links with available
AADT data. A similar procedure is used to distribute among the hours of the year based on continuous
counting station data. For the purposes of the current project, annual totals are sufficient. Residential
emissions are available for each county from the EPA NEI nonpoint CO data. These totals are then
distributed among 1-km grid cells based on DOE Residential Energy Consumption Survey microdata and
FEMA HAZUS (a spatially detailed hazard risk assessment tool). These 1-km grid cells were then
redistributed among the 188 communities and townships in MSP, with the totals for grid cells that cross
community boundaries being proportionally allocated by area. A clear challenge in presenting emissions
results for each community is that they are not uniform in their population or role in the region. For
example, transportation emissions will tend to be higher in Minneapolis owing to its disproportionate role
6as a center of employment. Figure 8a-c standardize emissions by land area based on the focus of this
report being the effective use of land and transportation infrastructure for the reduction of emissions.
From this perspective, emissions tend to decrease with distance from the central cities (i.e., Minneapolis
and St. Paul). Figure 8d then standardizes road transportation emissions per capita using a summation of
population and employment. In this case, the emissions profile switches such that outlying areas tend to
have higher emission rates. The vehicle inventory conducted as part of the 2019 TBI suggests that part of
this result can be attributed to residents of central cities owning smaller and more fuel-efficient vehicles.
There is also a higher use of transit and active modes (i.e., walking and cycling) in these more central
communities. Finally, by considering both population and employment, this standardization captures the
fact that residents of more central communities tend to also work in these communities. As such, in many
cases, they will be double-counted in the per capita measure.
(a) Total per mi2 (b) Residential per mi2
(c) Road transportation per mi2 (d) Road transportation per capita
(population + employment)
Figure 8 MSP GHG emissions by source (Gurney et al., 2020)
As will be expanded upon in subsequent sections of this report, synergies between innovations in the
transportation, buildings, and electricity generation sectors are critical to any decarbonization strategy.
A transition in the vehicle fleet towards EVs or a change in building heating to electricity-based sources
will be ineffective in reducing GHG emissions if the electricity grid relies on carbon-intensive sources of
generation. Xcel Energy has prepared a set of forecasts for the electricity generation mix in the Upper
Midwest Region (Michigan, Minnesota, North Dakota, South Dakota, and Wisconsin). Minnesota
represents the largest market for Xcel Energy within the region. The reference scenario assumes that
nuclear plants are retired at the end of their life and replaced with imported energy. Coal-fired plants
are assumed to represent a diminishing portion of the generation mix as they are phased out. The
mitigation scenario assumes that carbon-free generation (i.e., utility-scale solar, onshore wind, biomass,
hydro, and nuclear generation) represent 90% of the generation mix in 2050. If enacted, this mitigation
7scenario would provide significant improvements to decarbonization from the electrification of both
transportation and building energy.
Figure 9 Reference and mitigation scenarios for electricity mix in Upper Midwest Region (data source:
(Xcel Energy, 2019))
2.2 Existing Climate Change Plans
The principal source of state legislation regarding climate change is the Next Generation Energy Act. The
act requires Minnesota to reduce its GHG emissions by 80% from 2005 levels by 2050 (MPCA, 2019).
Interim goals are set at 15% and 30% for 2015 and 2025, respectively. The state was unable to meet its
2015 goal but did reduce emissions by 5% relative to 2005 levels. Under the conditions of the act, the
Minnesota Pollution Control Agency (MPCA) is required to produce a bi-annual inventory of emissions
produced within the state. The main source of emissions reductions has come in the form of transitions
in the electricity generation sector (see Figure 10). MPCA reports that the transportation sector is now
the largest source of emissions in the state. In addition, trends towards larger vehicles and more miles
traveled are inhibiting more significant reductions in this sector. Emissions from the residential sector
increased by 11% between 2005 and 2016. The state government is working to reduce emissions from
their activities through electricity efficiency improvements, reducing workspace square footage, and
introducing on-site renewable energy generation at agency offices (MPCA, 2019).
8Figure 10 Minnesota’s GHG Emissions by economic sector for the period between 2005 and 2016
(MPCA, 2019)
Improvements in the electricity generation sector are the result of a combination of state regulations.
The 2001 Emissions Reduction Rider allowed electricity generators to include the cost of air pollution-
reduction programs in customer charges, which encouraged the replacement of coal generation with
gas and wind. In 2007, a renewable energy standard was introduced, requiring that 27% of electricity
sales in the state come from renewable sources - generators are on track to meet this requirement.
Along similar lines, 2013 legislation requires that 1.5% of retail electricity sales by investor-owned
generation providers come from solar energy.
The main transportation focus in state climate change plans is encouraging the adoption of electric
vehicles (EVs). With promising shifts towards low-emissions sources in the electricity generation profile
of the state, a transition to EVs would reduce the emissions of the transportation sector. Minnesota has
set the goal that 20% of vehicles on the road are EVs by 2030 (Minnesota Department of Transportation
et al., 2019). They plan to achieve this goal through a combination of educational programs and
investments in charging infrastructure. Minnesota is receiving $47 million as part of a national settlement
with Volkswagen following Volkswagen’s violation of vehicle emissions reporting standards (MPCA, 2019).
The state intends to use 15% of this settlement to build out a statewide network of EV charging stations.
According to an analysis by the nonpartisan Great Plains Institute (2017), the current tax policy in
Minnesota provides a disincentive for EV ownership. A large portion of this difference is due to the
9higher sales price on EVs, which increases the motor vehicle sales tax applied to these vehicles. This
analysis does not include the additional $75 fee introduced in 2017 to provide a comparable measure to
the gas tax for ICE (MNDOT, 2019). The gas tax amounts to about $95 per year, which is included in the
calculations summarized in Figure 11.
Figure 11 Cumulative tax paid by typical 2017 EV and ICE automobiles (McFarlane, 2017)
2.2.2 Met Council Plans
The Met Council climate change agenda is largely outlined in the Thrive MSP plan (Met Council, 2014b).
Throughout the plan, Met Council focuses on providing alternatives to single-occupant vehicle travel,
promoting compact land use patterns, and the protection of industrial and agricultural land. Met Council
plays a significant role in providing technical assistance to local governments in developing plans to
address climate change - this report is a component of this work. Met Council is working to translate state
emissions reporting to the local level so that local governments can better quantify their current emissions
profiles and the expected impact of their emissions reduction efforts.
The Thrive MSP transportation plan identifies several traditional travel demand management (TDM)
strategies: reduce travel during peak periods, encourage carpooling and transit, and promote flexible
work schedules. A plan is outlined for the adoption of electric buses, including where to install charging
infrastructure and challenges arising from vehicle range and operation in cold weather. The measures of
effectiveness identified by Met Council for transportation performance are robust and have a broad
coverage. The focus on providing access to destinations rather than reducing VMT is a good framing of
the problem. The plan recognizes that improving vehicle fuel efficiency, and switching to EVs, will reduce
gas tax revenue and require consideration of new revenue streams. Transportation investments for MSP
are distributed as $15.8B on highways, $35.1B on transit, and $41.2B on local roads/active modes.
The Thrive Transportation Plan provides the following measure of effectiveness (MOE):
• Access to jobs
10• MnPASS usage
• Percentage of travel by modes other than single-occupant vehicles
• Transit ridership
• Mode participation rate
• Peak-hour excessive delay
• Average aircraft delay at MSP International Airport
• Regional bicycle transportation network implementation
Regarding land use, Thrive MSP identifies aging multifamily housing stock as a focus area. Like many urban
regions, MSP has a large stock of rental apartments built in the 1960s and 1970s. These apartments are
affordable but require reinvestment to remain functional. Single-family homes represent 58% of the
current housing stock, but the MSP region has seen a transition towards more multifamily units. In both
2012 and 2013, more multifamily building permits were issued than for all housing types in 2008, 2009,
2010, or 2011 (Met Council, 2014b). However, this transition will be difficult as much of the region was
developed around roads and the private automobile. Intensification of land use will be a challenge.
2.2.3 Local Government Plans
St. Paul has the most comprehensive climate change plan among local governments. It plans to source
100% of retail electricity from carbon-free sources by 2050 and reduce SOV trips by 50% relative to 2015
levels by 2050 (City of Saint Paul, 2019). Intermediate SOV trip reduction targets are identified as 10% by
2030 and 40% by 2040. St. Paul also aims to reduce VMT by 2.5% per annum over this period. These goals
will be met through the following TDM initiatives (City of Saint Paul, 2019):
1. Reduce or eliminate citywide minimum parking requirements and set parking maximums for
most land-use types and require developers and landlords to “unbundle” parking from rent.
2. Redesign parking fees to capture the full cost of parking in downtown and other high-demand
commercial districts.
3. Provide a stable funding source to implement the recommendations of the city’s
Comprehensive Plan.
4. Bring together various stakeholders including the city, transit agencies, and community groups
to create affordable housing in the transit market areas defined by Met Council.
5. Implement pricing strategies that accurately capture the cost of driving and auto-centric
infrastructure on city roads.
6. Identify strategies to mitigate the impacts of inner-city highways including capping, conversion
to boulevards, or complete removal.
7. Incentivize infill development by implementing smart growth strategies described in the city’s
draft Comprehensive Plan.
8. Increase the number of communities that are mixed-use and higher density.
9. Implement the “Vision Zero” program recommendation of the Comprehensive Plan to achieve
zero traffic fatalities on city rights-of-way.
The city set the goal of a 6% increase in transit ridership from 2015 by 2030, 25% by 2040, and 40% by
2050 based on the following transit initiatives (City of Saint Paul, 2019):
1. Ensure shared mobility options are located within 0.25 miles of transit service to increase
options for the first and last mile.
112. Work with city, state, regional, and federal stakeholders to identify long-term sustainable
funding strategies to complete the planned build-out of transit lines.
3. Create high-frequency rapid transit in all parts of the transit market areas defined by Met
Council.
4. Increase transit coverage in concentrated areas of poverty to increase access to jobs and
destinations in the downtown core; ensure mobility options remain public and accessible.
5. Support transit with last-mile solutions including electric car-share, standard or e-bike share,
and scooters that will become more broadly available at mobility charging hubs.
6. Streamline services to prevent redundancy and enable passengers to easily understand routes
and schedules.
7. Strategically place stops to improve transit speed and reliability.
8. Upgrade and refurbish highly used transit stops to include amenities such as benches, shelters,
trash cans, wayfinding signs, and lighting.
9. Relocate stops that feel unsafe or are placed near high-speed vehicle traffic.
10. Invest in all-door boarding and off-board fare payment.
11. Improve accessibility at transit stops for those in wheelchairs or with limited mobility. Continue
to add ADA-compliant pads, and prioritize improvements in neighborhoods experiencing
poverty.
12. Create a framework where ride-hailing services reduce overall trips by combining them with
other tools such as walking, biking, transit, shared rides, and compact development.
Building goals include green building standards, energy conservation programs, and stricter energy codes
in new developments. St. Paul has a goal of diverting 40% of waste from landfills by 2020 and 80% by
2030. The plan includes a set of fifteen efforts to improve bicycle and walking facilities to encourage a
shift to these modes, including buildout of the bicycle network, incentives for bike-share membership,
and filling 327 miles of gaps in sidewalk connectivity.
St. Paul also addresses vehicle electrification. It sets a timeline for EV fleet penetration of 33% by 2030,
80% by 2040, and 100% by 2050. In support of this goal, the city plans to install 64 level-2 chargers by
2030, 600 by 2040, and as many chargers as required by 2050. St. Paul also plans to have 75 charging
hubs by 2030, 100 by 2040, and 300 by 2050. It supports these goals through the following planned
regulations and initiatives (City of Saint Paul, 2019):
1. Continue to increase access to shared electric vehicles in partnership with car-sharing services
and Xcel Energy.
2. Ensure all residents are within a quarter-mile of a mobility charging hub.
3. Incentivize electric vehicle sales by providing charging at city-owned parking lots and working
with employers to provide workplace charging.
4. Provide a regulatory framework to permit charging on residential streets in front of multifamily
dwellings.
5. Proactively encourage the safe use of non-car electric vehicles such as e-bikes and scooters on
city rights-of-way.
6. Implement building ordinances that require new developments to have wiring capacity to
charge electric vehicles and reserve a percentage of new parking spots for exclusive EV use.
127. Encourage electric car-sharing programs to help familiarize residents with EVs, while reducing
total driving demand. Prioritize deployment of these programs in areas with low levels of car
ownership.
3. PASSENGER GHG REDUCTION STRATEGIES
This section provides a summary of potential GHG-reducing measures that could be implemented by
Met Council for the passenger transportation sector.
3.1 Roadway Design Improvements
There are several “easy wins” in roadway design that have been shown to reduce GHG emissions.
Roundabouts are well known to offer accident reduction, long-term maintenance costs, and lower
stopped delay benefits. Several studies have computed the emission benefits of roundabouts to
traditional signalized intersections either as before-after treatments (Mandavilli et al., 2003; Várhelyi,
2002) or simulations (Hesch, 2007). A roundabout treatment yields decreases of 16-29% in CO2, 16-21%
in NOx, 19-21% in CO, 18-26% in HC, and 28% in fuel consumption compared to existing levels of a
signalized intersection1. However, roundabouts may increase the amount of acceleration and
deceleration of vehicles such that expected average emission benefits are highly dependent on driver
behavior (Hallmark et al., 2011). Finally, roundabouts are not a feasible solution at many intersections and
the reconstruction of the intersection includes non-negligible emissions that are not included in the above
estimates.
The synchronization of signals (green waves) has been shown to reduce emissions of CO2, NOx, and PM10
by 10-40% relative to an unsynchronized signal design (De Coensel et al., 2012). It should be noted that
reductions for both roundabouts and signal synchronization are measured only for emissions produced at
the intersection and are not given relative to total GHG emissions. As such, the cumulative impact on the
emissions for the MSP region would be small.
3.2 Vehicle Fuels
Vehicle fuels contribute to GHG emissions through well-to-pump (WTP) and pump-to-wheel (PTW)
emissions if a holistic inventory is taken. PTW emissions are declining on a per-mile basis as the efficiency
of vehicles increases and fleet turnover cycles out less efficient vehicles (Wu, 2006). Biofuels, made from
organic matter, have long been proposed as petroleum alternatives. In the U.S, corn-based ethanol is the
main blending component in gasoline, typically up to 10% ethanol by volume, also known as E10. Demand
for higher ethanol blends (E15 and E85) remains limited, mostly because of infrastructure, economic, and
distribution barriers. Additionally, fuels containing between 51% and 83% ethanol by volume require
special engines, which require the purchase of a flex-fuel vehicle (FFV) (EIA, 2021). Over their lifetime,
FFVs, using corn-based ethanol in place of petroleum-based gasoline, reduce GHG emissions by 34%,
considering land-use changes to grow corn. However, the actual reduction is dependent upon the
frequency of refueling with E85 versus E10 blends (Wang et al., 2015).
Biodiesel is produced domestically from vegetable oils, animal fat, or recycled restaurant grease. Biodiesel
is commonly blended with petroleum-based diesel to produce B5 and is consumed at a rate of 1,985
million gallons annually (AFDC, 2020). Biodiesel blends beyond B5 are problematic in colder climates and
1Mandavilli et al. (2003) found significantly larger reductions in the PM hours across sites in Kansas and Nevada
(42% in CO, 59% in CO2, 48% in NOx, 65% in HC) than reductions in the AM hours.
13do not provide any additional benefit of added lubrication from a higher cetane number. Biofuels can
reduce emissions if the combustion is offset by the carbon dioxide absorbed from growing soybeans.
3.3 Personal Vehicle Electrification
Electrification of vehicles is a core GHG emission reduction strategy identified in most forecasts. However,
the ability of EVs to produce significant reductions in GHG emissions will require a shift in the electricity
generation grid and adoption well beyond current market trends. Currently, there are more than 1.18
million electric vehicles (plug-in hybrid electric vehicles - PHEVs, hybrid electric vehicles - HEVs, and
battery electric vehicles - BEVs) on the road in the U.S., with sales up 81% in 2018 over 2017 (EEI, 2019).
BEVs made up 66% of the U.S. EV market share in 2018, compared with 53% and 54% in 2016 and 2017,
respectively. China, long favoring BEVs over PHEVs, has a market share of 75% BEVs while the European
Union is at 54% BEVs. About 2.1% of all light-duty vehicle sales in 2018 were EVs, up from 0.7% in 2015;
mostly because of a strong performance by the Tesla Model 3, taking in 40% of the market share (Hertzke
et al., 2019). At a starting price of $35,000 2, the Model 3 is not an affordable entry into the EV market.
Experts predict that, with battery cost reductions, cost parity with internal combustion engine vehicles
(ICEVs) is attainable between 2024 and 2029 for a 150 to 300-mile range EV (ICCT, 2019). Once cost parity
with ICEVs is reached, policies akin to polluter-pays taxation, public charging infrastructure build-out and
subsidization, and consumer campaigns are critical to fast-track adoption of EVs. Since early adopters tend
to have a stronger interest in environmental benefits and improved fuel economies than the overall
population, estimates of gasoline reductions should more appropriately compare EVs to a more fuel-
efficient ICEV rather than an average ICEV. After cost parity, the switch to EVs will truly offset gasoline
consumption from fuel-inefficient vehicles.
PHEVs are promoted as a low-cost entry into vehicle electrification. PHEVs directly shift fossil-fuel
consumption to lower carbon-intensive electricity while also releasing zero localized emissions when
driven in electric mode. Even in markets where electricity generation has a high carbon content, power
plants could take advantage of scale to implement carbon capture and sequestration and result in lower
point source emissions than vehicle tailpipes for the same energy output per mile. If PHEVs or BEVs
become a market success, then utilities must rapidly change their feedstock to low-carbon fuels and make
investments in technologies to meet regulatory criteria air pollutant standards (Kockelman et al. 2008).
Estimating the reduction of GHGs from PHEVs is complicated by the variety of fuel sources of an electric
utility’s feedstock, estimations of VMT in electric or hybrid mode, and charging frequency (especially if
households do not have access to overnight charging). One study capturing the distribution of daily driving
patterns noted that vehicles with electric ranges between 20 and 40 miles could capture 50-75% of an
average driver’s trips, assuming nighttime at-home charging was available. Assuming a base PHEV with a
25-mile electric range3, the annual tailpipe emissions that could be abated are 440-650 kg of CO24 (Paul et
al., 2011; N Quarles & Kockelman, 2017).
With the popularity of Tesla’s Model 3, General Motor’s announcement of retiring the Chevrolet Volt, and
increased electric-range development in mass-produced batteries, BEVs are expected to constitute 90%
of all EV sales by 2040 (BNEF, 2020). Compared to PHEVs, which have flexibility in their fuel source, BEVs
2 Not considering EV tax credits that may be available to consumers.
3 Based on the 2020 Toyota Prius Prime with an annual VMT of 11,244 from AFDC (2018).
4 The reduction of CO emissions, if accounting for the production and distribution of fuel (including electricity),
2
can be between 1,012 and 1,518 kg (US DOE, 2017)
14are driven less than other similar vehicles (refer to Gohlke & Zhou, 2018 for sources). Not only will
electrification of VMT reduce total emissions, but it will also generally reduce annual VMT, by up to 15%,
particularly for short-range BEVs. Future effects of electrification when coupled with automated vehicles
(AVs) and shared automated vehicles (SAVs), which are expected to increase annual VMT, are unknown
but will certainly lower localized emissions relative to ICEVs (Lawal et al., 2020; Neil Quarles et al., 2019).
Advances in electric battery storage are increasing the range of electric miles for PHEVs, from an initial
all-electric range of 10 miles to 30 miles today. According to the 2013 “Transitions to Alternative Vehicles
and Fuels” report (National Research Council, 2013), a 10-mile range PHEV runs 19% of its miles on
electricity and a 40-mile range PHEV runs 55% of its miles on electricity. Using their baseline, GHG
emissions reductions are in the range of 36% to 60% and 51% to 70% for PHEV-10 and PHEV-40,
respectively, based on a 2030 electricity grid. Travis County, Texas (surrounding Austin) projected the
effects of a 20%, 40%, and 80% BEV share of the total light-duty vehicles for 2050 on energy requirements
and avoided CO2eq emissions. A 20% BEV share (300,000 vehicles) would require an additional 900,000
MWh of energy, which would offset about 1.59 metric tons of CO2eq annually if the added energy came
from renewables. This conservative scenario would only increase utility electricity demand by 7% of
current sales (City of Austin, 2015).
Milovanoff et al. (2020) compare the life-cycle emissions (i.e., battery production, fuel production, fuel
use, and vehicle production) for several ICEV and BEV vehicle classes and scenarios for potential 2030 U.S.
electricity grids (see Figure 12). They find that, in all cases, BEVs offer a significant improvement in GHG
emissions over ICEVs. However, there remain significant impacts associated with fuel production, that is
anticipated emissions from electricity generation.
Figure 12 Life-cycle CO2 emissions aggregated at a vehicle level for 2018 and 2030 model-year, under
three electricity production scenarios (SSP1, SP2, and SSP5) (Milovanoff et al., 2020)
15Figure 13 shows a range of forecasts of BEV penetration to 2050. As noted above, the city of St. Paul has
set a goal of 100% of vehicle sales being EVs5 by 2050, which would translate to EVs being about 80-90%
of the light-duty vehicle (LDV) fleet by that year. Absent policy changes, all forecasts anticipate BEV
penetration of less than 20% by 2050. The most ambitious NREL scenario (NREL-High) predicts a market
penetration of 60%, or 80% with the addition of PHEVs. A recently completed national study of pathways
to deep decarbonization (Zero Carbon Action Plan or ZCAP) finds that penetration needs to be closer to
95% by 2050 to meet a 1.5˚C target using only fuel shifting and electrification policy strategies (Sustainable
Development Solutions Network, 2020). Other research finds that meeting the transportation component
of a 2˚C threshold on global warming with EVs alone would require a fleet of 350 million vehicles (or about
90% of the fleet) by 2050 (Milovanoff et al., 2020) and that the electricity required would represent half
the national electricity demand if charging times are not coordinated (Muratori, 2018).
Figure 13 Range of BEV forecasts from several sources (BNEF, 2020; EIA, 2021; Lin & Greene, 2013; Mai
et al., 2018; Sustainable Development Solutions Network, 2020)
Clearly, there is a range of factors that influence the adoption of EVs and a high degree of uncertainty as
to their market penetration within the forecast horizon of 2040. These changes are dramatic but recent
efforts to address COVID-19 and deploy vaccines provide some indication of our collective ability to act
for the common good. Several sources that consider EV adoption also discuss the need for policies to
encourage the adoption of lighter and more efficient vehicles within the existing ICE vehicle stock
(Pacala & Socolow, 2004). Milovanoff et al. (2020) provide the following summary of the mitigation gap
associated with EV adoption. In this figure, SSP 1-5 represent a range of expectations for future socio-
economic conditions. SSP 1 represents a globalized economy with an emphasis on rapid technology
development with low carbon and energy intensity. SSP 2 represents a business-as-usual scenario with
large variations in social development between countries and moderate technological development to
address climate change. SSP 5 is included as an example of continued reliance on fossil fuels but with
highly engineered solutions (i.e., carbon capture and storage). SAFE standards are the current emissions
standards for the U.S., replacing the stricter standards set under CAFE (National Highway Traffic Safety
5The City of St. Paul does not provide specifics on the definition of EV in their plans. Given the references to
charging infrastructure, it can be assumed that they are referring to BEVs and possibly PHEVs.
16Administration & Agency, 2018). EV30@30 denotes an IEA objective of 30% of vehicle sales in 2030
being EVs (IEA, 2019). The effect of EVs on decarbonization depends on the composition of the
electricity grid, which is represented by “2018ef” (2018 emissions factors) and “ren” (100% renewables).
This analysis shows that EV adoption is insufficient to meet decarbonization objectives under any of the
scenarios. It requires the widescale adoption of renewable electricity generation and more stringent
emissions standards on the extant ICE vehicle fleet. Note that these results depend on a highly uncertain
CO2 emissions budget. With other assumptions, the set of measures included in Figure 14 do not meet
the 2oC goal even with a 30% EV sales penetration, a 100% renewable grid, and the reinstatement of
more stringent fuel economy standards (only satisfying about half of the mitigation gap).
Figure 14 2015-2050 U.S. LDV fleet CO2 emissions in a baseline case (top dark blue bar) and changes
associated with growing LDV fleet, policies, and electrification under the EV30@30 compared to 2 °C
2015-2050 CO2 emission budget (Milovanoff et al., 2020)
With the above caveats, recent trends suggest an increasing probability of high EV adoption. As recent
as 2008, researchers were assuming EVs would not “account for a significant fraction of new vehicle
sales (e.g., equal to or greater than 5 percent)” (Bodek & Heywood, 2008) in Europe by 2035. Yet, an
October 2020 sales report found that total EVs (BEV+PHEV+HEV) now account for 25% of vehicle sales
across 27 European markets (JATO, 2020). However, there are further considerations in assessing EV
market penetration in the United States due to differences in willingness to accept market intervention
and variation in income. The current market leader in EV adoption is Norway, which has a high taxation
rate to support large EV purchase subsidies (about US$15,000 to US$18,000). It also has among the
highest carbon prices at about US$59 per metric tonne of CO2eq (Axsen et al., 2020). Throughout this
17You can also read