Measuring discrepancies in Airbnb guest acceptance rates using anonymized demographic data - The Airbnb anti-discrimination team
←
→
Page content transcription
If your browser does not render page correctly, please read the page content below

The Airbnb anti-discrimination team

Measuring discrepancies in
Airbnb guest acceptance
rates using anonymized
demographic data
The Airbnb anti-discrimination team is: Sid           We would like to thank the following reviewers for their
                                                      feedback: Dr. Latanya Sweeney and Jinyan Zang (Data
Basu*, Ruthie Berman, Adam Bloomston*, John           Privacy Lab at Harvard); Dr. Cathy O’Neil and Jacob Appel
Campbell, Anne Diaz*, Nanako Era, Benjamin            (O'Neil Risk Consulting & Algorithmic Auditing); Antony
                                                      Haynes, J.D. (Director of Cybersecurity and Privacy Law
Evans, Sukhada Palkar, and Skyler Wharton.
                                                      at Albany Law School); Gennie Gebhart, Kurt Opsahl,
The symbol * denotes corresponding authors—they may   and Bennett Cyphers (Electronic Frontier Foundation);
be reached at antidiscrimination-papers@airbnb.com.   Harlan Yu, Aaron Rieke, and Natasha Duarte (Upturn);
                                                      Mallory Knodel (Center for Democracy & Technology);
                                                      and Dr. Conrad Miller (Assistant Professor of Economics
                                                      at Berkeley Haas School of Business).

                                                      Any mistakes in this paper are the sole responsibility of
                                                      Airbnb. In the interest of encouraging others to adopt
                                                      this methodology, Airbnb and the authors formally
                                                      disavow any intent to enforce their copyright in the
                                                      content of this technical paper. Airbnb will not be liable
                                                      for any indemnification of claims of intellectual property
                                                      infringement made against users by third parties.
Introduction

Airbnb wants to create a world where                               In order to understand the true impact of such interventions,
                                                                   we must be able to measure how guests and hosts from
anyone can belong anywhere.                                        different demographic groups experience Airbnb. Specifically,
                                                                   our team would like to measure experience gaps on Airbnb
We take this mission to heart, so we were deeply troubled by       that are attributable to perceived race. We say that an
stories of travelers who were turned away by Airbnb hosts          experience gap occurs when one group of people is adversely
during the booking process because of the color of their skin.     impacted by a part of our product experience more than
#AirbnbWhileBlack became a trending hashtag, and we heard          another group. This concept is best understood through a
from many hosts and guests who shared painful stories of           concrete example. Airbnb's homes booking process connects
being discriminated against.                                       hosts, who list spaces where one can stay, to guests, who are
                                                                   searching for lodging. We can define a metric, the acceptance
No online platform or marketplace is immune to the problems        rate, as the rate at which hosts accept guests’ reservation
of racism and discrimination, including Airbnb. To help create     requests. We can then compute this metric for different
a world where anyone can belong anywhere, we knew we had           groups of guests in our study. The gap between acceptance
to do more to fight discrimination and bias.                       rates for guests in two different groups is an experience gap
                                                                   which, in this case, we call an acceptance rate gap (ARG).
We responded by making a series of commitments to combat
discrimination [Murphy 2016]. In addition to an overhaul of our    Since discrimination is generally a result of one person's
non-discrimination policy and improved responses to reports        perception of another, we've chosen to concentrate on
of discrimination, one of our more substantial commitments         measuring inequities with respect to these perceptions, which
was to form a permanent anti-discrimination product team           we’re calling perceived race [Smedley 2005]. There are many
dedicated to fighting discrimination on Airbnb and ensuring        nuances in how these perceptions are made and influence
that everyone has equal access to the trips they want to take.     human behavior that warrant further exploration. To narrow
Over the past few years, the team has focused specifically         the focus of this initial paper, we concentrate on how to
on discrepancies in the product experience that may be             measure the acceptance rate gap between guests who are
attributable to race, and has introduced a number of product       perceived to be white and guests who are perceived to be
improvements intended to address the features of the online        black within the United States.
Airbnb experience that were adversely affecting some racial
groups more than others. These discrepancies can be the
result of explicit or implicit discrimination on an individual
level (e.g., between hosts and guests), as well as the result of
broader, systemic inequities [Edelman 2014, Edelman 2017].
Our most notable product change to date has been
to time the display of the guest profile photos with a
confirmed booking, in order to reduce bias in the
booking request process.

                                                                                                                               3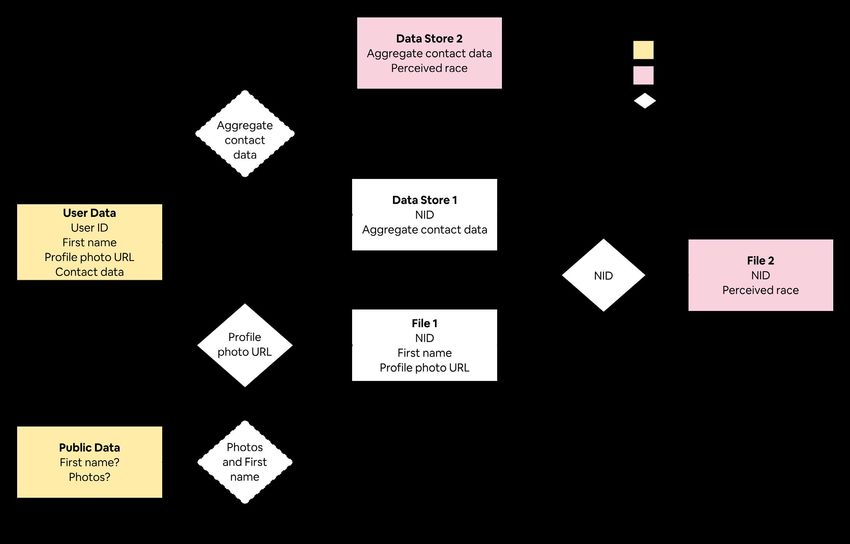
It is important that we strive to provide the highest degree of                   The impact that technology companies have on our daily
privacy protection we can for Airbnb hosts and guests while                       lives cannot be overstated, and with that impact comes a
we conduct this measurement. The problem of balancing                             tremendous responsibility to treat the people who rely on
data utility and privacy is a complex one, with no clear cut                      our products with integrity and respect. Our hope is that this
solution. Nevertheless, we believe that it is critically important                technical paper can serve as a blueprint for other companies.
to protect the privacy of our community. The risk of misuse                       We also hope it can be a starting point for further innovations
of perceived race data is serious, whether from internal or                       that not only rigorously measure discrepancies present on
external threats.                                                                 online platforms, attributable to perceived demographics, but
                                                                                  also uphold user privacy.
We have developed our system with the help, guidance, and
insight of several civil rights partners, privacy groups, and
academic advisors. The system is designed to minimize the
risk that individuals’ perceived race can be retrieved from the
data that are used to make measurements. We achieve this
by enforcing the privacy model of p-sensitive k-anonymity in
order to prevent certain attribute disclosure; we also utilize
asymmetric encryption across trust boundaries to ensure that
data flows are one-way. Because anonymization can adversely
affect data utility, we have developed a simulation-based
methodology to understand the effect of data anonymization
on statistical power. Our analysis shows that, even with
anonymized1 data, we can still achieve an adequate degree of
statistical power to measure the efficacy of interventions to
reduce the acceptance rate gap.

1 We define anonymized, anonymity, and anonymization as used throughout this technical paper in the section Technical overview: Disclosure threat
categories.                                                                                                                                         4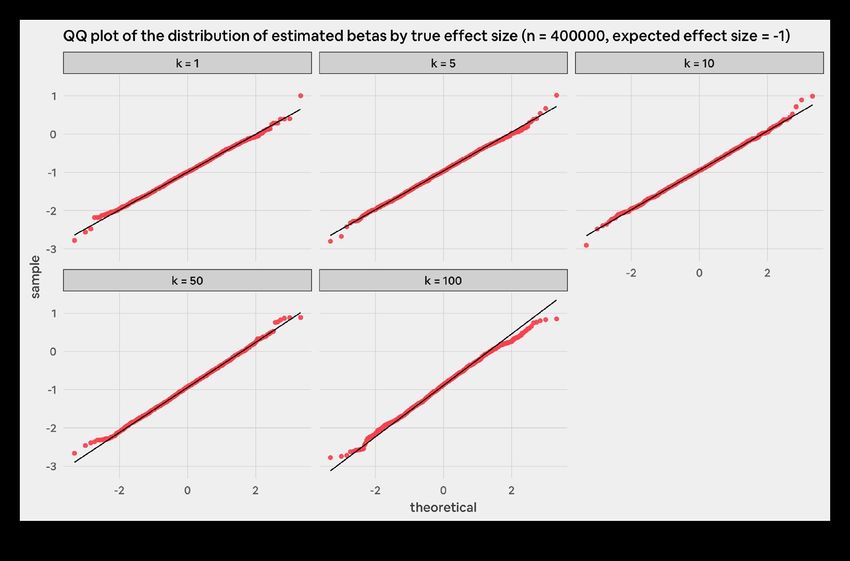
Technical overview

The goal of this paper is to present a system                    This bar is not meant for all companies nor all contexts—we
                                                                 believe it is most appropriate for companies whose scale of
that analyzes the acceptance rate gap                            impact merits it and whose resources allow for meeting such a
using anonymized perceived race data. In                         high bar. Our goal in this paper is to empower such companies
                                                                 with the knowledge and tools they need to measure and
this section, we provide more details about
                                                                 mitigate experience gaps without having to engage in
the technical objectives of this system,                         privacy-by-design from scratch.
discussing both privacy and data utility.
                                                                 The tension between respecting/preserving the privacy
                                                                 of our users and leveraging the benefit of granular data is
Perceived race data is needed to measure the acceptance          ever-present in privacy-conscious data analysis and research
rate gap. However, the data we use need not be identifiable,     [AEPD 2019, Sweeney 2000, Mendes 2017]. In the following
or attributable to an individual user. Safeguarding our hosts’   two subsections, we provide more details on both sides of
and guests’ data and protecting their privacy is critical to     this tradeoff. We start by discussing more technical details
the success of our work. Therefore, we want to only collect      about the privacy threats our system is designed to mitigate,
and store data at a minimum level of identifiability required    before defining the privacy objective of our system. We then
to accurately measure discrimination so that, in the event       discuss how we measure the usefulness of anonymized data in
of internal misuse or external leakage of data, users cannot     measuring the acceptance rate gap.
be targeted at scale based upon their perceived race. At
this point, we also note that our process of measurement is
constrained to only our US communities—the system we’ve
developed to ensure we restrict analysis to only our US
communities is outside the scope of this paper.

External leakage of data and abuses of confidential data are
well-catalogued phenomena [Shabtai 2012, Sweeney 1997].
Were we merely dealing with confidential demographic data,
this alone would warrant heightened rigor and scrutiny. In our
context, the bar is raised even higher because:

 • We’re dealing with particularly sensitive demographic
   data, race, in a country with a history of racial
   discrimination and profiling [Rothstein 2017].

 • These data are being handled by a large technology
   company (Airbnb), and the technology industry as a
   whole deserves increased scrutiny regarding the use
   (and potential mis-use) of personal data [Hern 2018].

                                                                                                                             5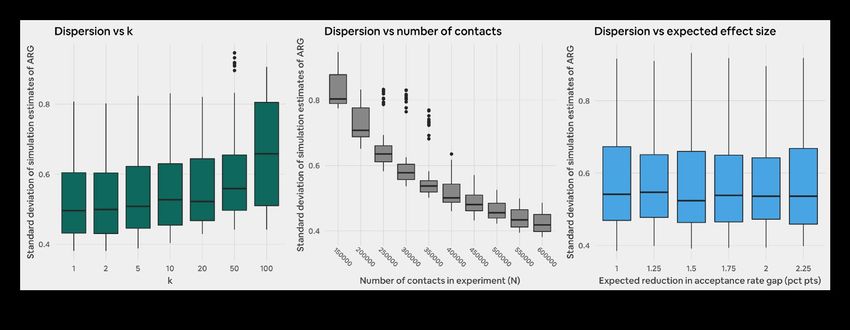
Disclosure threat
categories
For the purposes of this 1 paper, an unauthorized disclosure
occurs when an attacker (also referred to as misactor) gains
unauthorized access to sensitive data [Lambert 1993]. In this
subsection, we categorize the different disclosure threats
described in the privacy literature. We then conclude this
subsection with a precise definition of what we mean when
we say the perceived race data in our system is anonymized.

We discuss three types of disclosure threats, in order of
increasing specificity:

 1. Membership disclosure occurs when an attacker gains
    knowledge about whether or not a person’s record exists
    in a dataset [Gkoulalas-Divanis 2014]. Other terms for this
    include: table linkage [Fung 2010].
 2. Attribute disclosure occurs when an attacker gains
    knowledge about a sensitive value or values associated
    with a person.
 3. Identity disclosure occurs when an attacker gains
    knowledge about which row or rows in a dataset may
    correspond to a person [Gkoulalas-Divanis 2014]. Other
    terms for this include: singling-out [Article 29 DPWP
    2014], re-identification [Lambert 1993], and unique re-
    identification [Sweeney 2018].

See figures 1-3 on the right for examples of each type
of disclosure.

                                                                  6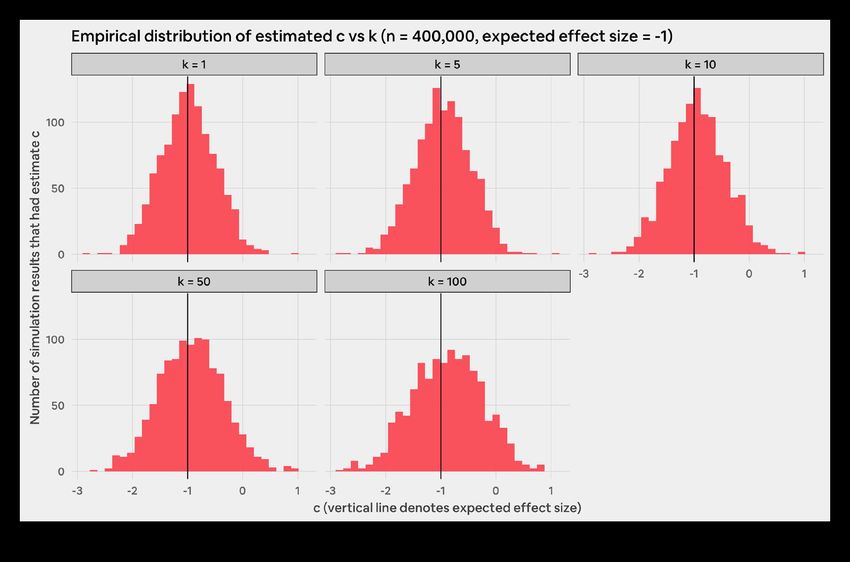
Disclosure can vary from probabilistic to certain: probabilistic                     disclosure—because of this focus (sensitive attribute in
disclosure occurs when an attacker has increased their                               lieu of membership, certain in lieu of probabilistic),
knowledge through an attack, but not to the point of being                           ε-differential privacy is not an appropriate base privacy
certain2 —this occurs when they are able to revise their                             model on which to build our system. However, in future
posterior beliefs to be largely different from their prior beliefs                   work non-interactive forms of differential privacy may be
[Fung 2010, Machanavajjhala 2006]. Additional terms used                             overlaid to mitigate probabilistic disclosure—see the section
for various probabilistic disclosures are inferential disclosure                     Future work: Limiting probabilistic disclosure [Fung 2010,
[HealthStats NSW 2015], inference [Article 29 DPWP 2014],                            Mohammed 2011].
skewness attack [Domingo-Ferrer 2008, Li 2006], group re-
identification [Sweeney 2018], and background knowledge                              The scale of potential disclosure is also relevant. Our
attack [Machanavajjhala 2006]. See Figure 4 below for                                paper discusses disclosure with respect to an individual for
an example.                                                                          convenience of language, but our goal is really to mitigate
                                                                                     the risk of disclosure at scale so that a significant number of
A disclosure may provide an attacker knowledge that may be                           users cannot be targeted based upon their perceived race.
correct or incorrect. A disclosure may still cause harm even                         After all, if a misactor is looking to target a relatively small
if incorrect [Article 29 DPWP 2014, Sweeney 2018, Lambert                            number of users based upon their perceived race, rather than
1993]. In considering disclosure in our system, we do not                            attempting a complicated privacy/security attack, the easiest
distinguish between disclosure that is actually correct or                           way to do so would be to manually perceive the race of those
incorrect—we aim to mitigate the risk that these data can be                         users themselves by using available data. In other words, we
used to target individual users based upon perceived race at                         want to ensure that unauthorized access to the perceived
scale, regardless of correctness.                                                    race data doesn’t help a misactor to target individuals based
                                                                                     upon their race much more than access to the identifiable
For our purposes, identifying a user in a dataset (a breach of                       data (profile photo and first name) alone.
anonymity) is only relevant if doing so leads to knowledge
of the user’s perceived race (a breach of anonymity with                             In summary, we consider data to be anonymized in this
respect to an attribute [Sowmyarani 2013]). In other words,                          initiative if the risk of certain sensitive attribute disclosure
we’re primarily concerned with attribute disclosure where the                        at scale (where the sensitive attribute is perceived race)
sensitive attribute is perceived race. Membership disclosure                         is sufficiently mitigated. In the section System design, we
isn’t relevant in our context because it won’t lead to certain                       describe how we enforce the privacy model of p-sensitive
knowledge of perceived race (this is tied to the p-sensitivity                       k-anonymity in order to prevent certain sensitive attribute
of the dataset, discussed in later sections). Identity disclosure                    disclosure; in a later section, Disclosure risk analysis, we
is only relevant insofar as the row or rows contain perceived                        analyze how the system mitigates the disclosure
race, in which case attribute disclosure has also occurred.                          risks discussed.
Our primary focus is thus on preventing certain attribute

2 Our threat categorization differs from [Fung 2010] in considering certainty a dimension among the three types of threats (in [Fung 2010] termed table,
attribute, and record linkage) rather than a fourth type disclosure (in [Fung 2010] termed probabilistic attack).                                          7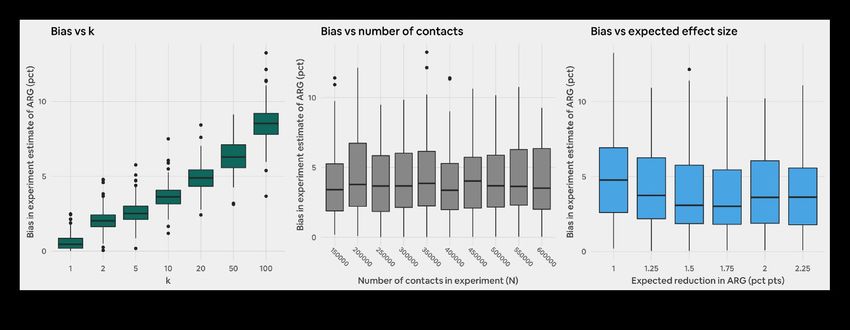
Data utility
While identifiable data is not necessarily required to measure                         problem as it pertains to Airbnb from the ground up. We
the acceptance rate gap, the anonymization process could                               might use these data, for example, to study patterns in Instant
still make accurate measurement difficult or impossible. The                           Book usage. Instant Book allows guests who meet a host’s
literature has shown that anonymization can harm data utility,                         requirements book a place to stay immediately without
the usefulness of data for analysis [Wu 2013, Daries 2014,                             needing the host’s individual approval. Since Instant Book
Angiuli 2015]. Given the importance of our team's ability to                           leads to a 100 percent initial acceptance rate3, making it easier
measure progress, we have decided to engage in an in-depth                             for people to use Instant Book can lead to a reduction in the
study of how the anonymization process affects data utility.                           acceptance rate gap. Task-independent measures of data
We focus on task-specific data utility, where the task we                              utility, such as those discussed in [Gkoulalas-Divanis 2014],
study is measuring the impact of features intended to reduce                           are valuable in ensuring that the anonymized data is useful for
the acceptance rate gap. We are interested in the effect of                            such applications.
anonymization on statistical power—the probability that we
detect a change if a true change occurred. We develop a                                The rest of the paper is outlined as follows. The next section
simulation-based framework to analyze this relationship. We                            provides an in depth overview of the System design,
find that, while enforcing anonymity reduces statistical power                         introducing the privacy model of p-sensitive k-anonymity
through a 0-20% relative increase in minimum detectable                                and the mechanism we use to enforce it. Simulation
effects, we can offset this impact through running studies                             construction and results then discusses the data utility
with larger sample sizes. More details can be found in the                             of the anonymized data. The next section, Disclosure risk
section Simulation construction and results. The framework                             analysis, enumerates the certain sensitive attribute disclosure
we present was designed to be adaptable to other contexts,                             threats present in the system. We conclude by discussing
acting as a supplement to more general measures of data                                potential improvements to our system in Future work, before
utility that are task-independent.                                                     summarizing key takeaways in the Conclusion.

The anonymized perceived race data described in this paper
may help us measure, and consequently work to mitigate,
experience gaps beyond the acceptance rate gap. There’s no
blueprint for combating discrimination on online platforms, so
we have to develop an understanding of the

3 Instant Book in its current form is not an effective blanket solution for the acceptance rate gap. Additional internal research has shown that, given
concerns about discrimination, Instant Book is not always an attractive or perceived-as-viable method of booking for Black guests.                        8
System design

In this section, we walk through a simplified                    Perceive Race: our research partner assigns perceived race to
                                                                 pairs of photos and first names. The existence of this separate
data flow diagram of a system that allows                        organization (and associated trust boundaries) allows for the
our team to, in the final step, measure the                      data flow to be one-way to mitigate the risk that it be re-
                                                                 linked to the k-anonymized data by Airbnb.
acceptance rate gap using anonymized
perceived race data. As we walk through                          P-Sensitize: we perturb the results of the previous process in
                                                                 order to achieve p-sensitivity prior to storing it.
each process and its associated datastores,
we introduce the relevant privacy models                         Measure ARG: we use the k-anonymized p-sensitive data to
                                                                 measure the acceptance rate gap (ARG).
k-anonymity and p-sensitive k-anonymity and
associated anonymization methods.

The main processes in our system are:

Guest Booking + Select Guest Data: the process by which
US guests book on Airbnb and we collect the relevant data
for computing acceptance rates (e.g., whether a reservation
request was accepted or rejected).

K-Anonymize: this process has two main components:

 1. Using a combination of generalization and suppression
    to achieve k-anonymity for the data used to compute
    acceptance rates.

 2. Preparing data for a research partner to perceive race.
    The research partner is an external affiliate who is under
    a confidentiality agreement with Airbnb and has their
    systems reviewed by Airbnb security. We use asymmetric
    encryption to ensure that the internally identifiable data
    prepared exclusively for and sent to the research partner
    cannot subsequently be retrieved by Airbnb and re-linked
    to the k-anonymized data.

                                                                                                                                  9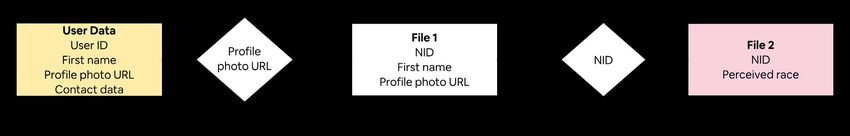
Figure 5 below maps out how these processes relate to each       4. Trust boundaries, e.g., Airbnb anti-discrimination Team
other in a Data Flow Diagram (DFD). There are four types of         Trust Boundary, represent boundaries where the level of
entities in the DFD:                                                trust changes so that, for an actor to have access to data
                                                                    in datastories and access to run processes within a trust
 1. Data stores, e.g., User Data, are databases or files.           boundary, they would need to be authorized appropriately.
 2. Processes, e.g., Select Guest Data, transform input data        A misactor may gain unauthorized access to entities within
    into output data flows.                                         a trust boundary, as discussed further in the more detailed
                                                                    analysis in Appendix 2: LINDDUN privacy analysis.
 3. Data flows, e.g., the arrow from User Data to Select User
    Data, show how data is moved across the system, either      We now examine each process in detail.
    between processes or to/from data stores.

                                                                                                                             10
Guest Booking Select Guest Data
Guest Booking is the process by which a guest interacts with The Airbnb anti-discrimination team's data scientist prepares
the Airbnb platform in order to book a stay. This process an aggregation of US guests’ booking acceptances and
has been described in the section Technical Overview. The rejections to measure the acceptance rate gap. Table 1 on the
resulting data from this process is stored in User Data and is left provides an example output for Select Guest Data that is
available to Airbnb data scientists to conduct analyses. Some used in the remainder of this paper. Safeguards and processes
examples of the data collected include: which listing a guest to ensure only US guest data are analyzed are outside the
tried to book, whether they were accepted, and whether or scope of this paper.
not they used Instant Book. Details of this process are outside
the scope of this paper. Membership and identity disclosure threats are inherent
in this dataset due to the identifying attribute user_id.
Furthermore, given knowledge of membership, an attacker
may be able to achieve identity disclosure through the
other attributes in the dataset. Quasi-identifiers4 are
those attributes that may be used to determine the guest
associated with a data row through linking to other data
[Dalenius 1986]. In the dataset above, n_accept and n_
reject are quasi-identifiers; for instance, if an attacker knew
there was only one user (user_id = 2) whose aggregation of
contacts by Select Guest Data would produce n_accept =
1, n_reject = 2, then the attacker could uniquely identify
that user’s row in the dataset, even if the identifying attribute
user_id were not present.
Recognition of which attributes are quasi-identifiers and,
more importantly, recognition of which attributes are
not quasi-identifiers, cannot be done perfectly due to (1)
incomplete knowledge of the data recipients knowledge
[Sweeney 1997] and (2) increasing availability of data and
capabilities for linkage attacks over time [Cavoukian 2012]. (1)
covers to some degree the notion of an internal attacker with
access to analytics data on our users [Domingo-Ferrer 2008],
as well as an external attacker gaining unauthorized access
to our systems via hacking or unauthorized scraping (as
considered, e.g., in [Daries 2014]). Additionally, the empirical
risks of re-identification may be higher than the standard
worst-case scenario considered in k-anonymity, defined in the
next section, (1/k) due to additional attributes not considered
as quasi-identifiers [Basu 2015].
This has led to experts' recommendation that all non-sensitive
attributes be considered at least quasi-identifiers unless
explicitly argued otherwise [Sweeney 2018]. Thus, we consider
all attributes, besides perceived race, to be quasi-identifiers
because an attacker may seek to link back to any dataset,
most prominently User Data.
4 Other terms used for quasi-identifier in the literature include: key attributes [Domingo-Ferrer 2008], indirect key-variables [Domingo-Ferrer 2002], q*-
blocks [Machanavajjhala 2006], and pseudo-identifiers [Aggarwal 2005]. 11K-Anonymize
The K-Anonymize process transforms the dataset from Select Suppression means suppressing, or removing, rows or
Guest Data to achieve k-anonymity and prepares data for attribute values from a dataset; it can be helpful when
subsequent processes. In this subsection, we give an overview considering outlier values that, if generalized with other
of k-anonymity5, walk-through two methods together used values, would lead to a significant reduction in data utility
to achieve k-anonymity (generalization and suppression), and [Samarati 1998]. For the example dataset, if we suppress
provide a detailed description of the K-Anonymize process. the row associated with user_id = 5 (whose n_accept
value of 11 is an outlier), we will achieve k-anonymity on the
A group of data rows whose quasi-identifiers have identical dataset for k = 2, as shown in Table 4 below.
values is termed an equivalence class6 [Li 2006]. In Table 2 on
the previous page, we group user_ids by equivalence class In order to measure the acceptance rate, we will need to
so that there are four equivalence classes, or unique values of transform the quasi-identifier intervals into numbers. In order
the tuple n_reject, n_accept. to maximize data utility, we microaggregate the values of
certain quasi-identifiers in each equivalence class by taking
For a dataset to be k-anonymous, besides expunging the arithmetic mean [Domingo-Ferrer 2002]. We discuss
identifiers (in the example dataset, user_id), all equivalence potential improvements to better leverage microaggregation
classes must include at least k data rows [Sweeney 2002]. in Future work: Measuring additional experience gaps.
The above dataset, for instance, is k-anonymous with k = Replacing intervals with arithmetic means yields the
1 because there exist three equivalence classes with 1 row 2-anonymous microaggregated dataset shown in
(user_id) and one equivalence class with 2 rows. k-anonymity Table 5 below.
is often achieved through a combination of generalization
and suppression [Samarati 1998]. We walk through these two Equipped with an understanding of k-anonymity, we can now
methods in sequence below. walk through the K-Anonymize process. First, K-Anonymize
transforms the dataset to achieve k-anonymity as described
Generalization means replacing attribute values with less above. Before discarding the Airbnb internal identifier user_
precise values. In the example dataset, if we examine the id, it generates a random row identifier that will be used for
values for n_accept and n_reject for the equivalence subsequent processes; we call this new identifier a nid. The
classes for user_id = 1 and user_id = 2 in Table 1 on mapping between user_id and nid is no longer available
the previous page we see that n_accept is already identical; after K-Anonymize completes.
if we replace n_reject values of 1 and 2 for these two
rows with the closed interval [1, 2] then we will have
merged the two equivalence classes into one, as shown in
Table 3 below.
5 See Technical overview: Disclosure threat categories for a discussion of our choice of k-anonymity, rather than ε-differential privacy, as our base
privacy model.
6 Other terms for equivalence class include P-set [Narayanan 2008] and QI-group [He 2016]. 12K-Anonymize persists the k-anonymous dataset with nid
to Data Store 1—an example dataset (following the example
Perceive Race
from above) is shown in Table 6 below. Note that Data Store
1 does not yet contain perceived race data—that data is
introduced in subsequent processes below. The Research Partner is given pairs of first names and photos
of Airbnb hosts or guests. First name is provided because
Data Store 1 is stored securely and data is automatically studies have shown that first names are a strong signal for
deleted 30 days after persisting. Access to Data Store 1 perception of race in the United States [Bertrand 2004].
is restricted to authorized members of the Airbnb anti- Appendix 3 Research Partner requirements outlines a
discrimination team. comprehensive list of requirements a research partner must
satisfy, including regular security review and confidentiality.
At this point, the data scientist may inspect Data Store 1
before the remaining processes are followed. This allows They then assign a perceived race to each pair of first names
for additional out-of-band checks on expected data utility and photos. In our system design, we require the Research
prior to initiating the expensive manual process of collecting Partner to engage in the human perception of race, i.e. to
perceived race data (Perceive Race, discussed below). not utilize algorithms for computer perception of race. We’ve
imposed this requirement for two reasons:
K-Anonymize also creates File 1 (using user_id and User
Data) for use by the Research Partner. File 1 contains the data 1. The use of and improvement of algorithms that use facial
required for Perceive Race: a identifier for each user row, the images for perception of race warrants additional scrutiny
user’s first name (seen by the host when they accept/reject a and input from, among others, our outside civil rights and
guest), and the profile photo for the user.An example dataset privacy partners [Fu 2014].
(following the example from above) is shown in Table 7 below.
2. Preliminary internal research has shown that pre-existing
Using a public key provided by Research Partner, File 1 is algorithms that don’t use facial images, such as Bayesian
asymmetrically encrypted prior to persisting so that, because Improved Surname Geocoding (BISG), are not sufficiently
only Research Partner has the private key, Airbnb can no accurate to allow for measuring the acceptance rate gap
longer decrypt File 1 (which is why it lies within the Research with precision [CFPB 2014].
Partner Trust Boundary) and thus loses the linking from nid
A later section Future work: De-identifying user profile
to photo_url. The linkage between nid to user_id is
photos mentions a general method currently being internally
not persisted so that, because File 1 cannot be decrypted
developed of measuring the impact changes to the inputs for
by Airbnb, it is lost when K-Anonymize completes. If Airbnb
Perceive Race, so that we can later more robustly assess the
had access to the data in File 1, they could re-link to user_id
accuracy of pre-existing algorithms such as BISG while still
through nid → photo_url → user_id. This is discussed in
using this overall system and the privacy protections
further detail in a later section, Disclosure risk analysis.
it provides.
13The data defining who to perceive is provided in File 1, for
which only the Research Partner has the private key to
P-Sensitize
decrypt, so that Airbnb doesn’t have access to the data in File
1. The Research Partner creates File 2 with the results—an
example dataset (following the example from above) is shown P-Sensitize joins File 2 and Data Store 1, perturbs
in Table 8 below. perceived_race as needed to achieve p-sensitivity (defined
below), and persists the dataset (without nid) to Data Store
File 2 is also asymetrically encrypted, this time with a public 2. File 1 and File 2 are deleted upon successful persistence to
key provided to the Research Partner by Airbnb; only Data Store 2. If we join the examples for File 2 and Data Store
authorized members of the Airbnb anti-discrimination team 1 from Table 8 and Table 6, we have the dataset in Table 9 on
have the private key (which is why it lies within the Airbnb the left.
anti-discrimination Team Trust Boundary).
While this example dataset achieves k-anonymity for k = 2,
sensitive attribute disclosure may still occur in the following
scenario (known as a homogeneity attack [Basu 2015,
Machanavajjhala 2006]):
1. Suppose an attacker knows that user_id = 1 is in the
dataset (membership disclosure, though knowledge of
Select Guest Data).
2. Through knowledge of the generalization strategy
(knowledge of the business logic in K-Anonymize) the
attacker knows that the user’s quasi-identifiers have been
generalized into the equivalence class with n_accept =
1, n_reject = 1.5.
3. Because all rows in that equivalence class have the same
value for the sensitive attribute perceived_race (a
homogeneous equivalence class), the attacker can infer
that the perceived_race associated with the user_id
= 1 is white.
p-sensitive k-anonymity7 means that each equivalence class
(of cardinality >= k) in a dataset has at least p distinct values
for a sensitive attribute [Truta 2006]. In this example, the
dataset is 1-sensitive 2-anonymous because the equivalence
class n_accept = 1, n_reject = 1.5 has only 1 distinct
value for perceived_race: white. If we would like it to
be 2-sensitive 2-anonymous, we can perturb (or randomly
change) values for perceived_race where needed to
achieve p = 2, which may result in the following modified
dataset in Table 10 on the left.
7 p-sensitivity is sometimes referred to as distinct l-diversity, a simple form of l-diversity [Machanavajjhala 2006]. 14One criticism of p-sensitivity is that it may entail substantially
reduced data utility due to the sparsity of distinct values for
Measure Acceptance
a sensitive attribute in the original dataset [Domingo-Ferrer
2008]. Another criticism is that, if an attacker understands
Rate Gap
the generalization strategies used to achieve p-sensitive
k-anonymity (in this system, knowledge of the business
logic in K-Anonymize and P-Sensitize) and has background The final step in the system is for the team’s data scientist
knowledge of the quasi-identifiers (in this system, knowledge to measure the acceptance rate gap, the experience gap
of User Data and Select Guest Data), they may be able to for which we’re focusing in this paper, using the p-sensitive
achieve sensitive attribute disclosure for some users through k-anonymous aggregate contact data that includes perceived
a minimality attack8 [Wong 2007]. race data in Data Store 2. Further details around how we
measure the acceptance rate gap and changes in it are
P-Sensitize, because it utilizes perturbation rather than provided in the next section, Simulation construction
generalization, circumvents both of these issues: the data and results.
utility reduction is limited by the rows perturbed; a minimality
attack requires generalization in order to infer homogenous
equivalence classes that required further generalization.
Once P-Sensitize perturbs the data to achieve p-sensitivity
(k-anonymity had already been satisfied by K-Anonymize), it
strips the nid and persists the output to Data Store 2—an
example dataset (following the example from above) is shown
in Table 11 below.
Data Store 2, as with Data Store 1, is stored securely, data
is automatically deleted 30 days after persisting, and
access is restricted to authorized members of the Airbnb
anti-discrimination team. P-Sensitize finally deletes File 1 and
File 2.
8 Special thanks to Dr. Cathy O’Neil and Jacob Appel of O'Neil Risk Consulting & Algorithmic Auditing for constructing a scenario demonstrating a
minimality attack. 15Simulation construction
and results
In this section, we lay out the methodology More specifically, we analyze how data anonymization affects
the statistical power of these tests, as well as the distribution
we use to understand how anonymizing data of the estimates that they yield. We develop a simulation-
affects our ability to measure the acceptance based framework for this: we vary parameters such as the
value of k we use in k-anonymization, how long we run A/B
rate gap.
tests for, and the effectiveness of our interventions. We
then study the relationship between these factors and our
The literature has shown that anonymization can adversely measures of data utility. Simulation-based approaches have
affect data utility [Wu 2013, Daries 2014, Angiuli 2015, Karr previously been used to measure data utility in the statistical
2006, Drechsler 2011, Gkoulalas-Divanis 2014]. Therefore, disclosure limitation (SDL) literature [Karr 2006, Drechsler
we have dedicated a substantial amount of time to estimate 2011]. Our work is novel in applying a simulation-based
the consequences of enforcing anonymity on data utility. methodology to understanding the impact of anonymization
Our primary uses of anonymized data are calculating on the efficacy of A/B tests. Our framework is designed to
the acceptance rate gap and measuring changes in the be easily adapted to suit many contexts where A/B testing
acceptance rate gap following product launches and other is used, such as other large technology platforms where
interventions. Airbnb, like most other technology companies, experience gaps may exist undetected.
tries to understand the effect of interventions by running
A/B tests (where users are randomly assigned to either the
A or B group), which are designed to measure changes in
outcomes between control and treatment groups [Moss 2014,
Overgoor 2014, Parks 2017]. This leads us to study the effect of
anonymizing data on task-dependent data utility, where the
task we consider is measuring the impact of A/B tests on the
acceptance rate gap.
16Simulation construction
We begin by providing an overview of the simulation we • Accepted: indicates whether a contact was accepted
run to measure data utility. Several steps in this process or not. We use a pseudo-random number generator
should appear familiar to the reader, as they correspond to to determine this. This is necessary for computing an
steps described earlier in our System Design. To make this experiment's impact on the acceptance rate gap. There
connection clear, we add the name of the relevant System are two factors that affect one's acceptance probability:
Design section in parentheses next to each step of the
simulation. Nevertheless, there are important distinctions – The guest's group: we model guests in group A to have
between the overall system and the simulation. Firstly, we run the highest probability of acceptance, followed by
the entire data flow many times, varying parameters such guests in group B and C.
as k, in order to study their impact on data utility. Secondly, – The host's treatment: if a host is in treatment, their
the simulation has no step to perceive race (Perceive Race). acceptance rate of guests in group A does not change.
Instead, we randomly assign users into groups; the group one However, their acceptance rates of guests in groups
is in then affects their probability of acceptance. Finally, we B and C increase by an effect size that we control as
randomly perturb some acceptances and rejections during an input to the simulation. Guests in group B see their
our analysis in order to mimic the impact of a feature launch acceptance probabilities increase by the effect size we
that impacted the acceptance rate gap. A more detailed see in the following analyses, while guests in group C
walkthrough of the simulation is below. see an increase that’s half the magnitude of effect size.
Step 1 (Guest Booking): Step 2 (Select Guest Data):
We start by simulating data to mimic an experiment on our Once we have generated the contact-level (one row per
platform that has had an impact on the acceptance rate contact) dataframe, we collapse it into a guest-level (one
gap. We focus on a host-side experiment, which means that row per guest) dataframe that’s ready for our anonymization
each host will be assigned to either the treatment or control processes (Step 3 and Step 4 below). This dataframe has
group.9 The data consist of one row per contact sent from the schema:
guest to host. The dataset will have N (to be determined later)
rows and has the following schema: • Guest identifier
• Guest identifier: a guest can send multiple contacts, so • Guest group
this allows us to discern who sent which contact. This • n_accepted_contacts_treatment: the number of contacts
corresponds to user_id in the prior section System sent to hosts in the treatment arm of the experiment that
design. As the following process flow shows, it is not were accepted
necessary for computing an experiment's impact on the
acceptance rate gap. • n_rejected_contacts_treatment: the total number
of contacts sent to hosts in the treatment arm of the
• Guest group: we use a pseudo-random number generator experiment that were rejected
to assign guests to group A, B, or C. This corresponds to
perceived race in the rest of the paper. This is necessary • n_accepted_contacts_control: the number of contacts
for computing an experiment's impact on the acceptance sent to hosts in the control arm of the experiment that
rate gap. The following analysis focuses specifically on were accepted
the acceptance rate gap between guests in group A and • n_rejected_contacts_control: the total number of contacts
guests in group B. sent to hosts in the control arm of the experiment that
• Host experiment group: whether the host was in the were rejected
control or treatment group of the experiment. We use
a pseudo-random number generator to determine
this, with half of hosts being in control and the other
half in treatment. This is necessary for computing an
experiment's impact on the acceptance rate gap.
9 This is distinct from a guest-side experiment, where randomization occurs at the guest level and each guest is assigned to either the treatment or
control group. 17Step 3 (K-Anonymize): We record c, the coefficient on guest_group *
experiment_group, and whether it’s statistically significant
We then use ARX API, an open source tool for anonymizing
or not. In the remainder of this paper, we refer to c as the
datasets [Prasser 2014], to k-anonymize the dataframe.
experiment impact on the acceptance rate gap.
Optimal (achieving the best data utility) k-anonymity is NP-
hard [Meyerson 2004]; ARX utilizes a heuristic algorithm to In this step we also measure privacy metrics used in
achieve k-anonymity through a combination of generalization sections below.
and suppression.
Run Simulation:
Step 4 (P-Sensitize):
We repeat Steps 1-6 1,000 times for each combination of the
We then p-sensitize the dataframe: for each equivalence class following experiment setups:
that violates p-sensitivity with p = 2, we randomly select a row
and perturb the guest group. Prior to perturbing the data to • k = 1, 5, 10, 50, 100
achieve p-sensitivity, we record the percentage of rows that
• Number of contacts in analysis, N = 150,000, 200,000,
are part of a homogeneous equivalence class. This is used to
250,000, 300,000, 350,000, 400,000, 450,000, 500,000,
assess the potential impact of homogeneity attacks in the
550,000, 600,000
Disclosure risk analysis section below.
• The expected experiment impact on the acceptance rate
gap, effect size = 1.00, 1.25 1.50, 1.75, 2.00, 2.25 percentage
Step 5 (Measure acceptance rate gap— points
generate contact data):
For each experiment setup, we can then compute the fraction
We then expand the p-sensitive k-anonymous dataset to
of the 1,000 simulation results where the null hypothesis
be a contact-level dataset. We do this by adding a row for
of no experiment impact on the acceptance rate gap was
each contact in the p-sensitive k-anonymous dataset, which
rejected.10 The fraction of the tests that reject the null
contains the host's experiment group, the guest's group,
hypothesis is the power of the test. We also compute the
and whether the contact was accepted or rejected. For
smallest effect size for which we have a power of 80 percent
contact counts that are non-integral we use the non-integral
as the minimum detectable effect of the test.
component as a pseudo-random weighted coin toss for
whether to include an additional contact accept or reject.
This framework also allows us to study the impact of k and
N on statistical power and the distribution of effects we
observe. The results of this analysis are in the next section.
Step 6 (Measure acceptance rate gap—
compute experiment result):
We estimate the impact of the experiment by running a
regression of the form:
accepted ~ a * experiment_group + b * guest_
group + c * guest_group * experiment_group
Here is a detailed breakdown of the variables shown above:
• accepted is 1 if a contact is accepted and 0 otherwise
• experiment_group is either control or treatment,
depending on which arm of the experiment a host was in
• guest_group refers to the demographic group a guest
was in. We limit our analyses to guests in groups A and B.
10 This occurs when the c, coefficient on experiment_group * guest_color, is different from zero in a statistically significant way. 18Overall simulation results
Once we have the results from the simulation, the first thing
we want to do is analyze the impact of changing k and N on
statistical power. Statistical power is our primary measure
of data utility, as it measures how effective we can be at
detecting the impact of feature launches on the acceptance
rate gap. We plot the relationship between effect size and
statistical power for various values of N in Figure 6 below.
As expected, statistical power increases with sample size. We
also see that power decreases as k increases. This decrease
is on the order of magnitude of 1-2 percent when k = 5, but
increases to 5-10 percent when k = 100.
19Figure 7 below gives an aggregate view of the above analysis is clearly some degree of reduced data utility, or information
by plotting the minimum detectable effect (smallest effect loss, that occurs in the process of enforcing anonymity. Our
size with at least 80% power) by N and k. For example, setting simulations demonstrate that we can mitigate this loss' effect
k to be 5 or 10 leads to a 0.00 to 0.25 percentage point on statistical power by obtaining a larger sample size (number
increase (0-20% relative increase) in minimum detectable of contacts). Practically, this means that we can mitigate the
effect. Setting k to 100 leads to a 0.25 to 0.50 percentage effects of data anonymization by running experiments
point increase in minimum detectable effect. for longer.
The main takeaway is that anonymizing data increases There could be other consequences of this information loss
an experiment's minimum detectable effect by 0-20% on measurement. To dig further into this subject, we analyze
(depending on the value of k) in our context. This implies that the impact of our simulation parameters on the distribution of
we can detect the impact of experiments on the acceptance observed effect sizes.
rate gap with anonymized demographic data. However, there
20Initial analysis of the distribution
of observed effect sizes
In this section, we study the relationship between k and the If we did not enforce anonymity, we would expect the
distribution of observed effect sizes, or the magnitude of the distribution of observed effect sizes (c) to be normally
change in the acceptance rate gap we observe in a simulation distributed with a mean of the expected effect size. This is
run. This is equal to the coefficient c, on guest_group * what we see when k = 1 in Figure 8. When we increase k, the
experiment_group in the regression we run in step 6 of the data still appear to be normally distributed. A QQ plot of
simulation construction, described above. This is distinct from these distributions (Figure 9 on next page) does not show
the expected impact on the acceptance rate gap, which we much evidence for non-normality. However, the distributions
control as an input to the simulation. appear to be shifted rightwards (i.e. have downward bias) and
have higher variance for larger values of k. This implies that
We can gain a more detailed view of how k affects our estimates of experiment impact on the acceptance rate
measurement by fixing an experiment size (N) and expected gap become less precise as we increase k. The combination
effect size, while also looking at the distribution of observed of downward bias and higher variance appear to be the
effect sizes for various values of k. Figure 8 below shows such principal drivers of reduced statistical power when k is large.
a distribution for our simulation runs with 400,000 contacts We explore this further in the next subsection. Table 12
and an expected reduction in the acceptance rate gap of 1 below provides summary statistics of the simulation runs we
percentage point. conducted that provide more concrete evidence supporting
these observations.
21The columns mean_b, sd_b, and skew_b in Table 12 record Table 13 below shows the same summary statistics as Table 12,
the mean, standard deviation, and skewness of the observed for N = 400,000 and an expected effect size of 2 percentage
effect sizes. As suggested by the plots in Figure 8, the mean of points. The trends we see are similar, with the difference that
the observed effect sizes is smaller than the actual effect size the magnitude of downward bias is slightly smaller.
we simulated. This leads to an attenuation bias that ranges
from 3.4 percent (k = 5) to 11.3 percent (k = 100). The standard
deviation of observed effect sizes also increases from 0.49 (k
= 1) to 0.64 (k = 100). The distribution of observed estimates is
relatively symmetric and does not show much skew.
We also run a Kolmogorov-Smirnov test of the observed
distribution versus a normal distribution with mean and
standard deviation equal to those seen in the simulation runs.
The columns ks_stat and ks_pvalue in Table 12 record the
test statistic and p-value respectively. We do not see much
evidence that would lead us to reject the null hypothesis
of normality.
22Further analysis of the bias and
variance of our simulation results
We can use the breadth of the simulations we ran in order but we do see that bias seems to decrease slightly for larger
to improve our understanding of the drivers of statistical effect sizes (third panel of Figure 10).
bias and variance of our simulation results. We ran over
1,000 simulations for each possible combination of k, N, and Figure 11 below replicates this analysis for the empirical
expected effect size. This allows us to take a given k and use variance of estimated effect sizes. We see that dispersion
the results for various N's and expected effect sizes in order increases as k increases and decreases as N increases.
to obtain a distribution for statistical bias for that k. Repeating Neither of these observations should be particularly
this exercise for various k's allows us to gain a heuristic for the surprising. We do not see a major correlation between
relationship between k and bias. dispersion and effect size.
The first panel of Figure 10 below shows how bias clearly Based on this analysis, we believe we can use p-sensitive
increases as k increases. We can repeat the same exercise for k-anonymous perceived race data, for p = 2 and k = 5, to
the number of contacts in an experiment and the expected measure the impact of different Airbnb features on the
reduction in the acceptance rate gap (second panel of Figure acceptance rate gap. We provide additional context and
10). We do not see a large correlation between N and bias, guidelines for selecting k in Appendix 1: survey of values of k.
23Summary of findings
from simulations
The major findings from our simulations are summarized
below. Firstly, when we enforce k-anonymity with k = 5, we
see a 0-20 percent increase in the minimum detectable
effect of an A/B test's impact on the acceptance rate gap.
We can mitigate this reduction in statistical power by running
A/B tests for longer in order to obtain larger sample sizes.
After analyzing the distribution of observed effect sizes, we
see that this increase in minimum detectable effects is driven
by a downward bias and increased variance in our estimates
of A/B test impact for higher values of k. We expect that
further enhancements to the parameters and algorithms
used in the anonymization processes (K-Anonymize in
particular) will reduce the impact of anonymization on our
ability to measure the acceptance rate gap. This may allow
us to use higher values of k as well as potentially use this
system to measure other potential experience gaps where
anonymization may have a larger impact on data utility. We
discuss some of these potential enhancements later in the
Future work section below.
24Disclosure risk analysis
In this section, we enumerate the certain attribute
disclosure threats in the system by examining data linkages.
We then, for each threat, provide a risk assessment to
establish that we believe we have sufficiently mitigated the
risk of certain attribute disclosure so that we may consider
the perceived race data as anonymized.
25Appendix 2 provides a formal privacy analysis using the labeled Public Data, which represents potentially extant data
LINDDUN privacy threat modeling methodology [Deng 2011]. about users outside the system. Datastores that contain
Though the LINDDUN methodology is helpful in providing a externally identifiable user data are colored yellow12 (e.g.,
high-level framework for threat modelling, it does not provide User Data on its own contains sufficient data about most
tools to help ensure all concrete threats to linkability of data users to uniquely identify them); those that contain perceived
(one of the many categories of threats the methodology race, the relevant sensitive attribute for disclosure analysis,
attempts to capture) have been explicitly reviewed. In this are colored red13 (e.g., File 2 contains perceived race). The
section, we create and analyze a data-linkage diagram, a diamonds describe data linkages (e.g., Data Store 1 may be
variation on an entity-relationship diagram, to enumerate all related, or linked to, File 2 via the NID). Solid lines represent
such threats. data or data linkages that are certain to exist. Dashed lines
represent linkages where data may exist (e.g., not all users
In the data-linkage diagram in Figure 12 below, a block may have photos available in Public Data) or linkages that
represents a datastore11 from the system design: the title are probabilistic (e.g., k-anonymous so that the probability of
of the datastore is in bold, followed by the relevant data linkage is at-most 1/k, rather than 1.0).
attributes in the datastore. There is an additional block
11 In this section vs. Appendix 2, we do not distinguish between a datastore and its input/output dataflow—for simplicity all are represented datastores.
12 The following blocks are colored yellow: User Data, Public Data.
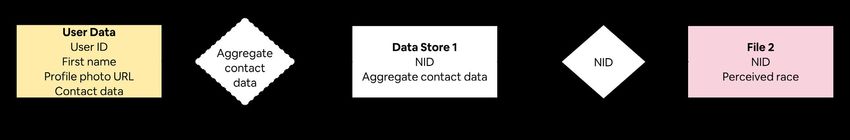
13 The following blocks are colored red: Data Store 2, File 2. 26Each data linkage is described below: Equipped with this data-linkage diagram and an
understanding of each linkage, we then enumerate all paths
• User Data ~ Data Store 1, Data Store 2: given knowledge from externally identifiable user data (yellow blocks) to
of the Select Guest Data process, aggregate contact data perceived race data (red blocks). Each such path represents
in User Data may be matched to that in either Data Store a linkability threat in our privacy analysis in Appendix 2. In
1 or Data Store 2. However, because aggregate contact this section, we review each threat that may lead to certain
data attributes are quasi-identifiers and both data stores attribute disclosure14. The scenarios are ordered by our
are k-anonymous, a user’s aggregate contact data in User subjective prioritization of their risks—the likelihood of the
Data may be mapped to no less than k rows in either Data attack scenario and its impact [Deng 2011]. This prioritization
Store 1 or Data Store 2; the probability of each row being will help guide future improvements to system design such as
matched correctly (certain attribute disclosure) is 1/k. those discussed in the later section, Future work.
• User Data ~ File 1: a user’s profile photo URL in User Data
is unique, so that data in File 1 may be linked to User Data
using that URL.
• Data Store 1, File 1 ~ File 2: the unique row identifier NID
(generated by K-Anonymize) may be used to link rows
between Data Store 1, File 1, and File 2.
• Public Data ~ File 1: facial recognition/photo matching may
be used to link the user’s publicly available photos and the
user’s profile photo. Unless the exact same photo exists in
both Public Data and File 1, the matching will be uncertain,
i.e. probabilistic. First Name from File 1 may be used to
increase certainty through either (1) its direct existence
in Public Data, or (2) linkage between other quasi-
identifiers in Public Data, e.g., location data, with publicly
available name distributions such as those in public
voter registrations.
Linkages from Public Data to User Data aren’t considered
because, were an attacker to achieve linkage between
User Data and a datastore containing perceived race data,
linkage to Public Data would be unnecessary to achieve the
objective of attribute disclosure. It may, however, improve
posterior beliefs, i.e. increase the risk of probabilistic
attribute disclosure.
14 Appendix 2 reviews both probabilistic and certain attribute disclosure threats, though doesn’t exhaustively examine malicious modification of
processes (which this section does examine in some detail). This section only covers certain attribute disclosure. As before, we do not distinguish
between a datastore and its input/output dataflow—for simplicity all are represented as a datastore. 27Homogeneity attack
In this scenario, represented in Figure 13 below, an attacker anti-discrimination Team or to circumvent access controls to
effectively circumvents P-Sensitize to engage in a gain access to the datastores. Future work: Modifying trust
homogeneity attack [Basu 2015, Machanavajjhala 2006]; the boundaries to further protect anonymity describes potential
attacker achieves certain attribute disclosure for those users improvements to further reduce the likelihood of this threat.
who are members of homogenous equivalence classes. Once We believe the impact of this threat is medium—reflecting
the attacker joins File 2 and Data Store 1 (using NID as a key), the small percentage of users we expect, based on our
they examine all equivalence classes and, for those that have simulations, to be in homogenous equivalence classes
only a single distinct perceived race value, have achieved (less than 1% for k >= 5 across most simulations)—see
certain attribute disclosure. Figure 14 below.
We believe the likelihood of this threat is low as it requires the
misactor be a malicious authorized member of the Airbnb
28You can also read