Measuring Online News Consumption and Supply - A report for Ofcom prepared by Oliver & Ohlbaum Associates Ltd the Reuters Institute for the Study ...
←
→
Page content transcription
If your browser does not render page correctly, please read the page content below

Measuring Online News
Consumption and Supply

A report for Ofcom

prepared by
Oliver & Ohlbaum Associates Ltd
the Reuters Institute for the Study of Journalism
the Oxford Internet Institute

July 2014
Measuring Online News Consumption and Supply

Contents
1.   Summary .............................................................................................................................................. 4
2.   Introduction ........................................................................................................................................ 10
3.   Context: the evolving news market ................................................................................................ 13
     3.1      While sectors are converging… ................................................................................................ 13
     3.2      …diverse approaches are a more dominant trend .................................................................... 14
     3.2.1 Fragmentation of consumption .................................................................................................. 14
     3.2.2 A variety of established, new and emerging business models ................................................. 15
     3.2.3 Proliferation of devices .............................................................................................................. 17
     3.2.4 Divergent formats ...................................................................................................................... 17
     3.2.5 Differing geographic foci ............................................................................................................ 18
     3.2.6 Diversifying suppliers of news ................................................................................................... 19
     3.3      The data available from online consumption provides an opportunity to observe and analyse
              actual customer behaviour ........................................................................................................ 19
4.   Measurement: who, what and why? ................................................................................................ 22
     4.1      Introduction ................................................................................................................................ 22
     4.1.1 Commercial ............................................................................................................................... 22
     4.1.2 Managerial ................................................................................................................................. 23
     4.1.3 Editorial ...................................................................................................................................... 23
     4.1.4 Academic/Social ........................................................................................................................ 23
     4.2      What do they measure? ............................................................................................................ 23
     4.2.1 Usage ........................................................................................................................................ 23
     4.2.2 Engagement .............................................................................................................................. 25
     4.2.3 Editorial Performance ................................................................................................................ 30
     4.2.4 The competition ......................................................................................................................... 30
     4.2.5 Navigation .................................................................................................................................. 30
     4.2.6 Behavioural ................................................................................................................................ 31
     4.2.7 Key Performance Indicators (KPIs), performance indicators and combined metrics ................ 31
     4.2.8 Social Network Analysis ............................................................................................................ 31
     4.3      Key issues ................................................................................................................................. 31
     4.3.1 Increasing acceptance of online metrics ................................................................................... 31
     4.3.2 Diverging business models mean divergent metrics ................................................................. 32
     4.3.3 Social analysis requires different metrics .................................................................................. 32
     4.3.4 Despite this, there is a need for a common core....................................................................... 32
     4.3.5 Current numbers have their flaws ............................................................................................. 33
     4.3.6 A flood of information – or a big data opportunity? ................................................................... 33
     4.3.7 Engagement remains elusive .................................................................................................... 33

Oliver & Ohlbaum Ltd                                                                                                                                        2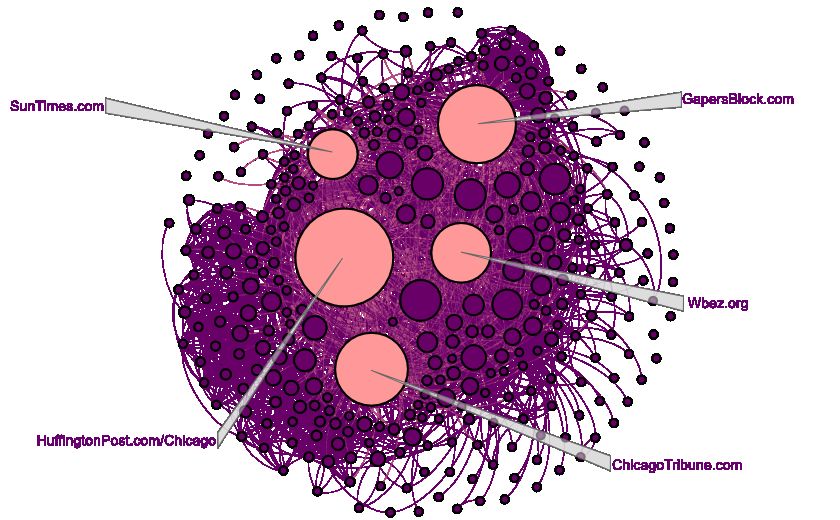
Measuring Online News Consumption and Supply

     4.3.8 The information collected is not integral to advertising sales .................................................... 34
     4.3.9 … and thus funding will remain scarce...................................................................................... 35
     4.3.10 Cross-platform research remains an issue ............................................................................... 35
5.   The impact of news supply and consumption ............................................................................... 38
     5.1      What are academics researching? ............................................................................................ 39
     5.2      Three main analytical techniques are being used ..................................................................... 41
     5.2.1 Social network analysis and network mapping ......................................................................... 41
     5.2.2 Sentiment analysis .................................................................................................................... 44
     5.2.3 Sharing analysis ........................................................................................................................ 46
     5.3      Limitations on progress ............................................................................................................. 46
     5.3.1 Challenges of analytical tools .................................................................................................... 48
6.   Future development of news online metrics .................................................................................. 51
     6.1      Tracking use by everyone, everywhere .................................................................................... 51
     6.2      From quantity to quality ............................................................................................................. 51
     6.3      Real Time .................................................................................................................................. 52
     6.4      Data privacy............................................................................................................................... 52
     6.5      Continuing need for more qualitative data to better understand consumption patterns
              prompted by societal/citizen-related questions ......................................................................... 52
7.   Implications for measurement and digital research ...................................................................... 54
     7.1      Increasing bifurcation appears inevitable .................................................................................. 54
     7.2      More clarity on what tools actually measure and how they can be used is needed ................. 54
     7.3      There is a need for wider participation in development of techniques and tools ...................... 54
     7.4      Data that reflects social priorities is less readily available ........................................................ 54
     7.5      The big questions don’t get answered ...................................................................................... 54
     7.6      Sharing news and information remains a weakness ................................................................. 56
     7.7      Organisations with an interest in this area should consider creating their own dashboard to suit
              their specific needs .................................................................................................................... 56
8.   Appendices ........................................................................................................................................ 57
     8.1      Appendix A: External providers ................................................................................................. 57
     8.2      Appendix B: Metrics................................................................................................................... 60
     8.2.1 Usage ........................................................................................................................................ 60
     8.2.2 Engagement .............................................................................................................................. 62
     8.3      Appendix C: Suggested readings .............................................................................................. 64
     8.4      Appendix D: Contributors .......................................................................................................... 68

Oliver & Ohlbaum Ltd                                                                                                                                       3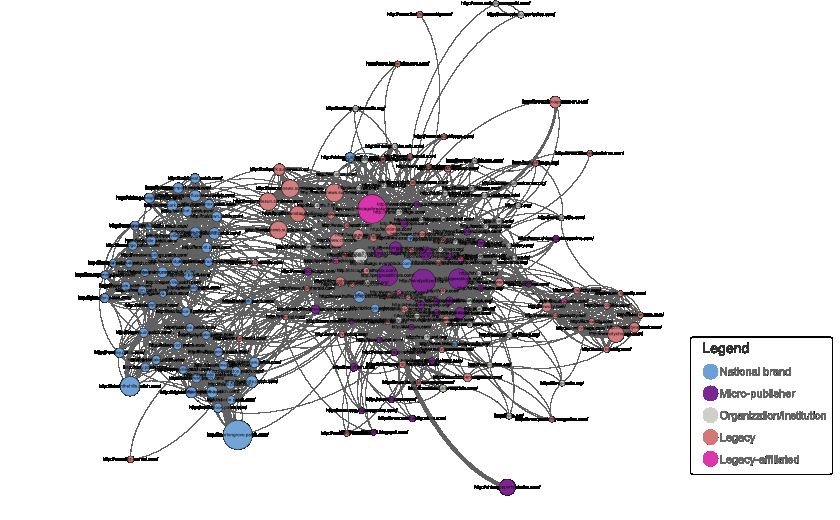
Measuring Online News Consumption and Supply

1. Summary

  This report has been prepared for Ofcom to give a view on the current state of play in online audience
  and content measurement.

  This report examines the ways in which both industry practitioners and the academic community
  measures online news consumption and supply. Given changes in the way that news is being consumed
  and supplied, the report looks at new and innovative measurement methods which have been enabled by
  new technologies and analytical techniques, alongside more established measurement approaches to
  online measurement.

  Media consumption patterns and habits are becoming ever more complex. Content in many forms, from
  many locations, to a variety of devices is now part of most consumers’ everyday lives. Online media
  offers a direct connection between consumer and providers (with a return path for data) and presents the
  opportunity to collect and aggregate far more information on the consumer than ever before. As
  consumption moves towards connected devices – the PC, TV, mobile or tablet – the amount of data
  describing that consumption is increasing exponentially. Equally, as consumption patterns become more
  complex, our ability to make sense of them is challenged.

  The complexity of news consumption means that the challenges of accurately measuring the audience
  are greater than in other, more straightforward areas of digital content. The systems that have been
  developed for these more straightforward content types are leading the way in online audience metrics –
  but the complexity of news consumption means that these metrics do not yet meet the needs of scholars
  interested in better understanding how news consumption takes place, how it flows in society, and the
  influences of news on opinion.

  Although the news industry has converged around multimedia output – with most players offering content
  as text, pictures, video and audio, in very similar formats – underlying this is a complex ecosystem with
  growing diversity on several dimensions. These include:

      •   A fragmentation of consumption (consumers have a very wide choice – and are exercising it)
      •   A growing variety of business models (free, ad supported, paywall, and app based)
      •   A proliferation of devices (such as desktop, tablet, e-reader, mobile, connected TVs)
      •   Divergent formats (including web pages, blogs, mobile, streams, slideshows)
      •   Differing geographic emphases (content can be accessed from anywhere – and content from
          anywhere can be accessed)
      •   Many more suppliers of news (news is no longer just available from traditional news providers,
          and in the social media world individuals can be as influential as organisations)

  Our research suggests that measurement systems are attempting to provide information relating to six
  broad themes:

      •   Usage – the numbers of people are using the service, and the volume of their use
      •   Engagement – for example, the length of a user’s stay per visit to the service, and the extent to
          which they are engaging with and using the content
      •   Editorial performance – allowing the performance of individual stories or treatments of a story
          compared and assessed
      •   Competition – to understand what a service’s peers and competitors are doing

  Oliver & Ohlbaum Ltd                                                                                   4
Measuring Online News Consumption and Supply

    •   Navigation – understanding how do users get access to, and how they navigate around the
        service
    •   Behaviour – how people are using, interacting and sharing the information they glean

These systems also have to supply a number of different types of users each with their own needs:

    •   Commercial – as a means to sell advertising or subscription
    •   Managerial – as a way of monitoring the performance of the organisation
    •   Editorial – as a tool to monitor audience reaction to content and the relative performance of
        stories and treatments
    •   Academic/Social – as a means to gage the behaviour of consumers, their relation to news, and
        its social impact

All these factors are driving complexity in measurement systems and metrics. On the one hand, there are
basic, common measures that are broadly comparable (though providing limited insight). On the other
hand, a variety of increasingly sophisticated, bespoke measures are developed for the specific
requirements of individual providers (for example, business model, audience segment, editorial focus,
and the geographic scope). As a result, not all the measures in use are universal or comparable. And
while these commercial metrics have problems and shortcomings, they remain far more advanced than
metrics suitable for assessing social and political dimensions of media use.

A basic set of metrics is widely used and accepted by industry, but these could benefit from
further refinement

The simpler metrics such as basic consumption metrics of reach and volume are widely used and
generally accepted. However even these measures can be prone to inaccuracy due to the difficulty of
tracking an individual across multiple devices – including the work computer and mobile – and the need to
fuse panel, sample, cookie and tagging data. These are promising metrics but effort to develop their
accuracy is ongoing. The issue of individuals using multiple devices has been solved – for now – by the
adoption of the concept of “unique browsers”, but this is generally accepted to overstate individuals by
50% or more - and can be confusing to those not privy to the distinction between browsers and users.

Measuring engagement is a key interest for industry and academia – but even defining it in a
consistent way remains elusive

Across the sector, participants believe that audience measurement should not just be about volume but
also – crucially – about engagement. However, definitions of what engagement actually is vary, and the
ability to accurately measure it remains elusive. There has been a suggestion that “attention minutes” is
the best widely available measure, but not everyone agrees. Some form of composite metric including
volume of consumption and quality of that consumption – appreciation, sharing, time spent – is seen as
the way forward, but agreeing this (and then measuring it) will take time.

The rise of social media – not just as a news source, but more importantly as a referral or dissemination
tool – means that operators are increasingly required to include measures of social media usage in their
reports. Here analytics developed for social media are being incorporated into the bespoke systems used
by news providers.

Oliver & Ohlbaum Ltd                                                                                   5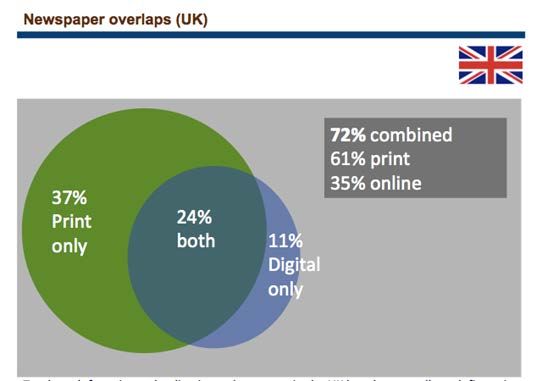
Measuring Online News Consumption and Supply

Levels of industry investment in audience measurement systems are related to the role they play
in revenue models

It is important to understand that these systems are not core to the mechanisms of online advertising
trading, pricing or targeting – and so there is no imperative (or at least substantial funding) to perfect
them. The usage, reach and engagement metrics are used to market providers to advertising buyers, but
unlike BARB these measurements do not play a central role in the industry.

Current investment is focused on the analytic tools used to provide editorial feedback (often in real-time).
This optimises content for the consumer, benefitting the provider in three ways: attracting more users,
retaining them and increasing their engagement. This increases advertising yield and subscriber
retention. (News providers that are behind a paywall have information needs similar to other subscription
businesses such as pay TV and mobile telephony – managing subscribers and predicting potential churn
are key, and represent a move away from traditional media measures).

Cross-platform measurement remains challenging, though progress is being made

As content is increasingly consumed across multiple devices, there has been increased interest in cross-
platform measurement, which can mean one of two things:

    •   Measurement of de-duplicated audiences across multiple digital devices and services – tracking
        usage across a news provider’s website, app and viewing of online videos
    •   Measurement of an individual’s consumption of news across online, broadcast and printed outlets

Measuring both of these – in particular the latter - remains challenging, and each lacks a metric or set of
metrics which are agreed on by all. Despite this some progress is being made and certain commercial
measurement systems (such as comScore) offer measurement of de-duplicated online audiences.

The newspaper industry is developing tools to better measure overall readership (of both print and digital
services) and the BBC has also adopted metrics to provide greater comparability between online and
broadcast audience measurements (such as weekly reach).

Industry collects and analyses data – but this does not necessarily mean a “Big Data” approach

Much has been written about the opportunities for organisations and researchers in many sectors created
by the use of “big data” techniques to improve business performance and offer new insight for
researchers. While there is no single definition of what constitutes “big data”, definitions normally relate to
unstructured, often abstract data sets combed to look for patterns.

Although the ability to track every action of every consumer offers a vast data set, news providers do not
necessarily look these on new approaches and metrics as a “big data” issue. Firstly, and in many cases,
the analytics data being collected by news providers is relatively structured, albeit large in quantity.
Secondly news providers are focused on the immediate commercial benefits and business improvements.
In this regard, the analysis of online consumption data is seen as an extension of existing business
intelligence activities. They are also attempting to focus on a small number of key measures (and the
data required for them), rather than continuing to capture everything.

Oliver & Ohlbaum Ltd                                                                                         6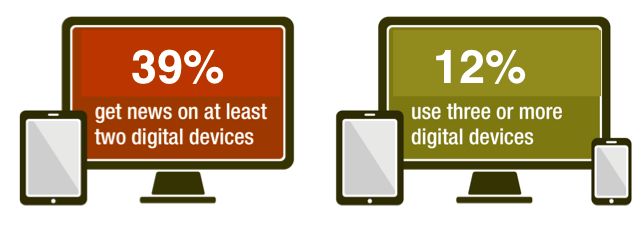
Measuring Online News Consumption and Supply

The academic community has different needs from industry – but has to rely on data from others

Academic researchers are increasingly addressing questions of how supply and use of news in the digital
environment affect society and perceive the need for better data that explains how and why users choose
digitally available information, share it with others, and, crucially, the effect of those choices. New
academic techniques such as social network analysis and mapping, sentiment analysis, and sharing
analysis are providing methods for understanding how information flows, who is influential, what the
public is thinking and what types of content they are sharing. Nevertheless, progress in developing
understanding is slow and more efforts could be made to stimulate progress. The challenge exists
primarily because the existing measurement tools are oriented to the needs of advertisers and content
providers, are often proprietary, and do not focus on the kinds of data needed to answer social questions.

Some academic teams have developed supply-side tools to capture and study (primarily text-based)
news output from a range of online news providers. In the US, where there is a public archive of TV
caption data / subtitles, these approaches have been used to explore how news stories start and spread
between different news providers, and the relationship between TV news and online news sources.

Use of audience metrics and social research methods by policymakers and regulators remains in its
infancy, with little use of data beyond publicly available, aggregate findings on consumption and leading
digital sources.

Current measurement tools are generally more focussed on addressing specific business needs
than addressing broader social and policy questions

The data and metrics considered in this report are (in the main) focused on answering specific questions
(particularly business related issues). However, there are bigger questions across the industry - societal,
policy and regulatory questions among them - that would benefit from data at a much deeper level than
these measures are able to address. They include:

             •   The origins of news and the diversity of those origins
             •   Fairness and balance in news
             •   Access to news
             •   Geographies of consumption
             •   Implications of use on knowledge and public engagement.
             •   Structural implications of market shares across media

Much of the information currently collected may not serve these needs given the differences in the scale
and timescale in the use of data to optimise business performance as opposed to the use of news
consumption and supply data to help understand broader patterns and trends in society.

Genre classification is the biggest data gap

The biggest omission in current data collection is some degree of genre / subject information. BARB has
a genre / subgenre classification system, which may be particularly useful when looking at areas of policy
concern such as news, drama, children or other PSB issues.

However, all news sites are categorised as a single genre. Moreover, some sites that are supplying
categories of news, such as the BBC Sport site – which is indistinguishable in output from the sports
sections of many news sites – is not counted as news. More oddly, when it was introduced the News of

Oliver & Ohlbaum Ltd                                                                                        7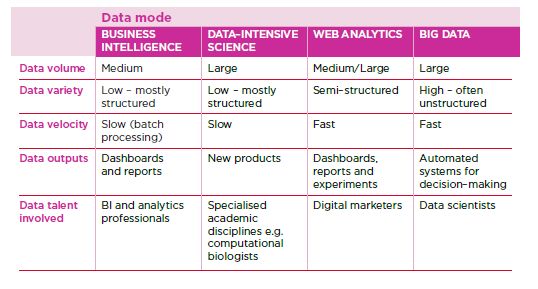
Measuring Online News Consumption and Supply

the World online site was originally categorised as pornography. Ensuring that definitions of news are
consistent and comprehensive is important for making comparisons between different online news
services.

Of even more importance, we believe, is a detailed understanding exactly what content users of news
sites are actually consuming. “News” is not homogenous. While historically we have been able to
assume that a viewer to a main network news bulletin on TV or radio is exposed to national, international,
political, science and social news among others, we cannot make the same assumption for online
consumption. Many pages may not even make a strict definition of news – TV reviews and listings, for
example. Even a broad categorisation of the pages viewed – possible through tagging – into subject
matter such as politics, international, entertainment, for example would give a huge amount more insight
into actual consumption. This has implications for views of the news ecosystem; as user behaviour
becomes more complex, many are using specific providers for certain things such as sports news,
comment and celebrity gossip. This poses a question as to whether people who are seeking specific
providers for specific topics are being exposed to a genuine range of views.

There is the opportunity to create an industry dashboard

In the absence of in-depth information, researchers and others with an interest in this area should
consider creating a bespoke dashboard of information. This can be done with a combination of publicly
available sources (for example comScore and ABCe), access to others’ material (the annual Reuters
Institute survey, among others); existing proprietary public sector data (such as Ofcom’s PSB tracker and
Ofcom’s News Survey) and bespoke data queries or research carried out on a regular basis. A monthly
basis approach would increase usability as commercial services such as Nielsen and comScore produce
monthly rankings and statistics.

At a higher level, this could track (potentially on a quarterly basis) the share of the market taken by
traditional broadcasters, print, new entrants and aggregators. It could look at both reach and volume, and
how platform usage was developing (possibly by brand). Simple analysis of statistics from Twitter and
Facebook could show how influential providers or individuals were, and may demonstrate that some
individual commentators have bigger impact than well-known brands. This may in the future lead to some
interesting questions - what (or who) exactly is a news provider in today’s market? It is a media
organization or can it be a single media personality, citizen journalist or other influencers?

Oliver & Ohlbaum Ltd                                                                                    8
Measuring Online News Consumption and Supply

Oliver & Ohlbaum Ltd                           9
Measuring Online News Consumption and Supply

2. Introduction
   In contrast to traditional print, radio and broadcast TV, online media offers a direct connection between
   consumer and provider (including a return path for data). This provides publishers the opportunity to
   collect and aggregate far more information on that consumer than ever before. As consumption moves
   towards connected devices – the PC, smart TV, mobile or tablet – the amount of data describing that
   consumption is increasing exponentially. Equally, as this consumption becomes more complex, the need
   to understand it becomes imperative.

   Our ability to understand this behaviour – and the implications and challenges it presents - depends on
   being able to measure it. Traditional media measurement systems – and the ecosystems around them –
   have been established for decades and their use (and limitations) are understood by the industry. We
   know that not all TV viewing is captured by BARB (local TV, for example, has to measure engagement in
   different ways); The RAJAR diary has been the subject of considerable debate for many years. By
   contrast, measurement of the digital consumer is developing as quickly as the consumers themselves. A
   variety of systems and measures – many of them unique to individual providers – are available, and this
   variety can seem confusing and opaque especially to non-practitioners. At this stage, metrics are
   primarily being developed to serve commercial ends, measuring exposure and clicks to sell advertising,
   and secondarily measuring user behaviour and engagement to optimise content. The metrics currently
   used to assess social and political implications are largely derived from these commercial metrics.

   In many ways, these developments are at their most stark in the online news sector. The wide array of
   services available for consumers, the different business models in use, and the complex and subtle
   behaviour that consumers have developed mean that the measurement systems required in the news
   sector are arguably more advanced than elsewhere.

   This report explores the current state of play in the UK news sector, possible future developments,
   together with thoughts on the implications for the industry. It is based on a number of in depth, senior-
   level interviews with leading stakeholders in the sector. News providers and commercial organisations
   we have spoken to during this process include:

       •   ABCe
       •   BBC
       •   BuzzFeed
       •   Chartbeat
       •   comScore
       •   Daily Mail
       •   Financial Times
       •   Guardian News & Media
       •   Huffington Post
       •   Johnston Press
       •   News UK

   In addition, we investigated non-commercial uses of audience data, discussing uses of data and needs
   for new data gathering methods with academic research organisations and scholars at:

       •   European Union, COST EP7 Action Research Project “Transforming Audiences, Transforming
           Societies
       •   Berkman Center for Internet and Society, Harvard University, USA
       •   Civic Media Center, Massachusetts Institute of Technology, USA
       •   Media Lab, Science Po, France
       •   Oxford Internet Institute, Oxford University, UK
       •   govcom.org foundation, Amsterdam
       •   Engaging News Project, Annett Strauss Institute for Civic Life, University of Texas-Austin, Austin

   Oliver & Ohlbaum Ltd                                                                                   10
Measuring Online News Consumption and Supply
• Media Impact Project, Norman Lear Center, Annenberg School of Communication, University of
Southern California, USA
• Annenberg School of Communication, University of Pennsylvania, USA
• Reuters Institute for the Study of Journalism, Oxford University, UK
The authors would like to thank these organisations for their co-operation, and hope that this report adds
to the understanding of this important issue.
Oliver & Ohlbaum Ltd 11Measuring Online News Consumption and Supply A converged digital world – but with diverging approaches Oliver & Ohlbaum Ltd 12
Measuring Online News Consumption and Supply

3. Context: the evolving news market

3.1   While sectors are converging…
      Two decades ago, the UK news industry had very clear dividing lines. Print, TV and radio news were
      entirely separate sectors. Publishers were either national or local. TV offered pictures, radio did sound;
      print was based very much on the written word. Similarly, journalists tended to be specialists, working for
      one provider and for one media, with clear distinctions between TV journalists and news rooms and
      newspaper journalists and their newsrooms.

      The shift online of the creation and distribution of news content has led to the blurring and removal of
      many of historic distinctions between different types of news output. Output has converged around
      multimedia services, with almost everybody producing video, still pictures, audio and text. Almost every
      provider has an online site, and the content will look very similar – a web page with a bold headline, some
      images (increasingly embedded video is the norm), and a text story with links to more in-depth, related
      content and other items of interest. Configured for mobile, the content is almost indistinguishable.

      UK newspaper groups now have significant digital operations. This year’s Reuters Institute Digital News
      report confirms that digital audiences now form a substantial part of newspaper consumers – and most of
      them consume both “old” and “new” media (Figure 1).

      Figure 1 Overlap of UK Digital and Print News Consumers

      Source: Reuters Institute Digital News Report 2014. Question: Which, if any, of the following have you
      used to access news in the last week? (UK News Sources tagged and grouped) Base: UK internet news
      users: 2082

      This convergence of output – but from very different backgrounds – leads to challenge of measurement,
      and particularly consistency. Companies are accustomed to different metrics, different degrees of
      accuracy and different degrees of timeliness. And as multi-media operators, most providers want some
      degree of measurement across media, tracking overall consumption and consumer behaviour between
      their traditional operations and their new media output.

      Those researching consumption for other purposes—such as academics and civil society organisations—
      rely heavily on the metrics used by companies and also desire better measurement across media. They
      also seek new methods of using that data to obtain broader perspectives on the use in society.

      Oliver & Ohlbaum Ltd                                                                                    13
Measuring Online News Consumption and Supply
3.2 …diverse approaches are a more dominant trend
Even though the core output may have converged around a multimedia offering, in almost every other
aspect the sector is showing significant diversification – making the measurement task substantially more
complex. These can be summarised as:
• a fragmentation of consumption
• a variety of business models
• a proliferation of devices
• an increasing range of formats
• an erosion of traditional geographies
• an increasing range of suppliers
3.2.1 Fragmentation of consumption
The British news market has a long history of consumer choice. The UK has more national daily
newspapers than any other developed media market; over one thousand local newspapers, and each
PSB has a requirement to provide a high-quality news service. But this historic choice is overwhelmed by
the choice made available online.
Consumers can access news from almost any provider in the world – be it a local newspaper, home and
abroad; any daily or weekly newspaper; TV news – network and news channel; radio services; specialist
information providers of all hues, and a host of new online services, both those producing their own
content and those aggregating the output of others.
While there is a substantial segment who only access news from a single source (typically television),
many consumers use multiple sources across multiple media. Across all platforms, Ofcom’s 2014 News
research shows that 75% of news users consume news from two providers or more (Figure 2).
Figure 2 Still one in four news users uses only one source of news
2% 1% 1%
4%
8%
11%
19%
27%
26%
1 provider 2 providers 3 providers 4 providers 5 providers 6 providers 7 providers 8 providers 9+ providers
Source: Ofcom, News consumption in the UK, research report, June 2014
Oliver & Ohlbaum Ltd 14Measuring Online News Consumption and Supply
However, many consumers have embraced this choice and are actively pursuing information from a
variety of sources – for a different viewpoint, confirmation, specialism or many other reasons. Even
consumers who identify themselves as regular readers of a specific newspaper (and in a pre-digital world
may well have read only that one source) use a host of other providers on a regular basis (see Figure 3).
Figure 3 Distribution of online consumption among regular newspaper readers, 2011
Online newspaper habits by newspaper readership loyalty (i.e. named favourite newspaper)
% of total online news site
claimed use
100
10 10 8 9 8 9 8 9 11 Other
11
90
10 10 10 11
11 11 11 11
12 13 News aggregators
80
13 14 17
15 12 15 17 18
70 13 14 Other TV news
60 16 18 16
14 13 18 14 10 BBC
14 12
50 4 4 Local paper
5 5 4 6 6
7 5
7
40
23 24 Quality press
22 21 24 21
24 18 22
30 20
5 6 7 6 6 Mid-market press
20 6 5 2 5 7
10 10 11 9
11 10 13 Popular press
10 10 12 11
10 9 8 8 10
6 6 5 5 5 Own site
-
Average Guardian Times Independent Daily Daily Mail Daily Express Sun Daily Mirror Financial
newspaper Telegraph Times
Source: Oliver & Ohlbaum Consumer Survey 2011 (n=1707)
Individual consumers are thus creating highly personalised use patterns that are increasingly requiring
news providers to address them separately rather than as members of audience groups. This also
creates difficulties in considering the overall impact of media consumption on society.
Understanding this behaviour – and the forces that shape it – is important to providers and regulators
alike. Are consumers producing their own plurality? Or are they using sources for specific needs – one
for sport, one for international news, one for gossip etc. From the provider’s standpoint, what is causing
them to use multiple sources? Is this a problem, and how could they be persuaded to stay longer?
3.2.2 A variety of established, new and emerging business models
The variety of providers, from a variety of backgrounds (both traditional and new) has spawned a
corresponding variety of business models. Among the main ones in the UK market are
• Licence fee funded (e.g. BBC News)
• Ad-funded (with a focus on selling a specific type of audience to advertisers – e.g. The Guardian)
• Ad-funded (with a focus on selling a large volume of users to advertisers– e.g. MailOnline)
• Ad-funded (with a focus on native advertising / sponsored content that reads like normal editorial
content – e.g. BuzzFeed)
Oliver & Ohlbaum Ltd 15Measuring Online News Consumption and Supply
• Soft paywall (some content available for free; some requires payment- e.g. Financial Times)
• Hard paywall (no content available for free - e.g. The Times, Sun)
• App for tablets and smartphones (normally an addition to paywall sites)
• Membership funded (free content but with memberships supporting its development)
• Foundation funded (free content supported by grants)
• E-commerce funding (sales of wines, dating services, financial services) to support content – e.g.
The Times
Companies are increasingly relying on multiple business models to obtain the financial resources they
require and each involves structures and activities to support them. Some are based in non-market
activities, whereas others rely on market functions. Some require payments from some parties, others
rely on consumer choice (see Figure 4). Each of these business models requires and draws on different
information – to track audiences, to inform advertisers, or monitor paying customers. No single, widely
available system is able to give this range – and to produce this information for every provider would be
hugely expensive and of limited use. To provide this information, many providers have developed their
own in-house metrics and systems. The speed of adoption of new financing models is high and the
demand for information to understand them is growing rapidly, often running ahead of available metrics.
Figure 4: Diversity in funding and payment types for online news services
compulsory
payments
licence fee ad funded
paywalls
non- market
market funding
funding
memberships e-commerce
foundation grants
voluntary
payments
Source: Robert G. Picard. Used with permission.
Oliver & Ohlbaum Ltd 16Measuring Online News Consumption and Supply
The need for different types of information has become more complex because news enterprises are
increasingly relying on hybrid business models mixing elements of the independent business models, for
example a soft-pay wall and e-commerce.
Many of the new business models being introduced – with their attendant information requirements – are
coming from new entrants offering “pure” digital-only services. (This could be news providers with
significant editorial staff such as the Huffington Post or BuzzFeed, aggregator services like Flipboard, or
search provider linked services such as Google News). We refer to these new entrants as “pure players”
as they initiated their activity with the Internet, contrary to the traditional news providers.
3.2.3 Proliferation of devices
Although the first digital news services were PC based, today’s ecosystem covers a range of devices.
News organisations, advertisers and others are using measurement to try understand patterns of use
across devices and to improve news and advertising provision and consumption. Academic and social
researchers are using measurement to determine why people use particular forms of media, what they
use them for, what these forms of media mean for them, and what the effects or implications of their
media use are in terms of political knowledge, civic engagement, etc.
Even for a single provider, consumers can access content in a variety of ways. Before we consider
specifically configured formats, a growing number of consumers have access to more than one computer
(at home and work); a tablet with an internet browser, and a mobile phone which is increasingly “smart.”
Thus one consumer may be accessing the same content – a web site – from four or more devices.
Reuters Institute 2014 survey suggested that across the markets it surveys, four in ten (39%) used
multiple digital devices to access news services (Figure 5).
Figure 5: Impact of multiple device users
Source: Reuters Institute Digital News Report 2014. Base: Sample across countries covered in survey.
Consumption of news needs to be understood in terms of how the public uses multiple devices
individually and collectively and in different social settings. This is important because measurement of
news consumption previously relied upon platform-specific measurements that never accurately reflected
how individuals mixed and match media in practice. A multiple platform analysis will permit a more
nuanced analysis of how different types of media supplement but only sometimes supplant each other in
place of more simplistic assumptions about “new” media replacing “old” media.
3.2.4 Divergent formats
A single provider typically offers news services in a variety of formats. In part, this is due to the variety of
devices noted above – often there is a mobile-optimised site, with stripped down content and a range of
screen sizes, or apps designed for various mobile platforms. But there is also a fragmentation of what is
actually being provided to the consumer – typically an article with several paragraphs of text, and one or
Oliver & Ohlbaum Ltd 17Measuring Online News Consumption and Supply
two images. But there might also be video, or a “listicle” with only limited text. It might be streamed, or
interactive – with data to explore or a facility for comments. And users might choose to do other things
with the content – linking to it, forwarding it, liking or sharing it on social media. A provider has to monitor
all of these elements to obtain a detailed view of the consumer.
Consumer behaviour also differs by formats. Even at its most simplistic, what is being consumed varies
through the day. The print newspaper reaches a larger audience on the morning (e.g. during commuting),
while the website edition is mostly browsed during office hours (between 9am and 6pm), and tablet usage
is preferred on evenings (Figure 6).
Figure 6: Consumption across multiple formats
Source: Guardian audience research, as published in Reuters Institute Digital News Report 2014
3.2.5 Differing geographic foci
The internet has broken down borders. News can be accessed from anywhere, and any source can be
both a local and an international source – both in coverage (syndicated copy is easy to aggregate) or in
readership. Even sites that offer “hyperlocal” news have substantial readership outside their target area,
as consumers seek to keep in touch with their home town, for example.
Some providers have business models founded on this globalisation. Mail Online goes for a global
audience; The Guardian has editorial teams in the US and Australia. The BBC News site is available
globally (with a further complication – outside the UK it carries adverts). Huffington Post offers multiple
geographic editions – currently 11 – but with a high degree of common content. For such outlets,
globalisation translates into a 24/7 consumption of their offerings as the ‘prime time’ of usage differs by
time-zone – a morning surge in consumption in the US would be midday in the UK while the Asian
morning cycle happens in the early hours for UK-based media. Therefore, users from different
geographies must be tracked, offered or routed to the most appropriate content at the most appropriate
time, and measured to give advertisers the information they need.
UK audiences can access news sites in multiple languages from around the globe. This has significant
implications for citizens and residents with ties to other countries and it significantly increases the
availability of news content in English in the UK.
Oliver & Ohlbaum Ltd 18Measuring Online News Consumption and Supply
3.2.6 Diversifying suppliers of news
The digital world has fragmented the locations where the public access news and public affairs
information. In the past this was easily measured as newspapers, news magazines, and radio and
television news broadcasts. Today, however, all those sources — and a growing number of digital-only
news and information providers — create and provide news and public affairs information. This
information is available not only on their digital websites and apps, but accessible through search
engines, linked to by other online content aggregators, and shared using social media.
In this environment news and public affairs information is no longer available solely in a few easily
identifiable news-related locations and identifying the scale and scope of news/public affairs content
consumption and patterns of consumptions is exceedingly difficult.
3.3 The data available from online consumption provides an opportunity
to observe and analyse actual customer behaviour
“… we have a rich data record of every single interaction for the finest grain – and we don’t just
aggregate – we store all the data in its rawest form…” (National Newspaper)
Every online action – down to a mouse movement, a scroll down or a click - leaves a data trail. Operators
can collect this data; where storage or processing costs might once have been significant, the marginal
cost of storage is approaching zero and increases in computational power mean that it can be scrutinised
for insight.
These developments in technology have also provided new opportunities for computational techniques to
be applied to a broader range of data types beyond those created from traditional server log files. These
include unstructured data (such as large amounts of prose text), and data about relationships between
individuals, organisations or concepts (social network data). The increasing price-performance of
computer hardware has allowed computationally intensive techniques such as machine learning to be
adopted which may allow for insights to be gained from the data in ways hitherto impossible. Taken
together these developments form what has been called ‘big data’. While there is no established definition
as to exactly what constitutes ‘”big data”, many organisations are seeking to invest in their data gathering
and analysis capabilities to improve their performance by placing analysis of data, rather than
management’s intuition at the heart of their decision making processes.
While this trend towards ‘data-driven decision making’ in organisations may involve more traditional forms
of analysis as well or instead of “big data” approaches, it is clear that this has implications for business
models and organisational structure for those organisations which adopt these new approaches, and
helps to explain the current saliency of “big data” as a business issue. Our industry interviews suggest
that news providers are increasingly using data in their decision making. However, for the news business,
this is not really a true “big data” issue – rather it much more an extension of traditional business
intelligence, and is seen as such by news providers. One way of segmenting the different approaches to
the analysis of data is set out in a 2014 report by Nesta which draws a clear distinction between the two
(Figure 7).
Oliver & Ohlbaum Ltd 19Measuring Online News Consumption and Supply
Figure 7: The Features of Each Data Mode
Source: Bakhshi et al. (2014) Model Workers, Nesta
Even those news providers who have set out to capture as much data as they can – view their activities in
this area primarily as an extension of their existing business intelligence or web analytics activity.
“…our traditional BI tools are pretty poor at this – they are not customised enough. So we have
built it bespoke with front-end development on top of our data...” (National Newspaper)
However, the needs of the academic community – with a wider dataset and without the more rigid
requirements of commercial operators – are more likely to be met by a “big data” approach; they can look
at an entire population of users rather than just a sample, and across their entire interaction with the news
service rather than just a summary, or what they remember. Unfortunately, their access to the full depth
and detail of the data collected by operators is much more limited.
Oliver & Ohlbaum Ltd 20Measuring Online News Consumption and Supply Measurement: gaining insight from too much information Oliver & Ohlbaum Ltd 21
Measuring Online News Consumption and Supply

   4. Measurement: who, what and why?
                 “We don’t assume that if we put an article on the web then people will automatically read it –
                 that’s a print mentality. We need to know that they read it” (Digital editor, national press)

   4.1   Introduction
         The data collected by online services are of interest to a variety of stakeholder groups (even within the
         same organisation). They have different reasons for collecting and analysing it, and thus different
         requirements for what actually is measured. In this chapter we seek to understand this “who, what and
         why” driving the evolution of online data.

         Digital services are increasingly important to all news providers. For new entrants they can represent their
         entire business; for traditional players they are a source of growth in an otherwise difficult market. As
         such they are the subject of a lot of management attention.

         This is in part because online media, with a direct connection to the consumer and return path for data,
         can collect and aggregate far more information on that consumer than ever before – giving an opportunity
         to measure and monitor in a detail that was hitherto absent. However, online news consumption is also
         far more complex than more traditional media, with consumers developing a sophisticated array of news
         sources, and displaying far more promiscuity in their choices. So while online offers the opportunity of
         increased understanding, it also makes it imperative for organisations to create the means to do so.

         Broadly, online user data can be and is used by four main stakeholder groups:

                      •   Commercial – as a means to sell advertising or subscription
                      •   Managerial – as a means of monitoring the performance of the organisation
                      •   Editorial – as a means of monitoring audience reaction to content and the relative
                          performance of stories and treatments
                      •   Academic/Social – as a means of monitoring the behaviour of consumers, their relation to
                          news, and its social impact

         There has been a tendency for each part of the media business to develop individual metrics, but as most
         sources recognised, one thing is universal:

                 “We used to have a Church / State divide between editorial and commercial, but we’ve made a
                 big effort to use a standard language across the business. We’ve got everyone joined up around
                 ‘Readers reading more things.’ That’s the core mission of editorial, and commercial can sell off
                 it.” (National newspaper)

4.1.1    Commercial
         The commercial department seeks to maximise revenue to the news provider (this can be advertising,
         subscription, or a combination of both). Understanding the site’s consumers, their composition and their
         behaviour (together with similar information on competitors’ offerings) can be used to tailor the offer to
         advertisers and to users. For subscriber businesses, individual user behaviour can be used to predict
         and prevent subscriber churn. To fully understand consumers, though, the commercial department need
         demographics not currently available from web systems – and so supplement this with panel data (often
         in-house) or bespoke surveys.

         Oliver & Ohlbaum Ltd                                                                                     22
Measuring Online News Consumption and Supply
4.1.2 Managerial
Management information usually combines a variety of editorial and commercial metrics, typically
produced weekly or monthly and combined into a dashboard of indicators. These are displayed over
time, to show areas of growth (or concern); particular issues, and relative performance against peers.
4.1.3 Editorial
The granularity of information collected allows the performance of individual stories to be monitored – and
if necessary altered – in near real time. Headline testing has become common. Each article can have
three or more headline versions and after a few minutes it is often clear which one will be kept as it drives
more traffic. Statistics can be delivered to the individual desktop and journalists can alter their own
stories. At a more senior level, editorial staff can assess the weighting given to certain coverage or its
placement on the page.
4.1.4 Academic/Social
In addition to the usage and behaviour measures noted, academic and social interests focus around three
main areas: 1) individuals’ media use and its impact (on attitudes, behaviour, and knowledge, for
example), 2) patterns of information diffusion and the types of information being diffused (through news
media as well as social media websites, for example), and 3) the structural implications of the
development of new metrics for how media organisations, including news media, are run, prioritize
resources, and produce content. Researchers are employing digital measurement methods such as
sentiment analysis, the use of log files, and social network analysis of specific aspects of digital media
use (such as links, comments and sharing), but tend to rely on well-known and inherited methods in their
studies of audience behaviour and media use across platforms: quantitative methods (surveys,
experiments, content analysis) and qualitative methods (interviews, focus groups, discourse analysis, and
ethnographic observation). This type of research tends to employ a wider range of measurement and
analysis methods than those used in industry, primarily because the answers sought and time available
for research differ.
4.2 What do they measure?
A wide array of measurements and metrics are in use. Broadly, they can be categorised under six types:
• Usage – the numbers of people are using the service, and the volume of their use
• Engagement – for example, the length of a user’s stay per visit to the service, and the extent to
which they are engaging with and using the content
• Editorial performance – allowing the performance of individual stories or treatments of a story
compared and assessed
• Competition – to understand what a service’s peers and competitors are doing
• Navigation – understanding how do users get access to, and how they navigate around the
service
• Behavioural – how people are using, interacting and sharing the information they glean
4.2.1 Usage
The principal measurement of usage is reach – how many users a news provider has. This is key to
advertising sales – potential advertisers want to know how big the audience they can access through
using a particular service. Historically reach was (and in some cases still is) defined as “unique visitors,”
but the proliferation of devices has made this impossible to track. Most systems (through cookies or
tagging) can only track the browser accessing the content. Rather than individuals, “unique browsers”
has thus become the industry standard metric. De-duplication into individuals is possible using sample
panel data, but is less accurate.
Oliver & Ohlbaum Ltd 23You can also read