MEASURING ROAMING IN EUROPE: INFRASTRUCTURE AND IMPLICATIONS ON USERS' QOE - VAIBHAV BAJPAI
←
→
Page content transcription
If your browser does not render page correctly, please read the page content below

This article has been accepted for publication in a future issue of this journal, but has not been fully edited. Content may change prior to final publication. Citation information: DOI 10.1109/TMC.2021.3058787, IEEE
                                                                                              Transactions on Mobile Computing
                                                                                                                                                                                                            1

                       Measuring Roaming in Europe:
               Infrastructure and Implications on Users’ QoE
                       Andra Lutu1 , Martino Trevisan2 , Ali Safari Khatouni3 , Anna Maria Mandalari4 , Ana Custura5 ,
                                     Marco Mellia2 ,Özgü Alay6,7 , Marcelo Bagnulo8 , Anna Brunstrom9 ,
                                               Vaibhav Bajpai10 , Jörg Ott10 , Gorry Fairhurst5
           Telefonica Research1 Politecnico di Torino2 Western University3 Imperial College London4 University of Aberdeen5 Simula
           Metropolitan6 University of Oslo7 Universidad Carlos III de Madrid8 Karlstad Universitet9 Technische Universität München10

                 Abstract—“Roam like Home” is the initiative of the European Commission to end the levy of extra charges when roaming within the
                 European region. As a result, people can use data services more freely across Europe. However, the implications of roaming solutions
                 on network performance have not been carefully examined yet. This paper provides an in-depth characterization of the implications of
                 international data roaming within Europe. We build a unique roaming measurement platform using 16 different mobile networks
                 deployed in 6 countries across Europe. Using this platform, we measure different aspects of international roaming in 4G networks in
                 Europe, including mobile network configuration, performance characteristics, and quality of experience. We find that operators adopt a
                 common approach to implement roaming called Home-routed roaming. This results in additional latency penalties of 60 ms or more,
                 depending on geographical distance. This leads to worse browsing performance, with an increase in the metrics related to Quality of
                 Experience (QoE) of users (Page Load time and Speed Index) in the order of 15-20%. We further analyze the impact of latency on
                 QoE metrics in isolation and find that the penalty imposed by Home Routing leads to degradation on QoE metrics up to 150% in case
                 of intercontinental roaming. We make our dataset public to allow reproducing the results.

                                                                                                          !

         1      I NTRODUCTION                                                                                 distributed them across the six countries. Using this setup,
                                                                                                              we characterize roaming operation and network perfor-
         International roaming allows mobile users to use their voice                                         mance and evaluate the impact on web applications while
         and data services when they are abroad. The European                                                 roaming. Our experimental campaign includes a wide range
         Commission (EC), in an effort to create a single digital                                             of measurements, including traceroute, DNS lookups,
         market across the European Union (EU), has (as of June                                               HTTP downloads and fully automated webpage visits.
         2017) launched a set of regulations [1] as part of the “Roam                                             We find that all observed MNOs use home-routed roam-
         like Home” initiative. It abolishes additional charges for                                           ing (HR), meaning that all the user’s traffic is routed through
         users when they use voice and data services while roaming                                            the home network. This has several implications. First, HR
         in the EU. It is designed to prevent unexpected charges due                                          translates in a latency penalty when roaming due to the
         to extra mediation and billing costs when roaming services                                           longer paths that packets travel. For instance, when visiting
         are active. In this setting, Mobile Network Operator (MNO)                                           a Spanish website when in Spain with a Norwegian SIM,
         are expected to deliver services with Quality of Service                                             packets have to travel between Spain and Norway. Second,
         (QoS) properties similar to the ones a user experiences when                                         all services will be available in the same way as in the home
         at home.                                                                                             network, and the use of the home network DNS server
             In this paper, we present an extensive large-scale mea-                                          implies that users would be redirected to CDN content
         surement study to understand the roaming ecosystem in                                                at their home network. Third, we do not observe traffic
         Europe after the “Roam like Home” initiative. More specif-                                           differentiation policies for VoIP or web. Yet, content-based
         ically, we investigate: (i) Which technical solutions are actu-                                      filtering and geo-blocking policies complicate the picture,
         ally being deployed and used today? and (ii) What are the                                            as home-country rules would apply. Forth, we observe
         implications of roaming on the service experienced by the                                            that the additional latency imposed to roaming users may
         roaming user? This paper extends our previous work [25]                                              negatively affect web browsing Quality of Experience (QoE).
         with new measurements and a thorough analysis of the                                                 Indeed, our measurements show that popular QoE-related
         implications of roaming on web browsing performance, that                                            metrics (i.e., onLoad and SpeedIndex) increase in the order of
         we use as an example of the impact of technical choices.                                             15-20% when roaming. Additional controlled experiments
             To address these questions, we build on the top of a                                             confirm the negative effect of network latency on web
         unique measurement platform, MONROE-Roaming, to as-                                                  browsing performance, showing that intercontinental roam-
         sess roaming and its performance implications. The plat-                                             ing can degrade the metrics up to 150%. While we were
         form integrates dedicated measurement hardware that we                                               not able to check given the limitations of our platform,
         deployed in six different countries across Europe, covering a                                        we agree that the same delay would impact applications
         total of 16 MNOs. We purchased regular Subscriber Identity                                           too, since HR applies to all traffic. We release our dataset
         Modules (SIMs) that support roaming for these MNOs and                                               to stimulate further analyses and allow reproducing our

 1536-1233 (c) 2021 IEEE. Personal use is permitted, but republication/redistribution requires IEEE permission. See http://www.ieee.org/publications_standards/publications/rights/index.html for more information.
             Authorized licensed use limited to: Technische Universitaet Muenchen. Downloaded on February 16,2021 at 10:26:07 UTC from IEEE Xplore. Restrictions apply.
This article has been accepted for publication in a future issue of this journal, but has not been fully edited. Content may change prior to final publication. Citation information: DOI 10.1109/TMC.2021.3058787, IEEE
Transactions on Mobile Computing
Evolved Universal
Mobile Node Mobile Node
Terrestrial Radio
Access Network
(home user) (roaming user)
Further (mobile) MNOs
network operators
eNodeB eNodeB eNodeB eNodeB
NO Telia NO Telenor NO
SE Telia SE Telenor SE 3 SE
SGW MME SGW R R SGW MME SGW UK Vodafone UK EE
Evolved Packet
Core (EPC)
HSS HSS
DE Vodafone DE T-Mobile O2
ES Vodafone ES Movistar Orange
AAA AAA IT Vodafone IT TIM 3 IT
PGW PGW PGW PGW PGW PGW
Home network IPX network Visited network
Home-routed IPX Hub Local
Roaming Breakout Breakout
Figure 2: The distribution (left) of the MONROE-Roaming
nodes in six countries and (right) SIMs for 16 MNOs we
Internet
measure across Europe. Each country deploys two MONROE-
Home-Routed roaming (HR) Local Breakout (LBO) IPX Hub Breakout (IHBO) Roaming nodes and one measurement server.
Figure 1: Internet access options for a mobile node at home
(left) and when roaming (right). IP-based services can be accessed directly from there. This
does not add latency and reduces network resource usage,
but may restrict access to private services in the user’s home
results. It is available online, along with access instructions network. Service control and charging also become more
and a description of the tables.1 complex using LBO.
The remainder of the paper is organized as follows. IHBO [6] provides an alternative to overcome the lim-
Section 3 describes the MONROE-Roaming platform, while itations of home-routed roaming and local breakout. Here,
Section 4 illustrates the collected measurements. In Sec- the IP address of the roaming user is provided by the IPX
tion 5, we describe our findings in terms of roaming config- network. The GTP tunnel from the SGW in the visited
urations and their implications, while Section 6 focuses on network terminates at a PGW in the IPX network. There
the QoE of web users. In Section 7, we further quantify the may be multiple PGWs so that latency and resource usage
implications of “Roam like Home” on users’ QoE through can be reduced by selecting one geographically close to the
controlled experiments. Sections 8 discusses our results and visited network. As the IPX network maintains a trusted
related work. Finally, Section 9 concludes the paper. relationship with the home network, it may assign an IP
address recognized by the home network to the roaming
user, thereby allowing the user access also to private services
2 BACKGROUND in the home network. IHBO can also simplify setup and
management as a single GTP tunnel, terminated in the IPX
To support roaming, MNOs commonly connect with each
network, can be used for roaming users from different home
other through an IP Packet Exchange (IPX) network. An
networks.
IPX [3], [2] can be described as a hub that interconnects
The topology can have a potential impact on communi-
MNOs over a private IP backbone network and is possibly
cation performance. For instance, when the node accesses
run by a third party IPX provider. An IPX provider has
services inside the visited network, the performance is likely
connections to multiple network operators and thus enables
to be worse in the HR case, because all packets travel twice
each MNO to connect to other operators via a single point
between the visited and the home country; less so when
of contact. The interconnections between MNOs are accom-
the communication peer is in a third country and shall
panied by roaming agreements that enable the operators
be minimal when accessing services in the home country.
to apply policies, control network access for roaming sub-
This may also have implications in the selection of Content
scribers, and manage their roaming services. In Figure 1, we
Delivery Network (CDN) when roaming abroad because the
present a set of topology architectures that can be used for
mobile user will access a server in the home network rather
roaming in a mobile network, namely, HR (solid red path),
than one close to their location. At last, this has implications
local breakout (LBO) (dashed purple path), and IPX hub
on content-based filtering and geo-blocking policies as home
breakout (IHBO) (dotted green path).
rules would apply. We seek to understand which of these
With HR [4], [5], the IP address of the roaming user is
routing schemes are currently in use and which are their
provided by the home network. All traffic to and from the
QoE implications.
mobile user is routed through the home network, for which
a GPRS Tunneling Protocol (GTP) tunnel is set up between
the Serving Gateway (SGW) of the visited network and the 3 P LATFORM AND M EASUREMENT S ETUP
Packet Data Network Gateway (PGW) of the home network. In this section, we present the hardware platform we use for
With the IP endpoint in the home network, all services will roaming measurements and how we orchestrate it to collect
be available in the same way as in the home network. our data.
When LBO [4], [5] is in place, the IP address of the
roaming user is provided by the visited network. The GTP 3.1 MONROE-Roaming Platform
tunnel is terminated at the PGW of the visited network and
We design and build MONROE-Roaming, a dedicated plat-
1. https://smartdata.polito.it/measuring-roaming-in-europe- form for roaming measurements in Europe. MONROE-
infrastructure-and-implications-on-users-qoe/ Roaming integrates several components that we depict in
2
1536-1233 (c) 2021 IEEE. Personal use is permitted, but republication/redistribution requires IEEE permission. See http://www.ieee.org/publications_standards/publications/rights/index.html for more information.
Authorized licensed use limited to: Technische Universitaet Muenchen. Downloaded on February 16,2021 at 10:26:07 UTC from IEEE Xplore. Restrictions apply.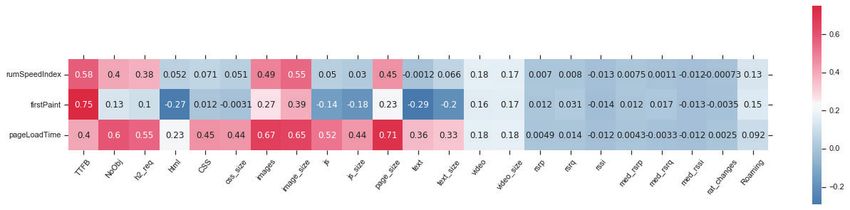
This article has been accepted for publication in a future issue of this journal, but has not been fully edited. Content may change prior to final publication. Citation information: DOI 10.1109/TMC.2021.3058787, IEEE
Transactions on Mobile Computing
Table 1: Terminology. We take the perspective of a given
mobile user that has a SIM card registered with a service (
&
"#
provider in her home network.
&
"
'
"
(
!
Home SIM The mobile user SIM while in the home country and !"
#
" !
#
" '
connected to the home network.
Roaming SIM The mobile user SIM while she is roaming
in a foreign country
Visited SIM A SIM subscribed to visited network in the visited
' %
%' "'
country.
!"
Home Network The network to which the mobile user subscribes.
Visited Network The network to which a user connects while roaming
internationally in the visited country.
!#"!
Home Server A server located in the home network of the user’s SIM.
Visited Server A server located in the network to which user roams, !#
"
i.e., the visited network. $ !
"!
$ !
Figure 3: MONROE-Roaming platform and experimental
Figure 3. The main blocks include measurement nodes dis-
setup. We exemplify our setup for Vodafone DE. We have five
tributed in six different EU countries, the backend system, Vodafone DE SIMs in international roaming nodes and another
several measurement servers, and a scheduler, all of which SIM in the home country node. For each roaming Vodafone
we detail next. To build the MONROE-Roaming platform DE SIM, we insert the SIM corresponding to the local roaming
we adapted the open-source software provided by MON- partner for the MNO. For example, in Sweden, we use the
ROE [10], an open measurement platform. 2 Telenor SE SIM which corresponds to the network on which
MONROE-Roaming nodes: Each MONROE-Roaming the Vodafone DE SIM is camping.
node is equipped with an APU board from PC Engines with
two 3G/4G MC7455 LTE CAT6 miniPCI express modems.
native to the visited country. For example, Vodafone DE
Because of the high cost of nodes and subscriptions, and
in Germany is a roaming partner of Telenor SE in Swe-
the complexity of the coordination effort required (see Sec-
den. Therefore, Telenor SE serves Vodafone DE’s customers
tion 3.3), we have set up a platform with a total of 12
roaming in Sweden by allowing Vodafone DE users to
MONROE-Roaming nodes dedicated for roaming measure-
camp on Telenor SE’s network. For each roaming SIM, we
ments.
identify the corresponding visited network (e.g., Telenor SE
MONROE-Roaming backend: Upon completion of each
in Sweden for Vodafone DE) and, when available, activate
measurement, MONROE-Roaming nodes transfer the mea-
the corresponding native SIM from the visited network
surement results to the backend for further analysis.
(which we hereinafter denote by visited SIM). We illustrate
Measurement servers: We have deployed one measure-
this configuration in the experimental setup in Figure 3. We
ment server in each country as measurement responders
also describe the terminology in Table 1.
and also to capture traffic traces.
With our experimental setup, we can measure at the
MONROE-Roaming scheduler: The scheduler allows
same time the Roaming SIM, the Home SIM and the Visited
the user to query for resources, select nodes and launch
SIM. One SIM card was kept in the home country (where it
different tests in the platform simultaneously. We used
was purchased), and the other five SIM cards were shipped
the open-source MONROE scheduler as a basis for the
to the visiting countries where these SIM cards will be roam-
MONROE-Roaming scheduler. Each test is designed and
ing during the measurements. For each set of measurements,
implemented in a Docker container [28].
we evaluate the roaming service offers by a single MNO
while roaming in different countries.
3.2 Experimental Setup
To understand the roaming ecosystem in Europe, we focus 3.3 Measurement Coordination
on diversity of the MNOs. In other words, we aim to cover
a large number of SIMs rather than running measurements Each MNO-specific measurement campaign involves 11
from a large number of vantage points. To this end, we SIMs and 6 nodes: (i) one node with the home SIM and (ii)
deployed two MONROE-Roaming nodes in each of the six five nodes with both the roaming SIM and the correspond-
European countries to measure a total of 16 MNOs that ing visited SIM, as illustrated in Figure 3. This enables us to
operate their own network, as illustrated in Figure 2. capture performance metrics for the roaming SIM, but also
For each MNO, we bought six SIMs that support roam- to compare those with the local performance of the home
ing in Europe and we distributed one SIM in each of the network and the visited network (when possible).
countries we cover. For example, in Germany, we bought Before running the set of measurements (see Section 4),
six Vodafone DE SIMs that support roaming. We kept one we first need to configure the nodes by activating and de-
Vodafone DE SIM as the home SIM in the home country ploying the SIMs. For each MNO, we perform the measure-
(i.e., Germany). Then, we distributed five roaming SIMs ments at the same time from all six countries and coordinate
from Vodafone DE to the other five countries (i.e, Sweden, the configuration of the experimental setup in two steps:
Norway, UK, Italy and Spain). Each roaming SIM connects Home and Roaming User Activation: To measure a
to (or camps on) a local roaming partner (or visited network) MNO, we first insert the SIM into the first SIM slot in each
node in all six deployment locations. For the SIM active in
2. https://www.monroe-project.eu/access-monroe-platform/ its home country, this step triggers the home user activation
3
1536-1233 (c) 2021 IEEE. Personal use is permitted, but republication/redistribution requires IEEE permission. See http://www.ieee.org/publications_standards/publications/rights/index.html for more information.
Authorized licensed use limited to: Technische Universitaet Muenchen. Downloaded on February 16,2021 at 10:26:07 UTC from IEEE Xplore. Restrictions apply.
This article has been accepted for publication in a future issue of this journal, but has not been fully edited. Content may change prior to final publication. Citation information: DOI 10.1109/TMC.2021.3058787, IEEE
                                                                                              Transactions on Mobile Computing

         (by inserting the SIM in the measurement node). For the rest                                          times towards each target. The resulting dataset lists the set
         of the nodes, this step triggers the roaming user activation.                                         of IP hops along the forwarding paths from each vantage
             Visited User Activation: Once we complete the home                                                point towards each measurement responder. Additionally,
         and roaming user activation, we check which visited net-                                              we collect the public IP address for each vantage point (i.e.,
         work the roaming SIM uses in each of the five visited                                                  the IP endpoint associated with the mobile client as seen
         countries. Then, we insert the SIM of each partner MNO                                                from the public Internet). We use traceroute for RTT
         (when available) into the second slot of each corresponding                                           measurements as well, since we collect and store the latency
         node.                                                                                                 to the target and intermediate nodes as provided by the
             Using the MONROE-Roaming scheduler, we orchestrate                                                traceroute command-line tool.
         the execution of the measurements so that they run in                                                     dig: We run the dig utility for DNS lookups (over UDP
         parallel on all nodes. The measurement coordination effort                                            port 53) against a list of 180 target Fully Qualified Domain
         was a significant part of the process. In each country, at                                             Names (FQDNs) mapped to advertisement services. We use
         least one person was dedicated to carry out the physical                                              the independent filter lists from https://filterlists.com to
         experimental setup configuration for each MNO promptly.                                                build the list of targets. We focus on ad services because
         Given that we deploy two nodes per country, we could                                                  this type of third party services inflates significantly per-
         measure two MNOs and (maximum) 22 SIMs in parallel.                                                   formance metrics of web services (e.g., page load time), as
         We coordinated the SIM changes over email. Furthermore,                                               well as impact the web experience of mobile users [17].
         before the change of the next pair of SIMs, we double-                                                Thus, it is important to capture (and potentially eliminate)
         checked the measurement results we had collected to ensure                                            any additional delay penalty that might impact how fast a
         correctness and completeness of the dataset. Each round                                               roaming user receives this type of content. Each experiment
         lasted one week, over a total period of more than four                                                uses the default DNS server for the tested MNO and queries
         months of experiments. We collect measurements continu-                                               for the A record associated with each of the target FQDNs.
         ously, without restricting to any specific time of the day.                                            We store the entire output of each dig query, including the
                                                                                                               query time, the DNS server used and the A record retrieved.
                                                                                                               We repeat the dig queries twice for each FQDN from each
         4      M EASUREMENTS                                                                                  vantage point, for a total of more than 2,000 queries per
         4.1      Roaming Infrastructure Measurements                                                          round.
         We run a series of measurements that enable us to identify                                                curl: We run curl towards a set of 10 target pop-
         the roaming setup, infer the network configuration for the                                             ular webpages4 over HTTP1.1/TLS. We repeat the mea-
         16 MNOs that we measure and quantify the end-user perfor-                                             surements towards each URL at least 10 times (increasing
         mance for the roaming configurations which we detect. We                                               the sample size if the SIM data quota allows it). We store
         run traceroute for path discovery, dig for Domain Name                                                various metrics, including the download speed, the size of
         Service (DNS) lookups and curl for testing HTTP data                                                  the download, the total time of the test, the time to first byte,
         transfers with popular URLs. We complement this analysis                                              the name lookup time (query time) and the TCP handshake
         with metadata (e.g., radio access technology, signal strength                                         time.
         parameters) collected from each node. We do not run ex-                                                   metadata: We collect contextual information from the
         tensive throughput measurements, as the SIM data quotas                                               nodes, including the visited network Mobile Country Code
         make it difficult to run large-scale experiments. Moreover,                                            (MCC) / Mobile Network Code (MNC) for each roaming
         throughput depends on many factors (TCP settings and                                                  SIM and the radio technology. This allows us to verify which
         cross-traffic among all), and, as such it would be difficult to                                         visited network each roaming SIM uses as well as to identify
         draw solid conclusions. The reader can find in our previous                                            and separate the collected data by radio technology.
         work [22] a discussion on speedtest-like measurements on
         mobile networks and on online posts3 , which confirm our                                               4.2    Web Browsing Measurements
         findings.
            For each MNO, we measure in parallel the roaming user,                                             To deeper study the impact of roaming on web browsing
         the home user and the visited user (see Section 3 for termi-                                          performance, we run a specific measurement campaign. We
         nology) through the MONROE-Roaming scheduler. In this                                                 leverage a customizable Docker container called MONROE-
         way, we are able to capture potential performance penalties                                           Browsertime [7] that we specifically engineered to run
         that might result, for example, from roaming internationally                                          on any MONROE node, including the MONROE-Roaming
         under a home-routed configuration. We performed mea-                                                   nodes. We configured MONROE-Browsertime to mimic a
         surements using both 3G and 4G networks to evaluate the                                               mobile device browser (by setting both the screen resolu-
         impact of potentially different configurations for the two                                             tion and the user-agent accordingly) to retrieve the mobile
         radio access technologies.                                                                            versions of the web pages. With it, we direct the browser
            Next, we describe each measurement test and its result-                                            to load a page and, at the end of page rendering, execute a
         ing dataset in more detail.                                                                           custom Javascript script to collect a large number of metrics.
            traceroute: We run periodic traceroute measure-
         ments against all the servers we deploy in each country as                                              4. We target the following web pages: www.httpvshttps.com,
                                                                                                               facebook.com/telia/,    en.wikipedia.org/wiki/Timeline_of_the_far_
         measurement responders. We repeat the measurements ten                                                future, linkedin.com/company/facebook, www.yahoo.com/movies,
                                                                                                               instagram.com/leomessi/, google.com/search?q=iPhone+7,youtube.
           3. https://www.speedtest.net/insights/blog/roaming-southeast-                                       com/watch?v=xGJ5a7uIZ1g, ebay.com/globaldeals, nytimes.com,
         europe-2018/                                                                                          theguardian.com.uk/lifeandstyle.

                                                                                                           4
 1536-1233 (c) 2021 IEEE. Personal use is permitted, but republication/redistribution requires IEEE permission. See http://www.ieee.org/publications_standards/publications/rights/index.html for more information.
             Authorized licensed use limited to: Technische Universitaet Muenchen. Downloaded on February 16,2021 at 10:26:07 UTC from IEEE Xplore. Restrictions apply.
This article has been accepted for publication in a future issue of this journal, but has not been fully edited. Content may change prior to final publication. Citation information: DOI 10.1109/TMC.2021.3058787, IEEE
                                                                                              Transactions on Mobile Computing

         We use the X virtual framebuffer (Xvfb) [9] for display em-                                               RUMSpeedIndex (SI): It monitors the rendering process
         ulation to let the browsers render the webpages. MONROE-                                              of the page by tracking the evolution of visible rectangles
         Browsertime provides a configurable experiment template                                                with elements that loaded external resources on a page. The
         to enable web measurements in MONROE [32]. We config-                                                  original SpeedIndex requires to film the rendering process,
         ure each measurement by controlling (i) the network to test                                           and the postprocessing of the video to observe changes.
         (the desired MBB interfaces, namely the roaming SIM and                                               Given the limited resources of the MONROE nodes (in
         the corresponding visited SIM), (ii) the browser (in our case,                                        terms of CPU, storage and communication bandwidth), we
         we select Chrome 64.0.3282.186), and (iii) the web protocol                                           opt for the RUMSpeedIndex approximation, which uses the
         (we run HTTP/1.1).5 A combination of these parameters                                                 sequence of events as reported by the browser to estimate
         builds an experiment setup. We opted to use HTTP/1.1 to                                               the time in which the visible portion of the screen would be
         have a fair comparison among all websites since our goal is                                           modified [8]. Intuitively, it calculates the likely time that a
         uniquely to spot performance variations under roaming. In                                             paint event happens, given the processing and downloading
         our previous work [32], we run an extensive measurement                                               of the various elements by the browser. The SI corresponds
         campaign to assess the impact of HTTP/2 and QUIC under                                                to the time when the last paint happens. This is considered
         mobile networks, finding negligible differences in perfor-                                             a QoE approximation since it considers the evolution of the
         mance and users’ QoE.                                                                                 rendering process as seen by the user.
             We select a list of 100 target pages to download from the                                             Given the interplay of objects, rendering, and visible
         SIMs of MNOs in Spain, Germany, Norway, and Sweden.                                                   portion of the page on the screen, there is no clear ordering
         We avoid the landing page in case it is too trivial (e.g.,                                            on the metrics. For instance, the rendering of a page can start
         downloading https://instagram.com/leomessi/ in-                                                       after one, or some, or all objects have been downloaded.
         stead of https://instagram.com/). Our selection cov-                                                  Similarly, the rendering process may involve a portion of
         ers a wide range of user interests in terms of topics, in-                                            the area which is not currently on the visible part of the
         cluding social networking, video, career, education, search                                           browser window. In addition, analytics objects are typically
         engine, travel help, news, wiki, and shopping. Even more,                                             downloaded as last elements, after the rendering is com-
         we ensure that the list of target pages also contains web                                             pleted, thus inflating the PLT. For this, it is consistent to
         pages that are of interest mostly within the home country                                             compare results considering the same metric, but it is not
         of the users (e.g., national news outlets). All websites expect                                       appropriate to compare across different metrics.
         TLS connections by default. We execute 10 different repeti-                                               Our platform does not allow us to test mobile apps.
         tions of measurements per target website. For each MNO,                                               Given also the lack of well-accepted benchmarks to measure
         we measure in parallel the roaming user, the home user and                                            QoE on apps, we limit our tests to consider the mobile web
         the visited user where available (see Section 3 for terminol-                                         browsing case. Albeit nowadays a large fraction of mobile
         ogy) through the MONROE-Roaming scheduler. We collect                                                 traffic is generated by apps, still a significant fraction is due
         measurement from SIM of eight different operators (namely                                             to web browsing. In addition, as apps commonly use HTTP
         Orange ES, Vodafone ES, Telenor NO, Telia SE, Telenor                                                 as application protocol, we argue that mobile apps would
         SE, Tre SE, Telekom DE, and O2 DE) active in each of the                                              suffer similar impairments of web applications when used
         countries that MONROE-Roaming covers (namely, ES, NO,                                                 in roaming.
         SE, DE, IT and UK). In total, we perform 68 k visits to 100
         URLs.
                                                                                                               5     R OAMING I NFRASTRUCTURE
             We track three main metrics that have been shown to
         be correlated with users’ QoE [14]: Page Load Time (PLT),                                             5.1    Roaming configuration
         FirstPaint (FP) and RUMSpeedIndex (SI), which we detail                                               Our initial goal is to determine the roaming setup for each
         next. The tool derives these metrics from browser timing                                              MNO (i.e., whether it used LBO, HR or IHBO). For this, we
         metrics [27] that record the timing of different rendering                                            determine the MNO that allocates the public IP address of
         phases of a page, from the initial DNS resolution to each                                             the roaming SIM. Our results show that HR was used by all
         HTTP request, from JavaScript processing to objects render-                                           16 MNOs from all the different roaming locations we capture.
         ing.                                                                                                  We further corroborate this result by retrieving the first
             First Paint (FP): It corresponds to the time when the                                             hop replying with a public IP address along the forwarding
         browser starts rendering the first element of the page. This                                           path from a roaming SIM to each server and identifying
         happens as soon as the first element of the page has been                                              the MNO that owns it. We find that the first hop with a
         fetched and processed, and after the downloading of all                                               public IP address along the path lies in the original home
         needed elements (e.g., stylesheets).                                                                  network of each roaming SIM, which is consistent with HR.
             Page Load Time (PLT): This is the time the last object                                            We repeated the experiments periodically, and always found
         on the page has been downloaded. It occurs when all the                                               that HR was still in place. Our last measurements were
         HTML files and any sub-resources (images, fonts, CSS,                                                  performed in June 2019.
         videos, etc.) are loaded. Note that not all these elements are
         needed to complete the rendering of the visible portion of                                            5.2    Details on Roaming Infrastructure
         the page.                                                                                             We now evaluate the following performance metrics for
                                                                                                               each roaming SIM, home SIM and visited SIM: (i) the
           5. The nodes use the mobile carrier DNS resolver consistently with                                  number of visited networks we observe for the roaming
         the operator currently in use.                                                                        SIM, (ii) the number of hops from vantage point to target

                                                                                                           5
 1536-1233 (c) 2021 IEEE. Personal use is permitted, but republication/redistribution requires IEEE permission. See http://www.ieee.org/publications_standards/publications/rights/index.html for more information.
            Authorized licensed use limited to: Technische Universitaet Muenchen. Downloaded on February 16,2021 at 10:26:07 UTC from IEEE Xplore. Restrictions apply.
This article has been accepted for publication in a future issue of this journal, but has not been fully edited. Content may change prior to final publication. Citation information: DOI 10.1109/TMC.2021.3058787, IEEE
Transactions on Mobile Computing
measurement server, (iii) the number of home network
PGWs that the roaming SIMs reached in comparison with 1.00
the home network SIMs.
Visited network selection: The metadata we collect dur- 0.75
ing the measurement campaign for each MNO enables us
ECDF
to verify the visited network that each roaming user camps 0.50
on in the visited country. In general, we note stability both Roaming SIM → Visited Server
in 4G roaming and 3G roaming in the selection of the 0.25 Roaming SIM → Home Server
visited network (Table 2) in the six roaming locations. We Visited SIM → Home Server
also observe some differences between MNOs. For example, Visited SIM → Visited Server
0.00
for Telekom DE, the 4G visited network chosen by each 0 50 100 150 200 250
roaming SIM never changed during the measurement cam- RTT [ms]
paign, even when we forced the radio technology handover.
This is consistent with all the six roaming locations. For O2
DE, on the other hand, the default 4G visited network did Figure 4: ECDF of the RTT from mobile nodes to target servers.
change over time for the SIMs roaming in Italy (3 visited
networks), Norway (3 visited networks), and Sweden (2
visited networks). It should be noted that the length of the is defined between the SGW of the visited network and the
measurement period varies for each MNO, as it is impacted PGW of the home network.
Traceroutes, infrastructure: By learning the IP addresses
by multiple external factors (e.g., at times some of our
of the infrastructure elements along the forwarding path, we
measurement responders were affected by power outages or
are able to infer aspects of the infrastructure deployment
some SIM cards were not connecting to the 4G network due
strategy of each MNO. In particular, by checking the IP
to poor coverage). This may influence part of the differences
address of the first hop in the path (Table 2), we find that
observed between the MNOs.
MNOs have different strategies in terms of their deploy-
Table 2: Distribution of the first IP interface and visited net- ments. We note that the first hops have an even distribution
work per MNO. We report the total number of networks each on their assignation to mobile users, showing that the MNOs
roaming user camps on in all visited countries (# of visited
have a similar approach for load balancing in their network.
networks), the number of unique first IP addresses (# IP addr.),
the total number of traceroutes we ran for the corresponding For example, for O2 DE we find 20 different first hops,
SIM (# tests) and the distribution for each first IP address we suggesting that there might be a large number of PGWs
find (First hop breakdown(%)). deployed in the LTE infrastructure. For Vodafone UK, we
see that the same first hop appears on the forwarding path,
Visited First hop break- suggesting that the GTP tunnels of all our roaming users
MNO IP addr. Tests
Net- down(%) are terminated at a single PGW. We also note that although
works for the majority of MNOs these hops are configured with
3G 4G
O2 DE 9 9 20 657 1; 1; 1; 2; 2; 2; 2; private address space [31], three operators (Telekom DE,
2; 3; 3; 3; 4; 4; 5; Telenor NO, and Telenor SE) use public address space for
6; 6; 9; 9; 11; 24 their infrastructure. The last column in Table 2 details the
Telekom 5 5 4 1424 13; 19; 25; 43 breakdown of measurements among the number of different
DE
Voda DE 5 6 2 1511 46; 54 first hop IP addresses found. In some cases, a clear bias
Movistar 6 6 8 282 4; 5; 5; 7; 8; 21; exists.
ES 22; 28 Finally, we verify that the set of first hops for roaming
Orange ES 7 7 3 900 6; 43; 51 SIMs is the same as the set we observe from the home SIMs.
Voda ES 5 5 1 1943 100
TIM IT 6 6 4 497 1; 1; 46; 52 This suggests that the roaming SIMs do not receive any
Voda IT 5 5 4 759 19; 19; 23; 39 differential treatment in terms of allocation to the PGWs.
Telenor 5 5 3 398 8; 30; 62 This is consistent for all MNOs we measure. Furthermore,
NO when checking the 3G forwarding paths, we find that the
Telia NO 5 5 4 379 7; 16; 38; 39
3 SE 7 6 2 828 44; 56 set of IP addresses we see in 3G is a subset of the set of IP
Telenor SE 5 5 2 1362 32; 68 addresses we see in 4G, suggesting that the two functions
Telia SE 5 5 4 379 7; 16; 38; 39 are co-located in the same PGW [26]. We also check the time
EE UK 5 5 9 1038 3; 4; 4; 5; 8; 13; when the first IP address was used. We discover that all the
17; 19; 27
Voda UK 5 5 1 503 100
PGWs are active at the same time. Multiple first IP addresses
can be used at different times. We contacted 3 MNOs and the
information they provided about their network confirms our
Traceroutes, number of IP hops: We analyze our tracer- findings.
oute results from the roaming SIMs and compare them with
the traceroute results we collect from the corresponding 5.3 Implications of Home-Routed Roaming
home SIM towards the same target server. For all MNOs we
find that the number of IP hops is the same. 6 This is consistent Delay implications:
with the HR configuration (Figure 1), where the GTP tunnel The HR data implies that the roaming user’s exit point
to the Internet is always in the original home country
6. Traceroute for 3 IT did not work in any country to any server. (Figure 1). Thus, the data always flows through the home
6
1536-1233 (c) 2021 IEEE. Personal use is permitted, but republication/redistribution requires IEEE permission. See http://www.ieee.org/publications_standards/publications/rights/index.html for more information.
Authorized licensed use limited to: Technische Universitaet Muenchen. Downloaded on February 16,2021 at 10:26:07 UTC from IEEE Xplore. Restrictions apply.
This article has been accepted for publication in a future issue of this journal, but has not been fully edited. Content may change prior to final publication. Citation information: DOI 10.1109/TMC.2021.3058787, IEEE
Transactions on Mobile Computing
Germany Spain Italy Norway Sweden UK
UK
60
Sweden 125
RTT difference(ms)
RTT(ms)
RTT dfference (ms)
Spain 150
Query Time(ms)
Server
40 Germany 100
Italy Norway 50 100 SIM
Norway Home
Spain Roaming
Sweden Italy
UK
20 75
Germany
DE DE O2
IT V IT TIM
SE SE 3
E
e
ES vistar
ES afone
e
NO afone
e
NO nor
a
SE or
a
DE elekom
ES Orang
afon
UK UK E
afon
Teli
Teli
n
Tele
Tele
Mo
Vod
Vod
od
Vod
0
T
50
Italy Norway Spain Sweden UK Germany Italy Norway Spain Sweden UK
Country MNO Country
(a) (b) (c)
Figure 5: Delay penalty of HR: (a) RTT difference from the visited country to all servers for Vodafone DE; (b) RTT difference per
operator; (c) DNS Query time to all FQDNs for TIM IT.
network. Depending on the location of the server, this trans- We then evaluate the difference between the roaming
lates to a potential delay and performance penalty. Figure. 4 SIM RTT and the visited SIM TT towards the same target
shows the ECDF of the RTT we measured between the and we group them per MNO. Figure 5b shows the median
roaming SIMs and the target servers located in the visited value of the delay penalty of an MNO (on the x axis of
or home networks (red and green curves, respectively). We the tile plot) while roaming against each of the six different
obtain the RTT values from the traceroute measurements servers (on the y axis of the tile plot, marked by country).
using the latency measured toward the target. To compare We note that the delay penalty varies as a function of the
the HR with the LBO configuration, we also include the RTT location of the home country. For example, German SIMs
measurements between the visited SIMs against the same experience a lower delay penalty, which is potentially due
targets in the visited or home networks (blue and purple to them being in an advantageous position in the center of
curves, respectively). The RTTs experienced by the visited Europe.
SIMs serve as estimates of the RTTs that one could expect DNS implications: The results of the dig measurements
with a LBO configuration since LBO relies on access to local show that the DNS server offered to a roaming user is the
infrastructure with no need for tunneling back to the home same as the one offered when at home. This is again consis-
network. We note that the largest delay penalty occurs when tent with the use of HR. We verify whether this translates
the roaming user tries to access a server located in the visited into an inflated query time for the roaming user. Figure 5c
country. This is because the packets must go back and forth presents the distribution of DNS query times for all the SIMs
from the home network. Surprisingly, we note that the HR of TIM IT. The query time is significantly lower for the home
configuration also impacts the case when the roaming user user than for the other five roaming users. This is consistent
accesses a target server located in the home network. That for all the 16 MNOs we measured. The usage of the home
is, the GTP tunnel is slower than the native Internet path. In network DNS server further translates into implications in
this case, the median value of the delay penalty considering terms of CDN replica selection: the roaming user would be
all the MNOs is approximately 17ms. This varies across likely redirected to CDN content at its home network, and
MNOs and in some cases we observe that the delay penalty will not access the same content from a cache in the visited
is very low (e.g., just 0.2ms for O2 Germany). We check if the network (which would, in any case, result in facing a higher
delay exhibits any daily periodicity, but found to evidence delay due to the home routing policy).
of it. HTTP performance implications: Similar to the delay
We investigate this performance impact further and cal- and DNS implications, international roaming affects HTTP
culate the estimated delay penalty between LBO and HR and HTTPS performance. We quantify this penalty by con-
when the target is in the visited country. In more detail, sidering the TCP handshake time between each SIM and the
we compute the delay penalty as the difference between the target web servers. The median value of the handshake time
median delay to reach a given server when roaming, and the from the visited SIMs towards all the targets we measure
median delay to reach the same server from home. Figure 5a is 170ms, while the median value for the roaming SIMs is
exemplifies these median values for Vodafone Germany. We 230ms. This leads to a delay penalty of approximately 60ms.
note that, in general, the delay penalty varies widely with As in the cases before, some MNOs are affected more by this
the geographical location of the roaming users and the target roaming effect than others. In the following, we investigate
servers. For example, when a German SIM roams in Spain, the implications of web browsing in more detail.
the difference in terms of RTT is higher if the server is in
the visited country (i.e., Spain) (red curve in Fig. 4). If the
German SIM roams in Spain or Italy and the target server 6 W EB B ROWSING WHILE R OAMING
is in Norway or Sweden the delay penalty of the roaming In this section, we report the results of our measurement
is smaller, since to go to Norway or Sweden the data path campaign for web browsing. The results of our analysis
would anyway likely pass through Germany. show that, for any of the three QoE metrics we consider,
7
1536-1233 (c) 2021 IEEE. Personal use is permitted, but republication/redistribution requires IEEE permission. See http://www.ieee.org/publications_standards/publications/rights/index.html for more information.
Authorized licensed use limited to: Technische Universitaet Muenchen. Downloaded on February 16,2021 at 10:26:07 UTC from IEEE Xplore. Restrictions apply.
This article has been accepted for publication in a future issue of this journal, but has not been fully edited. Content may change prior to final publication. Citation information: DOI 10.1109/TMC.2021.3058787, IEEE
Transactions on Mobile Computing
10
No Roaming
Page Load Time [s]
8 Roaming
6
4
2
0
youtube.com google.com en.wikipedia.org instagram.com
(a) Empirical CDF of QoE metrics (First Paint, RUM Speed
Index and Page Load Time) while roaming in Europe and while (a) Page Load Time
in the home country..
10
No Roaming
RUM Speed Index [s]
8 Roaming
6
4
2
0
youtube.com google.com en.wikipedia.org instagram.com
(b) RUM Speed Index
(b) Boxplot of RUM Speed Index showing the impact of roam- Figure 7: Empirical QoE metric distributions with and with-
ing broken down per home operator.
out roaming for different target websites.
by home and visited country. Similar considerations hold,
with roaming users (where home and visited country differ)
experiencing larger Speed Index.
We then dissect a small set of target websites in Figure 7,
namely YouTube, Google, Wikipedia, and Instagram. The
(c) Boxplot of RUM Speed Index showing the impact of roaming figure shows with violin plots the distribution of Page Load
in specific visited countries (one box per visited country for
Time (Figure 7a) and Speed Index (Figure 7b). The roam-
each home country on the x-axis) compared to operating in the
home country (on the x-axis). ing penalty considerably varies depending on the target
website. For instance, Google performance varies less than
Figure 6: Impact of roaming on QoE metrics. YouTube, with Wikipedia and Instagram lying in the mid-
dle. Moreover, YouTube Speed Index in roaming exceeds
5.8s in 10% of the cases, which is considered the threshold
for a bad score.9
there is a penalty that roaming users suffer, which, in turn,
may reflect into the users’ perceived QoE. It is particularly
interesting as poor QoE is known to damage the business 6.1 Finding most impacting factors
model of big Internet players. Indeed, even small deterio-
To capture how the web browsing QoE metrics correlate
ration of quality levels could result in losses of revenues to
with the characteristics of the target website and with
providers.7 Figure 6a shows the distribution of QoE metrics
other browsing context features (e.g., radio coverage, roam-
separately for roaming and non-roaming users. The curves
ing location), we generate Spearman’s correlation matrix
do not overlap, as, for all websites, metrics have higher
(Figure 8). This allows us to assess whether monotonic
values. Indeed, median values for all increase in the order
relationships (both linear or non-linear) exist between the
of 15 − 20%.8
QoE metrics and the features that we consider. We find
We further break down the measurements by the home that all QoE metrics correlate highly with the Time to First
operator in Figure 6b. The boxplot corresponding to the Byte (TTFB), the average number of images in the target
roaming scenario aggregates all the measurements we col- webpages (images) and the average size of an image on the
lected in the countries where the corresponding SIMs from target webpage (image_size). The total number of objects
the operator (on the x axis) were visiting. We observe (NoObj) and the total webpage size are also important,
that the roaming penalty is present for all operators to a especially for the RUM Speed Index and the page load time.
similar extent. Figure 6c instead illustrates results separately We focus on the RUM Speed Index QoE metric as the
dependable variable and model it as a function of mul-
7. https://www.fastcompany.com/1825005/how-one-second- tiple predictors, including radio signal power, number of
could-cost-amazon-16-billion-sales
8. Notice that we collected these measurements using HTTP/1.1 objects in the target website or the average size of images
uniquely. We found HTTP/2 and QUIC having a negligible impact on
users’ QoE in our previous work [32]. 9. https://web.dev/speed-index/
8
1536-1233 (c) 2021 IEEE. Personal use is permitted, but republication/redistribution requires IEEE permission. See http://www.ieee.org/publications_standards/publications/rights/index.html for more information.
Authorized licensed use limited to: Technische Universitaet Muenchen. Downloaded on February 16,2021 at 10:26:07 UTC from IEEE Xplore. Restrictions apply.
This article has been accepted for publication in a future issue of this journal, but has not been fully edited. Content may change prior to final publication. Citation information: DOI 10.1109/TMC.2021.3058787, IEEE
                                                                                              Transactions on Mobile Computing

                         Figure 8: Spearman’s correlation matrix between QoE metrics (rows) and browsing features (columns).

                                                                                                               interpretability — the collective SHAP values can show
                                                                                                               how much each predictor contributes, either positively or
                                                                                                               negatively, to the target variable, showing the positive or
                                                                                                               negative relationship for each variable with the target. Fur-
                                                                                                               thermore, SHAP also enables us to gain local interpretability
                                                                                                               — each observation gets its own set of SHAP values (see
                                                                                                               the individual SHAP value plot in Figure 9b). This greatly
                                                                                                               increases the model transparency. We can explain why a
                                                                                                               case receives its prediction and the contributions of the
                                                                                                               predictors. Traditional variable importance algorithms only
                                                                                                               show the results across the entire population but not on
                                                                                                               each individual case. The local interpretability enables us
                                                                                                               to pinpoint and contrast the impacts of the factors.
                                                                                                                   We investigate how the variations in the values of the
                                                                                                               different features impact the RUM Speed Index (see Fig-
                                                                                                               ure 9). Similar to the prior observation, we note that the
                                                                                                               TTFB is an important feature whose value highly correlates
                (a) Feature importance                               (b) SHAP Value                            with the QoE metrics of roamers: as the TTFB increases in
                                                                                                               value, so does the SHAP value (Figure 9b). This shows that
         Figure 9: Analysis showing the impact of different features
                                                                                                               the TTFB has a high impact on the roamers’ QoE metrics.
         on the RUM Speed Index. We show (a) The feature impor-
                                                                                                               Using the TTFB as a proxy for the location to which roamers
         tance in the regression model as the average training loss
                                                                                                               travel, we conjecture that, given the prevalence of home
         reduction gained when using a feature for splitting; (b) the
                                                                                                               routed roaming, the distance from the visited location to
         SHAP value variation showing the impact on the model
                                                                                                               the roamers’ home country is an important predictor for
         output of the features we consider.
                                                                                                               the QoE metrics. We further investigate this dependency in
                                                                                                               Section 7.
                                                                                                                   We note that the five most important features that impact
         in the target webpage. We use the xgboost library [13] to                                             the web QoE (see Figure 9b) all stem from the structure
         train a regression model that can predict the SI from the                                             of the target website and the location where the content is
         set of features (i.e., predictors) we built. For the resulting                                        being served to the user. Thus, the number of images in
         prediction model, it is crucial to understand which features                                          the target webpage and javascript elements are among the
         are the ones that impact the most on the end-user QoE. We                                             most important factors that impact the roamer’s experience,
         aim for a model that is interpretable, where interpretability                                         together with the TTFB. Perhaps surprisingly, radio condi-
         means that we can understand how the model uses input                                                 tions that characterize the roamer’s mobile connection are
         features to make predictions. We find that when analyzing                                              far less important than the structure of the target website.
         the feature importance as the average training loss reduction
         gained when using a feature for splitting, the TTFB and the
         average number of images are the two features that bring                                              7     E MULATING DELAY TO MEASURE WEB BROWS -
         the most information about the SI.                                                                    ING   QOE
             To further understand how different target website char-                                          To further study the impact of the extra delay imposed to
         acteristics, together with browsing context features impact                                           roaming users, we perform a large-scale measurement cam-
         the QoE metrics, we use the SHapley Additive exPlana-                                                 paign in which we artificially vary network latency. The goal
         tions (SHAP) value analysis [24]. SHAP is a game-theoretic                                            of these experiments is to study in isolation the impact of the
         approach to explain the output of any machine learning                                                latency on web browsing QoE, overcoming the limitations
         model. SHAP values represent a feature’s responsibility                                               of the experiments with real roaming SIMs, in particular,
         for a change in the model output. SHAP offers global                                                  obvious scalability issues. We automatically download web

                                                                                                           9
 1536-1233 (c) 2021 IEEE. Personal use is permitted, but republication/redistribution requires IEEE permission. See http://www.ieee.org/publications_standards/publications/rights/index.html for more information.
            Authorized licensed use limited to: Technische Universitaet Muenchen. Downloaded on February 16,2021 at 10:26:07 UTC from IEEE Xplore. Restrictions apply.
This article has been accepted for publication in a future issue of this journal, but has not been fully edited. Content may change prior to final publication. Citation information: DOI 10.1109/TMC.2021.3058787, IEEE
                                                                                              Transactions on Mobile Computing

         pages emulating home routing using different RTT curves
                                                                                                                       1.00
         and analyze variations in the classical QoE-related metrics.
              We deploy test machines in the six considered countries                                                  0.75
         and configure proper traffic shaping rules to emulate the

                                                                                                                ECDF
                                                                                                                                                                            Visited -> Visited (EU)
         RTT observed in mobile experiments. To this end, we em-                                                       0.50
                                                                                                                                                                            Roaming -> Home (EU)
         ploy the tc Linux tool that allows sampling packet delay                                                                                                           Roaming -> Visited (EU)
                                                                                                                       0.25
         from a user-defined distribution. We use the RTT samples                                                                                                            Roaming -> Home (US)
                                                                                                                                                                            Roaming -> Visited (US)
         shown in Figure 4 for three scenarios: (i) Visited -> Visited,                                                0.00
         (ii) Roaming -> Home and (iii) Roaming -> Visited. We arti-                                                      −100            0            100          200                300            400
         ficially create two additional RTT distributions, mimicking                                                                                  Relative Increase [%]
         the scenario of a US user roaming in Europe. Given the im-
         possibility of running real roaming experiments in the US,                                                                            (a) Page Load Time
         we employ the RIPE Atlas platform to collect ≈ 40 000 RTT
         samples between two servers located in the Netherlands                                                        1.00
         and 680 RIPE Atlas nodes in the East coast of the US.10
                                                                                                                       0.75
         The resulting distribution is summed with samples of the

                                                                                                                ECDF
         Visited -> Visited distribution to add the typical mobile access                                              0.50
         network latency. We call the obtained distribution Roaming
         -> Home (US), as it approximates the latency experienced by                                                   0.25
         a US user roaming in Europe and accessing US websites.
                                                                                                                       0.00
         Median, 25th and 75th percentiles are respectively 160, 145
                                                                                                                          −100            0            100          200                300            400
         and 175 ms. We then create a second distribution simulating
                                                                                                                                                     Relative Increase [%]
         a US user roaming in Europe and accessing local European
         websites. In this case, packets travel from the EU to the
                                                                                                                                              (b) RUM Speed Index
         US and back to the EU before reaching the server, whose
         response goes back to the US and the EU again. We emulate                                             Figure 10: The relative deviation of objective metrics with
         home-routed roaming by taking samples of EU to US RTT                                                 different emulated RTT profiles. We observe worse perfor-
         twice. We add access network latency as before. We call this                                          mance with profiles with larger RTT.
         distribution Roaming -> Visited (US). Median, 25th and 75th
         percentiles are 265, 245 and 290 ms respectively. Notice that
         in our previous work [35], we propose ERRANT, an open-
                                                                                                               m for profile p from the Visited -> Visited profile as follows:
         source data-driven emulator which can enforce realistic traf-
         fic shaping profiles based on the MONROE measurements.
                                                                                                                                                  medianw,p (m) − medianw,v→v (m)
              We instrument test machines to automatically down-                                                increase(w, p, m) =
         load webpages using the Browsertime tool.11 Given a URL,                                                                                        medianw,v→v (m)
         Browsertime starts the Chrome web browser, downloads the
         webpage, and collects statistics as described in Section 4.2.                                             Figure 10 reports the results, separately for Page Load
         We build on SimilarWeb, a rank service analogous to Alexa                                             Time and SpeedIndex. Focusing on Page Load Time first (Fig-
         to define the list of websites to test.12 Separately by country,                                       ure 10a), we clearly note that, as RTT increases, webpages
         we consider the top-100 ranked websites for six categories                                            tend to be slower, with Page Load Time being, in median,
         (Food, Government, News, Shopping, Travel, and all in all                                             50% higher already with the Roaming -> Home profile. With
         rank), as well as 60 URLs of specific webpages of particular                                           other profiles the situation further worsens, with Roaming
         interest (social networks, search engines, etc.). In total, we                                        -> Visited 80% slower in median. The case of an EU citizen
         download ≈ 2 700 webpages, as the lists partially overlap.                                            traveling the US and accessing local pages ( roaming ->
         Each test machine downloads the whole list, and with all the                                          Visited (US)) is noteworthy, here 170% slower than a non-
         5 RTT profiles. Each experiment is repeated 10 times, and in                                           roaming user. Very similar observations hold for SpeedIndex
         total, we perform 119 786 downloads over one week.                                                    (Figure 10b), with a severe impact on performance of web
              Once experiments are complete, we collect statistics from                                        browsing due to home-routing. Indeed, a Page Load Time
         the test machines, and process data to compute QoE-related                                            larger than 3 seconds makes 53% of users to leave the
         metrics for the different RTT profiles. For each webpage,                                              website according to recent studies [11], while a Speed Index
         we compute the median value when accessed as Visited ->                                               above 5.8 is considered too slow.13 In this scenario, such
         Visited over the 10 repetitions. This represents our baseline,                                        large values are observed in 95% of cases.
         which emulates the condition of a non-roaming user access-                                                In conclusion, our experiments study in isolation the im-
         ing local websites. Then, we compute the median values for                                            pact of extra latency emulating the penalty imposed by HR
         each RTT profile and compare them with the baseline. For                                               in different scenarios. The results show a direct connection
         each webpage w, we compute the relative increase of metric                                            between network delay and slow page load time, which
                                                                                                               leads to a 150% impairment in the case of trans-continental
                                                                                                               roaming.
            10. https://atlas.ripe.net/
            11. https://www.sitespeed.io/documentation/browsertime/
            12. https://www.similarweb.com/                                                                      13. https://web.dev/speed-index/

                                                                                                          10
 1536-1233 (c) 2021 IEEE. Personal use is permitted, but republication/redistribution requires IEEE permission. See http://www.ieee.org/publications_standards/publications/rights/index.html for more information.
            Authorized licensed use limited to: Technische Universitaet Muenchen. Downloaded on February 16,2021 at 10:26:07 UTC from IEEE Xplore. Restrictions apply.
You can also read