Measuring the Facebook Advertising Ecosystem - NDSS Symposium
←
→
Page content transcription
If your browser does not render page correctly, please read the page content below
Measuring the Facebook Advertising Ecosystem

    Athanasios Andreou§ , Márcio Silva¶ , Fabrı́cio Benevenuto¶ , Oana Goga∗ , Patrick Loiseau∗‡ , Alan Mislove†
                                                          § EURECOM,   France
                                                         {andreou}@eurecom.fr
                                                    † Northeastern University, USA

                                                        {amislove@ccs.neu.edu}
                                             ¶ Federal University of Minas Gerais, Brazil

                                             {marcio@facom.ufms, fabricio@dcc.ufmg}.br
                                  ∗ Univ. Grenoble Alpes, CNRS, Inria, Grenoble INP, LIG, France

                                          {oana.goga, patrick.loiseau}@univ-grenoble-alpes.fr
                                 ‡ Max Planck Institute for Software Systems (MPI-SWS), Germany

    Abstract—The Facebook advertising platform has been subject        and more accountable for the ads that circulate on it [13].
to a number of controversies in the past years regarding privacy       However, providing transparency can be tricky for such a
violations, lack of transparency, as well as its capacity to be        complex system. For example, Andreou et al. [22] recently
used by dishonest actors for discrimination or propaganda. In          showed that current transparency mechanisms provided by
this study, we aim to provide a better understanding of the            Facebook that explain why a user has received a particular
Facebook advertising ecosystem, focusing on how it is being
used by advertisers. We first analyze the set of advertisers and
                                                                       ad are incomplete and sometimes misleading. In addition, a
then investigate how those advertisers are targeting users and         new report from Upturn [17] (supported by many privacy
customizing ads via the platform. Our analysis is based on the         advocates) argued that Facebook’s ad transparency efforts are
data we collected from over 600 real-world users via a browser         far from sufficient:
extension that collects the ads our users receive when they browse
their Facebook timeline, as well as the explanations for why users          Facebook’s ad transparency tools do not include
received these ads.                                                         an effective way for the public to make sense of
                                                                            the millions of ads running on its platform at any
    Our results reveal that users are targeted by a wide range of
advertisers (e.g., from popular to niche advertisers); that a non-          given time ... [We recommend to] provide a strong
negligible fraction of advertisers are part of potentially sensitive        baseline of access to all ads, not just those identified
categories such as news and politics, health or religion; that a            as political in nature ... [and] disclose data about
significant number of advertisers employ targeting strategies that          ads’ reach, type, and audience—especially for ads
could be either invasive or opaque; and that many advertisers               that implicate important rights and public policies.
use a variety of targeting parameters and ad texts. Overall, our
work emphasizes the need for better mechanisms to audit ads            So, despite Facebook’s efforts to provide transparency, little is
and advertisers in social media and provides an overview of the        known about the ads inside the platform and how the various
platform usage that can help move towards such mechanisms.             targeting features of the platform are used by advertisers.

                       I.   I NTRODUCTION                                  There exist two primary characteristics of Facebook’s ad-
                                                                       vertising platform that make transparency both more crucial
    The Facebook advertising platform has been the source of           and more complex at the same time. First, every user with
a number of controversies in recent years regarding privacy            a Facebook account can become an advertiser in a matter of
violations [31], [40], lack of transparency on how it provides         minutes with five clicks on Facebook’s website; there is no
information to users about the ads they see [22], and lately,          verification required to become an advertiser, and no need to
Facebook’s ability to be used by dishonest actors for discrim-         provide an identity card or proof of a legitimate registered
inatory advertising [9], [16], [38] or ad-driven propaganda to         business. Second, the platform provides advertisers with a
influence elections [19]. For example, Propublica demonstrated         wide range of ways to target users. For example, advertisers
how Facebook allowed advertisers to reach users associated             are able to target users that satisfy precise combinations of
with the topic of ‘Jew Haters’ [9], and also allowed advertisers       attributes—based on a list of over 200,000 attributes provided
to exclude people from ads about employment based on their             by Facebook—resulting in complex targeting formulas such
age [16].                                                              as “interested in tennis and having very liberal convictions but
                                                                       not living in ZIP code 02115” [5]. Alternatively, advertisers
    This situation has led many governments and privacy advo-
                                                                       can target specific users if they know information such as the
cates to push Facebook to make its platform more transparent
                                                                       user’s email address or phone number (referred to as Personally
                                                                       Identifiable Information or PII; see Section II for more details).
                                                                       We do not aim to debate whether such targeting strategies
Network and Distributed Systems Security (NDSS) Symposium 2019         should be allowed in the first place, but we do believe that in
24-27 February 2019, San Diego, CA, USA
ISBN 1-891562-55-X                                                     order to design better transparency mechanisms, it is necessary
https://dx.doi.org/10.14722/ndss.2019.23280                            to have an understanding of how they are being used by
www.ndss-symposium.org                                                 advertisers.
In this paper, we provide a detailed look at how the               of targeting strategies (20%) are either potentially invasive
Facebook advertising ecosystem is being used. To do so, we              (e.g., make use of PII or attributes from third-party data
first study Who are the advertisers? (Section IV) and then              brokers to target users), or are opaque (e.g., use the Lookalike
How are the advertisers using the platform? (Section V). We             audiences feature that lets Facebook decide to whom to send
investigate topics such as the most common targeting strategies         the ad based on a proprietary algorithm). This represents a shift
advertisers use, the users who advertisers target the most, and         from more traditional targeting strategies based on location,
how advertisers tailor their ads to specific users. To do so, we        behavior, or re-targeting. Finally, most advertisers (65%) target
analyze data from 622 real-world Facebook users, based on               users with one single ad, and only a small fraction (3%) target
two versions of AdAnalyst [4]. In brief, AdAnalyst is a browser         users persistently over long periods of time.
extension that we developed to collect the ads users receive
when they browse their Facebook timeline, as well as the cor-           (2) Users who advertisers target: A significant fraction of
responding explanations Facebook provides about the reasons             advertisers (24%) use multiple attributes to target users, with
they have been targeted with each particular ad. In total, we           some using as many as 105 attributes! While in most cases
analyze data about 89K/146K ads and 22K/28K advertisers                 the targeting attributes are in accordance with the business
(see Section III). While our data is unique and provides a              domain of the advertiser, we do find cases of questionable
new perspective on the Facebook advertising ecosystem, it               targeting even from large companies, which emphasizes the
does have biases due to the way we disseminate AdAnalyst,               need for more visibility and accountability in what type of
and limitations due to the incompleteness of ad explanations            users advertisers target.
provided by Facebook. We provide precise descriptions of how            (3) How advertisers tailor their ads: A surprisingly large
these limitations impact the results and findings throughout the        number of advertisers change the content of their ads either
paper.                                                                  across users (79%1 ), across targeting attributes (65%1 ), or
    Our work is the first study of ads and advertisers in Face-         across time (86%1 ). While this practice is not inherently
book at a moderate scale. While there have been many studies            malicious, it requires close monitoring as it could open the
about online ad targeting [25], [27], [30], [33]–[36], [42], none       door to manipulation via micro-targeting.
focused extensively on social media advertising on Facebook.
This is important because Facebook has the highest ad volume                Overall, our analysis points to the fact that users receive ads
amongst social media platforms and it offers a wider range              that often come from potentially sensitive advertiser categories,
of data and targeting mechanisms than traditional advertising.          that are targeted using invasive strategies, and whose quality
Facebook is also often a pioneer in introducing new targeting           is difficult to assess. Our work emphasizes the need for
mechanisms such as PII-based targeting (see Section II). Addi-          better mechanisms to audit ads and advertisers, to increase
tionally, our study differs from previous works in several other        transparency, and to protect users from dishonest practices. In
ways. First, we analyze the ad targeting strategies of a large          particular, we find a significant fraction of Lookalike audience
number of advertisers on Facebook. Related work on Facebook             targeting, for which current transparency mechanisms are
[22] has focused on explanations of ad targeting, but it only           unsatisfactory; our work therefore points to the necessity of
performed controlled experiments to evaluate the transparency           finding appropriate transparency mechanisms for this targeting.
mechanisms Facebook provides. We use their results as a basis           Similarly, we find that 79% of users have received an ad using
to interpret the large-scale datasets of ads and explanations we        PII-based targeting, pointing to the need to find ways of better
collect. Second, we analyze ads collected from real-world users         explaining how advertisers received this information in the first
in contrast to the more traditional techniques for collecting           place [41]. We also find that many advertisers run multiple
ads by creating fake personas and visiting a predefined set             campaigns with various targeting strategies and/or various ads;
of websites to collect the corresponding ads [25]. We believe           this points to the necessity of adopting a global approach
our study offers a unique view of the Facebook advertising              towards transparency that does not look at ads in isolation.
ecosystem that will be very useful for subsequent efforts to
increase its transparency.                                                  As a step forward, our AdAnalyst browser extension
                                                                        provides users with aggregate statistics about who are the
    Our analysis in Section IV of the set of advertisers on             advertisers that target them, and what are the properties of
Facebook reveals that the ecosystem is broad and complex.               other users that were targeted by the same advertisers, which
There exist advertisers that are well-known and popular (i.e.,          we hope will help users protect themselves from dishonest
having more than 100K Likes, covering 32% of all advertisers)           practices and gain a better understanding of the ads they
amongst which over 73% have a verified account. At the                  receive. The AdAnalyst extension can be downloaded and run
same time, there exist many advertisers that are niche (i.e.,           from the URL below:
have less than 1K Likes, covering 16% of all advertisers) and
whose trustworthiness is difficult to manually/visually assess                                https://adanalyst.mpi-sws.org
(e.g., less than 7% of them are verified). We also see that a
non-negligible fraction of advertisers are part of potentially
sensitive categories such as News and Politics, Education,                                          II.   BACKGROUND
Business and Finance, Medical, Legal and Religion.
                                                                            In this section we take a quick look at how one can adver-
    Our analysis in Section V of how the advertisers are using          tise on Facebook and the transparency mechanisms Facebook
the platform reveals that:                                              provides to users.

(1) Targeting strategies advertisers use: A significant fraction           1 Out   of the relevant set of advertisers.

                                                                    2
A. Advertising in Facebook information based on your Facebook profile and
where you’ve connected to the internet.
Becoming a Facebook advertiser is a simple process: to
sign up, one only needs a (personal) Facebook account and These explanations provide insight into how a user was
a payment method (e.g., a credit card). In a few clicks, any targeted. Prior work [22] demonstrated that some explanations
user can become an advertiser by simply clicking on “Create are more informative than others, depending on the way a user
Ads” from dropdown menu. To place an ad, advertisers need was targeted (see more details in Section III-B).
to create a targeting audience where they specify the users
they want to target, choose some optimization criteria, upload Another transparency mechanism that Facebook offers is
their ad’s text and image, and place a bid [3]. the Ad Preferences page [3]. There, users can see (some of)
the attributes that Facebook has inferred about them [22].
To create a targeting audience, Facebook provides prospec-
tive advertisers with a plethora of options. First, advertisers
can target users based on their age, gender, location, and the III. DATASET
language they speak. Second, advertisers can target users based
on combinations of attributes representing the characteristics In this paper, we use a dataset collected with the help of
they want users who receive their ads to have (e.g. users inter- AdAnalyst [4]. AdAnalyst is a browser extension available
ested in both table tennis and pizza). Targeting attributes are for Chrome and Firefox that collects three main types of
grouped into high-level categories of demographics, behaviors, information as users browse Facebook: (1) the ads users
and interests [22]. Interests can either be predefined (where the receive when they browse their Facebook timeline; (2) the
advertisers can browse in a tree structure of attributes in order ad explanations provided by Facebook on why they receive a
to target users) or free-text (where the advertisers can type particular ad, and (3) the Ad Preferences pages of the users. We
something they believe is related with their desired targeting deployed AdAnalyst in two different instances; one for broader
and browse to related attributes). worldwide audiences, and one with a focus on Brazilian users.
The Brazilian instance was disseminated as part of a project2
Third, advertisers can target users via Custom audiences, to provide transparency about political campaigns in the 2018
where the advertiser selects specific users. Advertisers can do Brazilian elections.
so by uploading a list of various types of personally identifiable
information (PII), including email addresses, phone numbers, In this study, we look at data collected from both versions
physical addresses, names, and dates of birth. They can also of AdAnalyst. We call the dataset obtained by the version for
create Custom audiences by selecting users who have visited broader audiences DATA -W ORLDWIDE, and the data obtained
their third-party website, installed their mobile application, or from the version focused on Brazilian users DATA -B RAZIL.
‘Liked’ their Facebook Page. Fourth, advertisers can target When we do not mention results from DATA -B RAZIL or
users via Lookalike audiences. In brief, advertisers can start combined results explicitly, we will be referring to results from
with a Custom audience and ask Facebook to identify other DATA -W ORLDWIDE.
Facebook users who are similar to (‘lookalike’) users in the We only use data from users that installed AdAnalyst for
source audience. Facebook does not precisely define how it more than one day. In total, we have 114 users in DATA -
measures similarity, or disclose its algorithm for selecting W ORLDWIDE and 508 in DATA -B RAZIL. DATA -W ORLDWIDE
users. includes data that have been collected over a period of one year
Advertisers can also combine different targeting options and four months, while DATA -B RAZIL over a period of five
together, such as first targeting using a Custom audience months. The median number of days for which we have data
and then further targeting using age, gender and targeting for a user is 35 (29 in DATA -B RAZIL). Next, we provide more
attributes [14]. details about the data we collect and how we collect it.
B. Facebook’s transparency mechanisms A. Data collection
Facebook provides explanations to users about why they
Ads: In order to capture the ads that users receive on Facebook,
have received a specific ad, we call these ad explanations. To
AdAnalyst inspects the DOM on Facebook pages for the tag
obtain such explanations users need to click on the “Why am
“Sponsored”. This tag is used by Facebook to help users
I seeing this?” button that is in the upper right corner of every
distinguish sponsored content (i.e., ads) from the other posts in
ad. Ad explanations are usually structured in two parts. The
their Facebook feed. Ads appear either as Facebook posts (i.e.,
fist part reveals a part of the targeting and looks like:
front ads), or appear on the right side of the screen (i.e., side
One reason you’re seeing this ad is that [advertiser] ads). We capture the media content of the ad, the text of the ad,
wants to reach people interested in [attribute], based and the identity of the advertiser. AdAnalyst does not collect
on activity such as liking Pages or clicking on ads. video ads that appear when a user is watching a video on
Facebook. Ads are accompanied by an ad id, which we can use
The second part of an explanation reveals attributes that to identify unique ads. In total, we have collected 88.6K unique
might have been potentially used by an advertiser: ads in DATA -W ORLDWIDE and 145.8K in DATA -B RAZIL. The
median number of unique ads received by a user daily is 11.1
There may be other reasons you’re seeing this ad, (11.5 in DATA -B RAZIL).
including that [advertiser] wants to reach people
ages [age range] who live in [location]. This is 2 www.eleicoes-sem-fake.dcc.ufmg.br
3TABLE I. G EOGRAPHICAL DISTRIBUTION OF THE DATASETS . TABLE II. C OMPARISON OF AGE , GENDER , BASIC EDUCATION
DISTRIBUTION IN DATA -W ORLDWIDE , DATA -B RAZIL AND FACEBOOK
W ORLDWIDE B RAZIL GLOBAL POPULATION .
Location Users Ads Adv. Users Ads Adv.
Europe 85 71K 19K 7 5K 2K DATA - DATA -
South America 1 296 130 495 137K 25K Facebook W ORLDWIDE B RAZIL
North America 16 8K 2K 5 4K 2K 13-17 6.9% 0.0% 1.8%
Rest 12 10K 2K 0 0 0 18-21 16.5% 1.8% 7.1%
France 50 23 8K 1 43 36 22-30 32.5% 47.4% 38.0%
Germany 16 46K 12K 1 2K 785 31-40 21.2% 25.4% 26.6%
Brazil 1 296 130 495 137K 25K 41-50 11.3% 7.0% 6.9%
United States 16 8K 2K 3 3K 1K 51-60 6.5% 1.8% 2.2%
Total 114 89K 22K 508 146K 28K 61-65+ 5.2% 0.0% 0.6%
Not inferred 0.0% 16.7% 16.9%
Men 57.0% 68.4% 74.4%
Women 43.0% 25.4% 19.3%
Ad explanations: By simulating the click on the “Why am I Not inferred 0.0% 6.1% 6.3%
seeing this” button of each ad, AdAnalyst collects the explana- No University 14.8% 2.6% 7.7%
tion that the user can see regarding the respective ad. Facebook University 35.9% 71.1% 73.4%
imposes very strict and opaque rate limits with respect to the Unspecified 49.3% 26.3% 18.9%
maximum number of explanations we can retrieve. These rate
limits present an accessibility obstacle to users, and conse-
quently also to AdAnalyst. Thus, we developed a scheduling and one that comes from the way Facebook provides ad
mechanism where we collect all the HTTP requests that can explanations.
be used to retrieve explanations and get only 10 explanations
per hour. Additionally, we do not collect an explanation for
Representativeness and bias: Representativeness is an im-
an ad if we have already collected the explanation for the
portant but challenging issue in any empirical study such as
same ad for the same user within the previous two days. Our
ours. We designed a methodology to gather Facebook ads that
methodology achieves the collection of explanations for most
is as thorough as possible, given our practical constraints. We
ads, but does not ensure the collection of every explanation. In
used two different strategies to disseminate AdAnalyst. The
total, we collected 84.2K unique ads with their explanations
first consisted of disseminating it in our social and family
(129.1K for DATA -B RAZIL). We did not manage to collect
circles as well as in the conferences we attended. For this
explanations for 4.4K ads (16.7K for DATA -B RAZIL).
version, users had to set their Facebook language to English
We parse these explanations to retrieve information on the or French. The second dissemination strategy consisted of
types of targeting that were used, and the targeting attributes providing AdAnalyst as part of a system focused on bringing
that are mentioned. For each targeting attribute, we also obtain transparency to the Brazilian 2018 elections, in a version that
its audience size (e.g., the number of Facebook users that sat- also works in Portuguese. In order to inspect possible biases in
isfy the attribute) from the Facebook Advertising Interface [8]. our dataset, we leverage information that we can infer about the
users in our dataset from their ad explanations (i.e., their age
Ad Preferences: For each user, AdAnalyst collects the in- group, gender and location), and Ads Preferences page (i.e.,
formation found in their respective Ad Preferences pages their interest-, behavior- and demographic-based attributes),
periodically. From there, we have collected information about and compare them with the global Facebook population. To
all the attributes that Facebook has inferred about users. In estimate the fraction of users in the global Facebook population
total, we collected 17.1K distinct interests, behaviors and with a certain demographic or interest we use the Facebook
demographics (38.2K for DATA -B RAZIL) from all users. The Ads Interface [8] and query for monthly active users that
median number of attributes that Facebook has inferred for a satisfy the respective criteria worldwide as well as in Brazil,
user is 310 (615 for DATA -B RAZIL) Europe and North America.3
Advertisers: From all the ads we collected in our dataset, we The geographical distribution of our datasets across conti-
extracted 22K unique advertisers (28K for DATA -B RAZIL). In nents and some selected countries is depicted in Table I. We
order to be able to advertise on Facebook, advertisers currently see that, while we do not cover the world representatively, we
need to create a Facebook Page, while this was not the case do observe some geographical diversity in particular thanks to
in the past. In total, 99.4% of our advertisers have a Facebook the combination of the DATA -W ORLDWIDE and the DATA -
Page (100% for DATA -B RAZIL). B RAZIL dataset. Table II compares the age, gender and edu-
cation level of users in our datasets and the Facebook global
The Facebook Pages can provide information about adver- population. We see that our dataset is biased towards: young
tisers. From these pages, we collect the categories that the ages, with 47.4% of the users being between 22-30 years old–
advertiser belongs to, the number of people who have ‘Liked’ compared to 32.5% in the Facebook global population4 ; men,
the Page, and the verification badge (i.e., if the advertiser is with 68.4% of the users being male–compared to 57% in
verified by Facebook). the Facebook global population; and educated users, 71.1%
3 In the query we optimize for reach and leave the default “automatic
B. Data limitations
placements” option selected, which includes users in the whole Facebook
There are two sources of biases and limitations in our network (e.g., Instagram, mobile users, messenger, and audience network).
dataset, one that comes from users that installed AdAnalyst 4 Given that we could not infer the age group for 16.7% of our users.
4TABLE III. ATTRIBUTES WHOSE FREQUENCY IN OUR DATASET (D)
PER REGION DIFFERS THE MOST FROM THE RESPECTIVE FACEBOOK ’ S
ATTRIBUTE FREQUENCY (F).
Attribute F D
Frequent Travelers 15% 67%
DATA - Uses a mobile device (25 22% 68%
W ORLDWIDE months+)
Europe Frequent intern. travelers 4% 46%
Close friends of expats 22% 64%
Gmail users 18% 58%
Frequent Travelers 24% 81%
(a) DATA -W ORLDWIDE. (b) DATA -B RAZIL. DATA - Close friends of expats 19% 56%
W ORLDWIDE Online advertising 2% 38%
Fig. 1. Scatterplot for the distribution of attributes for DATA -W ORLDWIDE
and Facebook’s worldwide population, and DATA -B RAZIL (only brazilian North America Frequent intern. travelers 2% 38%
users) and Facebook’s Brazilian population. Facebook Page admins 22% 56%
People who prefer high- 6% 58%
DATA - value goods in India
W ORLDWIDE First-person shooter game 15% 67%
of users have indicated tertiary education in their profile–
compared to 35.9% in the Facebook global population. Overall, Rest of world Engineering 9% 58%
People who prefer mid and 10% 58%
we observe that the biases seem closely related to our dissemi-
high-value goods in India
nation strategies and often transcend geographical boundaries. Action movies 13% 58%
We then investigate the biases in our dataset by looking Science 27% 77%
DATA - People who prefer high- 13% 63%
at the fraction of users in our datasets for which Facebook B RAZIL value goods in Brazil
has inferred an attribute and compare it with the fraction Brazil Books 34% 80%
in the Facebook population. Figure 1 presents the compar- Engineering 13% 54%
ison for 451 predefined attributes5 comparing all users in Facebook Page admins 21% 60%
DATA -W ORLDWIDE with the Facebook’s population world-
wide and the 495 Brazilian users from DATA -B RAZIL with
the Facebook’s population in Brazil. The scatter plot shows
that there is a correlation between the representation of most
attributes in the Facebook population and in our datasets data allows us to assess the extent to which some of our
(worldwide population vs. DATA -W ORLDWIDE and Brazilian observations are robust across regions.
population vs. DATA -B RAZIL) with the Pearson’s correlation
coefficient being 0.86 for DATA -W ORLDWIDE and 0.87 for Limitations on ad explanations: Andreou et al. [22] showed
DATA -B RAZIL. We also see that many attributes seem to be that ad explanations are incomplete: each explanation shows
over-represented in our dataset, especially in the case of DATA - at most one targeting attribute (plus age/gender/location infor-
B RAZIL. This is probably due to the fact that users in our mation) regardless of how many attributes the advertisers use.
datasets have, on average, more attributes than Facebook users This means that explanations reveal only part of the targeting
in general. Our estimated average number of attributes (out of attributes that were used, providing us—and the users—with an
those examined) per user in Facebook worldwide is 40 (44 incomplete picture of the attributes that advertisers were using.
in Brazil), while the average number of attributes per user in However, in the same study, authors performed a number
DATA -W ORLDWIDE is 54, and in DATA -B RAZIL is 75. of controlled experiments that suggest—but not conclusively
prove—that there is a logic behind which attributes appear in
To investigate in which aspects our dataset is most biased, an explanation and which do not. Given a targeting audience
Table III shows for each selected geographical region the A obtained from two attributes a1 ∧a2 , if a1 and a2 come from
attributes that have the biggest absolute difference in repre- different high-level attribute categories (e.g., Demographic,
sentation between our datasets and Facebook’s population in Behavior, or Interest), the attribute shown follows a specific
these regions. We observe that users in Europe, and North precedence (Demographics or Age/Gender/Location > Inter-
America, which belong to DATA -W ORLDWIDE, are far more ests > PII-based > Behaviors). If a1 and a2 come from the
likely to be Frequent Travelers, Frequent international trav- same attribute category, the one that appears in the explanation
elers or Close friends of expats than the general Facebook is the one with the highest estimated audience size. These
population in these regions. DATA -B RAZIL is more biased observations allow us estimate whether our results about a
towards attributes that might be hinting towards more affluent specific targeting type are underestimated or not. We will detail
and educated individuals (e.g., People who prefer high-value how this limitation impacts the results throughout the paper.
goods in Brazil, Science, Books, and Engineering).
Overall, we believe that we collected a sufficient amount TABLE V. F RACTIONS OF ADVERTISERS THAT ARE VERIFIED (B LUE =
of ads from a sufficient amount of advertisers to draw valuable BLUE BADGE , G RAY = GRAY BADGE ).
conclusions. In addition, the geographical diversity of our Dataset Niche Ordinary Popular
DATA - Blue:0.2% Blue: 10.3% Blue:66.9%
5 We use all Facebook predefined attributes that are leaves in the Facebook W ORLDWIDE Gray:6.4% Gray:12.6% Gray:6.1%
attribute hierarchy, do not have a time duration smaller than 6 months DATA -B RAZIL Blue:0.0% Blue: 5.2% Blue:53.9%
(e.g., Newlywed (3 months)), and cannot be used by advertisers to exclude Gray:2.6% Gray:12.4% Gray:11.7%
audiences.
5TABLE IV. M OST POPULAR FACEBOOK ADVERTISER CATEGORIES .
Categories
DATA -W ORLDWIDE Product/Service (7.0%), Community (5.1%), Website (4.3%), Company (4.2%), Food & Beverage Company (4.1%), Clothing (Brand) (4.0%),
Media/News Company (3.2%), Health/Beauty (2.5%), Nonprofit Organization (2.4%), Retail Company (2.3%), Musician/Band (2.1%), Internet
Company (1.9%), Shopping & Retail (1.8%), Education (1.6%), News & Media Website (1.5%), Brand (1.5%), Business Service (1.4%),
Organization (1.4%), Travel Company (1.4%), College & University (1.3%)
DATA -B RAZIL Musician/Band (5.0%), Product/Service (4.8%), Community (3.8%), Education (3.8%), Company (3.6%), Website (2.6%), Clothing (Brand) (2.6%),
Public Figure (2.5%), Media/News Company (2.5%), School (2.2%), Food & Beverage Company (2.1%), Nonprofit Organization (2.1%), Retail
Company (2.1%), Shopping & Retail (1.8%), Health/Beauty (1.8%), College & University (1.8%), Arts & Entertainment (1.8%), Organization
(1.7%), Artist (1.5%), News & Media Website (1.2%)
C. Ethical considerations collected come from popular, 32% from ordinary and 5% from
niche advertisers (61%; 35%; 4% for DATA -B RAZIL).
It is important to mention that the code of our developed
browser plugins is open source as they can be viewed in the 2) Verification: There exists two types of verification
client’s machine, as any Chrome and Firefox extension. We badges: one blue and one gray. Blue badges are for profiles
only collect information about the ads and clearly state what of public interest figures, and require a copy of an official
we collect to the volunteers who install the extensions and government-issued photo identification such as a passport.
accept our terms. All data collection that we present in this Gray badges are for businesses and require a publicly listed
paper was reviewed and approved by the Ethical Review Board phone number, or a document like phone bill that is associated
of the University of Saarland and by the Institutional Review with the business.
Board of Northeastern University. Due to IRB restrictions, and
in order to minimize any risk of exposure of users’ sensitive Table V shows the fraction of verified advertisers for
information, we will not share our data or make them publicly niche, ordinary and popular advertisers. In both datasets niche
available. advertisers tend to be less frequently verified (0.2% for blue
and 6.4% for gray verification) compared to ordinary (10.3%
and 12.6%) and popular advertisers (66.9% and 6.1%). In total,
IV. W HO ARE THE ADVERTISERS ?
only 26.6% of advertisers have a blue badge and 9.6% a gray
In order to investigate how the platform is being used we one; our data shows that a large fraction (38.9%) of ads come
first need to be able to characterize the different advertisers from advertisers that are not verified.
that use the platform. We briefly look at the advertisers from
two different perspectives, (i) their identity; and (ii) their B. Advertisers’ categories
categories.
When advertisers on Facebook create a Page, they can self-
A. Advertisers’ identity report one or more categories that correspond to their business.
Advertisers can either choose from a predefined list of 1,543
Because advertising platforms have been the vectors for different categories (organized in a hierarchical tree with a
privacy violations [31], [40], discriminatory advertising [9], maximum depth of 6) or input a free-text category.
[16], [38], and ad-driven propaganda [19], we begin by ex-
amining who the set of advertisers are and what features they We observe 943 unique categories in our dataset (968 in
have that might indicate their trustworthiness. Estimating the DATA -B RAZIL). Table IV presents the 20 most common cate-
trustworthiness of an advertiser, however, is a difficult task. gories among advertisers (they appear in 51.4% of advertisers
Facebook offers a platform where anyone with a Facebook in our dataset).
account can be an advertiser without going through any Many advertisers only report a general category such
verification process. This means that the platform is open as Website, Company, or Product/Service which are not
to both popular and well-known advertisers as well as niche particularly informative about the sector in which the advertiser
ones. Additionally, Facebook offers a verification mechanism works, while others report very fine-grained categories such
where anyone who wishes can acquire a verified badge [21]. as Evangelical Church, or Aquarium, or Opera House.
While popular or verified advertisers are not guaranteed to be To be able to analyze which sectors advertisers come from
trustworthy, we consider the fact that they are more exposed to and to have more homogeneous categories for all, we map
public scrutiny than the rest as an indication of their potential advertisers6 in our dataset to categories in the Interactive
trustworthiness. Advertising Bureau (IAB) taxonomy [15]. This taxonomy
1) Popularity: We consider the number of Likes that ad- provides categories for advertising purposes and is a de-facto
vertisers have received on their Facebook Pages as a measure standard in advertising. It is composed of 29 Tier-1 categories
of their popularity; we bin advertisers in three different cate- such as News and Politics or Education. For the Facebook
gories: (1) niche, with 1K Likes or less, (2) ordinary, with categories Public Figure, Community Organization, Non-
between 1K and 100K Likes, and (3) popular, with over Business Places there is no suitable existing IAB category,
100K Likes. so we create a new category. Also, since IAB does not have
a Tier-1 categories for all businesses we observe, we created
Niche advertisers constitute 16% of the Facebook adver- Legal, Other Media, and Entertainment categories as well.
tisers in our dataset, ordinary 52%, and popular 32% (15%; For advertisers with only coarse-grained categories such as
61%; 24% for DATA -B RAZIL). While there are more ordinary
advertisers than popular in both data sets, popular advertisers 6 You can view the exact mapping we use at https://www.eurecom.fr/
place a larger number of ads: 63% of all unique ads we ∼andreou/data/ndss2019.html.
6TABLE VI. P OPULAR AND SENSITIVE ( IN BOLD ) IAB ADVERTISER TABLE VII. P OPULAR AND SENSITIVE ( IN BOLD ) IAB ADVERTISER
CATEGORIES FOR DATA -W ORLDWIDE . CATEGORIES FOR DATA -B RAZIL .
IAB Tier-1 category Advertisers Ads IAB Tier-1 category Advertisers Ads
Food and Drink 9.3% 6.4% Education 10.2% 10.9%
Style & Fashion 8.5% 5.8% Food and Drink 8.1% 6.3%
Technology and Computing 8.4% 9.7% Music and Audio 7.6% 3.2%
Community Organization 8.2% 5.0% Community Organization 6.8% 4.7%
Shopping 6.7% 5.2% Technology and Computing 6.8% 7.9%
News and Politics 5.5% 8.6% Shopping 6.8% 6.6%
Travel 4.6% 2.9% Style & Fashion 5.9% 4.9%
Education 4.4% 5.8% News and Politics 5.8% 6.8%
Healthy Living 4.2% 2.5% Public Figure 5.1% 3.9%
Home & Garden 3.6% 2.2% Entertainment 3.6% 3.1%
Business and Finance 2.0% 2.2% Medical Health 2.3% 1.0%
Medical Health 1.2% 0.6% Business and Finance 1.6% 2.5%
Legal 0.2% 0.1% Legal 0.4% 0.2%
Religion and Spirituality 0.1% 0.0% Religion and Spirituality 0.3% 0.1%
Company or Website we do not assign to them any IAB V. H OW ARE THE ADVERTISERS TARGETING USERS ?
category. In total we manage to map 83% advertisers to a IAB For the different types of advertisers identified in Section
category (86.1% for DATA -B RAZIL). IV, we analyze (1) how they target users; (2) which users they
Advertisers from some categories have the potential to target; and (3) how they customize their ads.
influence users’ decisions on important personal and societal
issues. For example, political advertisers could influence how A. Analysis of targeting strategies
users vote, and medical advertisers could affect an individual’s
decisions about treatment. We consider News and Politics, 1) Breakdown of targeting types: Advertisers on Facebook
Education, Medical Health, Legal, Religion and Spiritual- can choose from a wide range of ways to reach users – see
ity, and Business and Finance categories as sensitive. While Section II for more details. To analyze the different ways
we do not claim that advertisers from sensitive domains should advertisers reach people, we mine the ad explanations provided
not send ads, we aim to pay specific attention in our analysis by Facebook using the “Why am I seeing this?” feature [22].
to such categories. Facebook ad explanations, despite their limitations, reveal part
of the advertisers’ targeting (see Section III-B); using the
Tables VI and VII present the top 10 IAB categories and results of prior work [22], we can draw useful conclusions.
the respective percentage of advertisers and ads that appear in
By looking at the patterns of ad explanations as well
our datasets. The tables also show (in the bottom) sensitive
as information in the Facebook Advertising Interface, we
categories such as Legal that are not part of the top 10. The
have group the individual targeting mechanisms discussed in
tables show that 7 out of the top 10 IAB categories are the
Section II into several broad targeting types:
same in the two datasets. Besides, there is a significant number
of advertisers and ads that come from potentially sensitive
categories such as News and Politics (8.6%) or Education. Age/Gender/Location – when advertisers target users based on
Finally, the four sensitive categories Business and Finance, their age, gender, and location.
Medical Health, Legal, and Religion and Spirituality each Attribute-based – when advertisers target users that satisfy a
constitute a minority of ads but add up to 3-4% of the ads, precise list of targeting attributes. We split this in 5 subcate-
which (given that each user receives a median of 11.1 ads per gories based on the source of data: Behaviors, Demographics
day) still represents up to 3 ads per week. and Interests, which corresponds to attributes inferred by
Facebook from the user’s activities on the platform; Data bro-
kers [20], which corresponds to targeting based on attributes
C. Takeaways inferred by external data brokers and not by Facebook7 ; and
Profile data, which corresponds to information users provided
The ecosystem of advertisers in Facebook is broad and in their Facebook profiles such as marital status, employer, or
complex. There exists advertisers who are popular, verified, university attended.
and more likely to be trustworthy. On the other side, there
exist many niche and unverified advertisers for which it is PII-based – when advertisers target their ads via Custom
difficult to estimate the trustworthiness without manual effort. Audiences that consist of lists of PII including emails or postal
We also see that a non-negligible fraction of advertisers are addresses.
part of potentially sensitive categories such as politics, finance, Retargeting – when advertisers target users who already inter-
health, legal and religion (adding up to ∼10%). Taken together, acted with their business such as users that visited their page,
our analysis points to the fact that users receive ads from or used their mobile app.
advertisers that might concern sensitive information and whose
quality is difficult to assess, making it even more important to 7 The data brokers that have partnered with Facebook in Europe, US, and
investigate how such advertisers are using the system. Brazil are Acxiom [2], Epsilon [6], Experian [7] and Oracle Data Cloud [18]
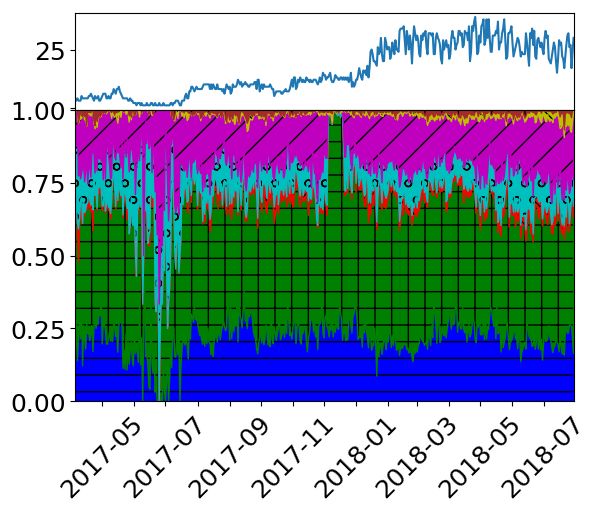
7(a) DATA -W ORLDWIDE. (b) DATA -B RAZIL. (c) Labels.
Fig. 2. Breakdown of targeting types across time with respect to the number of ads (across all users). Above: daily number of active users.
TABLE VIII. B REAKDOWN OF TARGETING TYPES WITH THE
RESPECTIVE FRACTION OF ADS , ADVERTISERS , AND USERS WHO WERE
Impact of biases and limitations in the dataset: In the
TARGETED . T HE LAST COLUMN PRESENTS THE ATTRIBUTE PRECEDENCE fifth column of Table VIII we show the precedence of each
(1 IS HIGHEST PRECEDENCE ; 5 IS LOWEST PRECEDENCE ; UNK . IS NOT targeting types according to prior work [22]. In case of multi-
KNOWN ). type/multi-attribute targeting (e.g., advertisers that use both
Ads Advs. Users Prec. PII-based and attribute-based targeting at the same time),
Age/Gender/Location 19% 32% 95% 1 Facebook only shows one reason in the corresponding ex-
Behaviors 1% 1% 7% 4 planations (see Section III). The way Facebook selects the
Demographics 1% 1% 5% 1 reason shown impacts the frequencies reported in the table.
Interests 39% 52% 96% 2 According to [22] the multi-type targeting precedence is:
Profile Data 5% 7% 84% unk. Demographics & Age/Gender/Location > Interests > PII-
Data Brokers 1% 2% 45% unk. based > Behaviors. All targeting types with a precedence other
PII-based 3% 2% 79% 3 than 1 are therefore possibly underestimated. We do not know
Retargeting 12% 10% 92% unk.
how often advertisers are using multi-type targeting, so we
Lookalike Audiences 17% 16% 95% unk.
Location-based 2% 5% 64% unk. cannot estimate the degree of underestimation.
Social Neighborhood 2% 5% 60% unk. We acknowledge that some of the biases of our population
(see Section III-B) might affect the proportions, especially for
some types like Lookalike audiences and Retargeting which
Lookalike audiences – when advertisers let Facebook choose might depend heavily on the activity of a user. However, the
their audience based on past results and the characteristics of fact that there are no large fluctuations, and in general the
previous audiences. proportion of each type does not change significantly over time
or across datasets gives us confidence that the numbers we see
Location-based – when advertisers target users who were at in this section are not overly biased by the population in our
or passed by a precise GPS location. datasets.
Social neighborhood – when advertisers target users whose
friends liked their Facebook page. Looking at more detail at Table VIII we can observe that:
Figures 2a and 2b present a timeline of daily frequency (1) Age/Gender/Location (19% of ads) and Attribute-based
of each targeting type with respect to the total number of (47% of ads, with Interests taking the biggest share at 39%)
ads we collected each day (accompanied by the respective are the most prevalent targeting types. These targeting types
daily number of active users). In general, the proportion of are the two most traditional ways of targeting users online.
each targeting type does not change substancially over time or (2) A substancial fraction (17%) of ads are targeted us-
over dataset and is fairly consistent across our two data sets.8 ing Lookalike audiences. This is a newer targeting strategy
Table VIII shows the overall frequency of each targeting type employed by social media advertising platforms that allows
with regard to the number of ads that have been targeted and advertisers to ask Facebook to choose who to send the ad to
fraction of advertisers that have used these targeting types, as based on previous ad campaigns [1]. This targeting mecha-
well as the fraction of users that have been targeted with these nism is problematic because the algorithm behind Lookalike
types for both datasets combined. audiences is unknown to the public and users have no way
8 The large increase for Attribute-based around December and January
of knowing why they received such an ad. On top of this, it
2018 can be attributed to a possible bug from Facebook, where many ex- has been shown that Lookalike audiences are vulnerable to
planations from different advertisers showed the same demographic attribute, deceptive advertisers that can use the mechanism to increase
namely Member of a Family-based household. the discrimination in their targeting [38].
8TABLE IX. B REAKDOWN OF TARGETING TYPES SPLIT GEOGRAPHICALLY; WITH THE RESPECTIVE FRACTION OF ADS , ADVERTISERS AND USERS
TARGETED .
Europe (85 users) North America (16 users) Brazil (495 users) Rest of World (12 users)
Ads Advs. Users Ads Advs. Users Ads Advs. Users Ads Advs. Users
Age/Gender/Location 24% 35% 98% 19% 25% 94% 16% 28% 94% 18% 28% 75%
Behaviors 1% 2% 39% 1% 1% 31% 0% 0% 0% 1% 2% 50%
Demographics 2% 3% 27% 1% 2% 31% 0% 0% 0% 1% 3% 33%
Interests 37% 48% 94% 23% 36% 88% 41% 55% 97% 41% 48% 92%
Profile data 7% 8% 88% 4% 6% 88% 4% 5% 83% 9% 11% 75%
Data brokers 1% 1% 28% 2% 4% 50% 1% 2% 49% 0% 0% 0%
PII-based 2% 1% 73% 6% 5% 81% 3% 2% 80% 2% 2% 67%
Retargeting 8% 7% 80% 13% 13% 94% 15% 12% 95% 10% 10% 92%
Lookalike audiences 17% 17% 92% 30% 33% 100% 17% 14% 96% 15% 19% 83%
Location-based 1% 3% 71% 2% 3% 50% 2% 6% 63% 1% 2% 50%
Social neighborhood 1% 3% 51% 1% 2% 62% 2% 8% 61% 1% 4% 58%
(3) A non-trivial fraction (12%) of ads are part of Retargeting, than five ads; we similarly define a one-shot advertiser as an
meaning an advertiser is trying to reach a user who had advertiser that targeted all users no more than once.
previously interacted with them.
(4) While a small share of ads (3%) are part of P II − based Impact of biases and limitations in the dataset: In order not
targeting (note that this targeting type has one of the lowest to overestimate the fraction of one-shot advertisers we report
precedences and it is underestimated), a large number of users results on only advertisers for users for which we have more
(79%) have been targeted with at least one P II − based ad than 2 weeks of data. We also looked at one-shot advertisers
(i.e., there exists at least one advertiser that knows the email for users for which we have more than 4 and 6 weeks of data
or the phone number or some other identifiable information and the results are similar so we omit them.
about the user). To date, there is no verification process of
how advertisers gathered such information and lists of phone Our results show that the large majority of advertisers
numbers and emails can be easily bought online [10]. It is (65%) are one-shot and only a small minority (3%) are ob-
important to give special attention to this targeting mechanism served persistently targeting users (64% and 4%, respectively,
especially because it has been shown that it can be used for for DATA -B RAZIL). The vast majority (88%) of persistent
discriminatory advertising [38] and has been exploited to leak advertisers have persistently targeted only one or two users;
users’ personal information [40]. however, some have targeted persistently up to 17 users in
DATA -W ORLDWIDE and 63 in DATA -B RAZIL (these include
(5) Surprisingly, Social neighborhood targeting only accounts Facebook, Netflix, Google, and Udemy). Table X compares the
for a very small fraction of ads (2%). This is somewhat unex- characteristics of the two types of advertisers for both datasets
pected as this is a marketing strategy for which social media combined. We can see the following:
have a competitive advantage over traditional advertising.
Popularity: In general, persistent advertisers are more popular
In addition, Table IX presents the frequency of each and are more likely to be verified, but there exist also persistent
targeting type in terms of ads, advertisers and users in Europe, advertisers who are niche(e.g., SEMY Awards, an organization
North America, Brazil, and the rest of the world.9 We see that: that gives industry awards; and Vianex-Fast-Remit, a money
transfer company with only 53 Likes).
(1) Data brokers and PII-based targeting types seem more
frequent in North America, reaching 2% and 6% of the ads, Targeting types: We observe that persistent advertis-
respectively (compared to 1% and 2% in Europe). PII-based
targeting types seem more prominent among users as well: TABLE X. C HARACTERISTICS OF PERSISTENT AND ONE - SHOT
81% of our North American users have received such ads, ADVERTISERS .
while there only 73% Europeans have. This might reflect the
differences regarding privacy laws and handling of personal Persistent One-shot
Verified 61% 24%
data in general [11]. Popular/Ordinary/Niche 67%/31%/2% 19%/59%/22%
(2) European advertisers appear to use Retargeting and Looka- Top targeting types Attr-based 44% Attr-based 51%
like audiences less frequently and Age/gender/location more Retargeting 18% Retargeting 3%
frequently. This is intriguing as it might show that current A/G/L 17% A/G/L 27%
Lookalike 16% Lookalike 10%
privacy discussions and laws [11] have an impact on European
PII 5% PII 1%
advertisers’ strategies. Social n. 1% Social n. 4%
Location 1% Location 4%
2) Persistent vs. one-shot targeting: We define a persistent Top IAB categories Tech.&Comp. 11% Food & Dr. 8%
advertiser as an advertiser that has advertised to at least one News & Pol. 10% Comm. Org. 8%
user over a period of more than two weeks and with more Food & Dr. 9% Education 7%
Style & F. 8% Style & F. 7%
9 Note that we assume that the precedence we observe in explanations is
Education 8% Shopping 7%
consistent across countries.
9TABLE XI. TARGETING TYPES AND TOP TWO IAB CATEGORIES WRT TABLE XII. T OP TARGETING ATTRIBUTES (I FOR Interests, B FOR
FRACTION OF ADVERTISERS IN EACH CATEGORY. Behaviors, D FOR Demographics, PD FOR Profile data) WRT THE FRACTION
OF ADS , ADVERTISERS , USERS FOR DATA -W ORLDWIDE .
Type DATA -W ORLDWIDE DATA -B RAZIL
Data brokers Automotive: 8.7% Business & Fin.: 7.7% Attribute Fraction
Business & Fin.: 5.9% Automotive: 5.7% English (US)-PD 8.4%
Travel-I 3.5%
PII-based Video Gaming: 6.5% Business & Fin.: 8.2% Food and drink-I 3.5%
Tech. & Comp.: 3% Video Gaming: 6.9% Shopping and fashion-I 3.1%
Lookalike a. Tech. & Comp.: 31.9% Business & Fin.: 27.7% Attributes present French (France)-PD 2.5%
Business & Fin.: 31.2% Careers: 25% in Ads Online shopping-I 2.3%
Entertainment-I 2.1%
Memb. of a family-based household-D 2.0%
Technology-I 1.9%
Music-I 1.3%
ers use PII-based and Retargeting more frequently and Sports-I 1.1%
English (US)-PD 6.6%
Age/Gender/Location less frequemently (compared to Ta- Travel-I 4.7%
ble VIII). For one-shot advertisers, we observe that they Shopping and fashion-I 3.9%
use Age/Gender/Location and Attribute-based more frequently, French (France)-PD 3.6%
Attributes used Memb. of a family-based household-D 3.2%
and Lookalike audiences, PII-based and Retargeting less fre- by Advertisers Food and drink-I 3.1%
quently. Surprisingly, a large fraction (8%) of targeting types Online shopping-I 3.1%
for one-shot advertisers are Location-based and Social neigh- Entertainment-I 3.0%
Technology-I 2.4%
borhood (compared to 4% in Table VIII). Music-I 2.3%
Sports-I 2.0%
Advertisers’ IAB categories: 10% of persistent advertisers are English (US)-PD 79.3%
part of the News and Politics IAB category (e.g., PokerGO, a Travel-I 63.1%
Entertainment-I 59.5%
Facebook page that covers news in Poker; Vanessa Grazziotin, Technology-I 56.8%
a Brazilian politician; the European Parliament); while only Attributes used Shopping and fashion-I 49.5%
to target Users Online shopping-I 49.5%
5% of one-shot advertisers are part of this category. Regarding Food and drink-I 49.5%
more sensitive categories, there exist 13 Medical Health Sports and outdoors-I 47.7%
persistent advertisers such as THINX (related to women’s Music-I 47.7%
Sports-I 46.8%
health), and Merck Group (a pharmaceutical company). Movies-I 41.4%
In the next section, we discuss how the text of the ads
changes across time when a user receives multiple ads from
the same advertiser. and third parties (e.g. Data brokers). There are differences in
targeting strategies across countries: more users are targeted
3) Who targets what types?: In this section we investigate with PII-based and Data brokers in the U.S. than Europe
which advertisers use opaque and more invasive targeting types and the rest of the world. Finally, advertisers from specific
such as Data brokers, PII-based and Lookalike audiences more industries like Business and Finance use such invasive and
frequently. Table XI shows for each targeting type the top two opaque strategies significantly more frequently.
advertiser categories with regards to the fraction of advertisers
from the category that have used the respective targeting type. B. Analysis of targeting attributes
Overall, we see that the IAB categories of advertisers that
make use of such targeting types are consistent across datasets We now study the precise attributes advertisers use to create
and include a sensitive category, Business and Finance. their targeting audiences, and the different ways advertisers
Advertisers in Automotive (8.7%; 5.7% in DATA -B RAZIL) are using them. There are four types of attributes according
and Business and Finance (5.9%; 7.7% in DATA -B RAZIL), to the Facebook Advertiser API: Interest (I), Behaviors (B),
use Data brokers more frequently in both datasets. In all cases Demographics (D) and Profile data (PD). We analyze data on
it is a significant increase compared to 2% of all advertisers 12K advertisers which have targeted 111 users with 38K ads
which overall use Data brokers (Table VIII). that have used 2,552 attributes (14K; 499; 55K; and 4,239 for
DATA -B RAZIL, respectively).
Automotive advertisers that use Data brokers include many
well known companies like Opel, Volkswagen, and Peugeot, Impact of biases and limitations in the dataset: We collect
indicating a possible industry practice, since data brokers are the attributes present in the ad explanations provided by
known to collect data about vehicle ownership [22]. Business Facebook. Andreou et al. [22] showed that if the advertiser
and Finance advertisers, which also use Lookalike audiences uses multiple attributes to create his targeting audiences, only
very frequently in both datasets (31.2% in DATA -W ORLDWIDE the attribute with the highest audience size will appear in the
and 27.7% in DATA -B RAZIL), include insurance companies explanation. Thus all the results in the section are likely to
like AXA Deutschland, financial services like germantaxes.de be biased towards the popular attributes advertisers choose (as
and banks like Santander Brasil. those will be shown if the advertisers use multiple attributes).
Additionally, possible biases of the population of our datasets
4) Takeaways: Thus far, we have observed a variety of
might be reflected on specific attributes.
marketing practices by advertisers both big and small. The tar-
geting mechanisms sometimes invasive (e.g. PII-based, Data
1) Attributes advertisers use:
brokers) and often opaque (e.g. Lookalike audiences). The
data used from targeting comes from a multitude of sources: Most and least used attributes: Table XII shows the 10
advertisers (e.g. PII-based), the ad platform (e.g. Interests), attributes that appear most frequently in ad explanations (top),
10TABLE XIII. S AMPLE OF ATTRIBUTES THAT HAVE APPEARED IN JUST ONE AD EXPLANATION .
Attribute Type Attributes
Interests Pokémon Yellow, Company, Capgemini, Artisan, Underwater diving, W9 (TV channel), Serge Gainsbourg, Fighting game, Modernism, Adobe
After Effects
Behaviors Expats (Italy), Nexus 5, New smartphone and tablet owners, Huawei, Xiaomi, Anniversary in 61-90 Days, Returned from trip 1 week ago, Small
business owners, Uses a mobile device (18-24 months), Samsung, Expats (Colombia)
Demographics Upcoming birthday, Anniversary within 30 Days, Birthday in 01 January, Close Friends of Women with a Birthday in 7-30 days
Profile data Student, Professor, Japanese, Northeastern University, Croatian, CTO, UPMC Paris, IIT Kharagpur, UCLA
TABLE XIV. A DVERTISERS WHO USE THE HIGHEST NUMBER OF ATTRIBUTES .
Dataset Name Nb Attr. Sample of Attributes
DATA - Google 94 Harvard Business Review (I), Graduation (I), Master’s degree (PD), Digital media (I), Politics and social issues
W ORLDWIDE (I), Women’s rights (I),Hacker News (I), US politics (very liberal) (D), Married (PD), Family (I)
DATA -B RAZIL Udemy 105 Web development (I), Audio mastering (I), Python (programming language) (I), Microsoft Word (I), First-
person shooter games (I), Data analysis (I), Artificial intelligence (I), Digital art (I), Network security (I),
Thich Nhat Hanh (I), Dalai Lama (I), Creativity (I)
TABLE XV. C ONSENSUS AMONG THE ATTRIBUTES THAT
were used by the largest fraction of advertisers (middle), and ADVERTISERS OF AN IAB CATEGORY USE MEASURED BY
were seen by the largest number of users in their ad explana- K RIPPENDORFF ’ S α ( NORMALIZED ).
tions (bottom) out of those considered in Section V-B. We can
see that most attributes are either languages, or broad Interests IAB category DATA -W ORLDWIDE DATA -B RAZIL
such as Travel and Entertainment. Regarding the least used Food and Drink 21.5% 13.7%
Style & Fashion 32.4% 21.6%
attributes, 38% of them appear in only one ad (Table XIII Technology and Comput. 9.3% 5.9%
presents a sample); 49% have been used by only one advertiser; Community Org. 5.4% 3.6%
and 64% have been seen by only one user (36%; 49%; and Shopping 11.5% 8.5%
48% for DATA -B RAZIL). Such attributes typically appear more News and Politics 9.1% 4.0%
specific (e.g. interests like Artisan, Modernism, or profile data Travel 59.8% 37.1%
that point to specific universities) than the most frequently Education 9.3% 9.8%
used attributes, revealing characteristics of users that might Healthy Living 22.4% 14.5%
make them more unique. Furthermore, the sparse occurrences Home & Garden 12.6% 9.4%
of these individual attributes highlights the fact that unless Business and Finance 8.1% 12.4%
users look at ad explanations constantly, they are going be Medical Health 15.2% 11.1%
oblivious of most of the attributes used to target them. Legal 4.6% 17.4%
Religion and Spirituality 13.6% 7.8%
Predefined vs free-text interests: As mentioned in Sec-
tion II-A, Interests can either be predefined or free-text. In our
dataset, a surprising fraction of ads (39%) was targeted using politics (very liberal) to target users. Similarly Udemy has
free-text interests while 61% targeted using predefined ones used attributes such as Dalai Lama and Thich Nhat Hanh
(47%; 53% for DATA -B RAZIL). The percentage of free-text which might reflect specific religious groups and political
interests is likely underestimated given they have generally a world-views. We will investigate in the next section how the
smaller audience sizes than predefined ones with a median of ads of advertisers vary with the targeting attributes they use.
203M users for predefined, and 17M for free-text that were
used for targeting in our dataset. It is worth noting that free- IAB categories’ attributes: Advertisers that belong to
text attributes can be used as a proxy to discriminate against the same IAB category, intuitively might have some consensus
people [38] and can also be more sensitive. on the attributes they use, which would reflect the category they
belong to. We use Krippendorff’s α reliability coefficient [32]
2) Consistency of attributes being used by advertisers: We to measure the amount of agreement between advertisers that
now take a deeper look at how consistent are the attributes that belong to the same IAB category. Values for α typically range
advertisers use both individually, and within their respective between 0 and 1, with α = 1 implying perfect consensus
IAB category. among the attributes that advertisers in a category are using and
α = 0 implying that the attributes each advertiser is using are
Individual advertisers’ attributes: While we cannot not statistically related. Table XV shows the α (normalized) of
always know all the attributes advertisers use for the same advertisers in the top 10 IAB as well as sensitive categories.
ad campaign (due to the limitations of ad explanations), We normalize the values by dividing by the the highest α
we can check whether multiple attributes appear in multiple in our datasets which corresponds to the Pets category (0.17
campaigns of an advertiser. In our dataset 24% of advertisers for DATA -W ORLDWIDE; 0.20 for DATA -B RAZIL). We see the
have used more than one attribute across all their observed ad highest consensus between advertisers in Travel and Style &
campaigns with some targeting even more than 15 different Fashion with 59.8% and 32.4% respectively (37.1%; 21.6%
attributes. Table XIV shows the advertisers that have used for DATA -B RAZIL). In fact, out of the 632 Travel advertisers,
the largest number of attributes in both datasets, including 37% has used the interest Travel and 10% the interest All
Google with 94, and Udemy with 105 attributes. While many frequent travelers.
of the attributes used seem relevant to the business scope of
the respective advertiser, some of them are more questionable. Regarding more sensitive categories, we see that most of
For example, Google has used attributes such as Married, them have in general lower consensus. The most common
Family, Women’s rights, Politics and social issues and US attribute out of the 591 attributes that News and Politics
11You can also read