Measuring User's Comfort in Autonomous Vehicles - Ellie Woolridge, Jamie Chan-Pensley (Connected Places Catapult)
←
→
Page content transcription
If your browser does not render page correctly, please read the page content below

HumanDrive
       Measuring the User Comfort of Autonomous Vehicles

  Measuring User’s Comfort in Autonomous
  Vehicles
  Ellie Woolridge, Jamie Chan-Pensley (Connected Places Catapult)

July 2020
     v1.0 | July 2020                                               1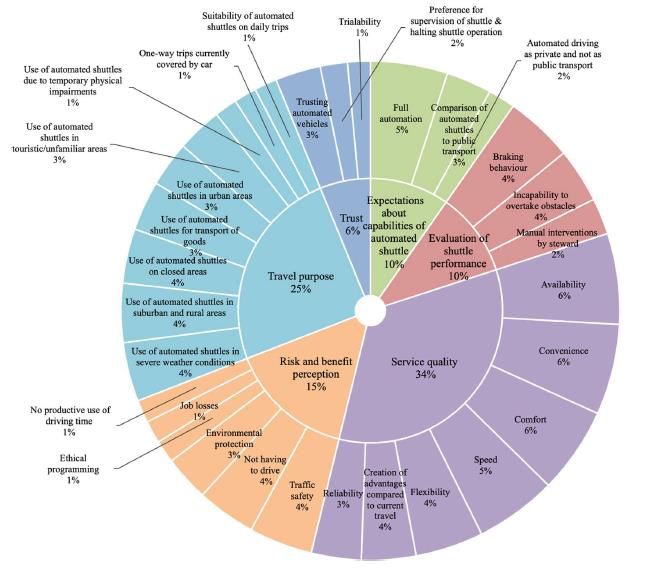
HumanDrive
Measuring the User Comfort of Autonomous Vehicles

Executive Summary

One key output of the HumanDrive project was the development of an Advanced Control System (ACS) by
Nissan and Hitachi designed to allow the AV to emulate a natural, human-like driving style.
During the course of the project Human Factors based research was carried out by the University of Leeds,
Connected Places Catapult and Cranfield University to evaluate the ACS in real-world and simulator based
trials so as to gain insights into the perceived naturalness, comfort and safety of the system under
evaluation. These attributes were measured during, and post experiencing, AV driving styles, via think
aloud protocols, questionnaires and a hand-held marker which recorded participant feedback in real-time.
The evaluations also considered how personality traits and personal driving style might influence
perceptions of AV driving styles.
The HumanDrive project outputs complement an already existing and growing body of research exploring
ride comfort in the context of AVs. The investigation of ride comfort should now be mindful of the
occupant’s expectations between the expected and actual driving style of the AV; the experienced loss of
physical control of the vehicle; the potential for engagement in non-driving related tasks, and the creation
of more novel seating configurations, which all alter the experience of riding in an AV, compared to
conventional vehicle ride comfort.
The existing body of research suggests that longitudinal and lateral movement of the vehicle, along with
its positioning in the road, vertical loadings, type of manoeuvre, weather conditions, environment type,
presence of other road users influences perceived comfort. An individual’s personal driving style,
familiarity, personality traits and age also have the potential to influence occupants’ overall perception
and acceptance of AV ride comfort. The review of research also suggests that most users are in favour of
an AV adopting a more defensive driving style. However, some driving scenarios could make it difficult to
achieve this style of driving and further consideration should be made to explore the effect of route
planning, vehicle design and cues, via the human machine interface to manage occupant ride comfort.
Further research is required to validate the summarised findings, with a wider population of potential AV
users, and in real-world settings, within a variety of scenarios. Future research should also look to establish
the wider factors of comfort (the overall perception of user comfort is not solely limited to the ride of the
vehicle), how these systematically influence each other, and how factors might change over time. There is
scope to tailor comfort to the preference of particular individuals or market segments, which may provide
a greater array of services and opportunities both for the end user and for businesses.

v1.0 | July 2020                                                                                             2
HumanDrive
Measuring the User Comfort of Autonomous Vehicles

Contents
Executive Summary ............................................................................................................................ 2
Contents ............................................................................................................................................ 3
Acknowledgments.............................................................................................................................. 4
1.     Introduction ................................................................................................................................ 5
     Project Description .................................................................................................................................... 5
     Background................................................................................................................................................ 5
2.     Definitions of Comfort for AVs ..................................................................................................... 7
3.     AV Ride Comfort.......................................................................................................................... 8
     Measuring AV Ride Comfort, for the HumanDrive Project ....................................................................... 8
     Findings from other studies measuring AV Ride Comfort.......................................................................11
     Research approaches for studies measuring AV Ride Comfort ..............................................................14
4.     Further considerations regarding the overall comfort of AVs ...................................................... 18
5. Conclusion and Further Research .................................................................................................. 23
6. References ................................................................................................................................... 24
Annex A Research approaches for investigating AV ride comfort ....................................................... 28
Annex B Research approaches for more broadly investigating AV comfort ......................................... 35

v1.0 | July 2020                                                                                                                                               3
HumanDrive
Measuring the User Comfort of Autonomous Vehicles

Acknowledgments
We would like to thank Professor Natasha Merat for editing this report and her support in the design of
the HumanDrive studies, reported in this paper.
We would also like to thank Dr Foroogh Hajiseyedjavadi, Dr Evangelos Paschalidis, Dr Tryon Louw, Dr
Deborah Forster and Dr Erwin Boer for their support in designing the studies and sharing existing research.
We would also like to thank Chris Holmes, Jordan Kelly, Stephen Nutman, Bob Bateman, Ioannis Souflas,
Ed Mayo, Martin Pett, Kyle Field, Erik Nielsen, Ryan Johnston, Professor Richard Romano, Dr Kim
Blackburn, Simon Stranks, Dr Rebecca Charles, Dr Jim Nixon, Dr Isonguyo Inyang, Salvatore Gariuolo and
Professor James Brighton for their guidance and support in delivering the studies.

v1.0 | July 2020                                                                                         4

HumanDrive
Measuring the User Comfort of Autonomous Vehicles

1. Introduction
Project Description
The HumanDrive project, led by Nissan, developed a prototype Autonomous Vehicle (AV), capable of
achieving high levels of automation, with the aim being to successfully demonstrate an autonomous
‘Grand Drive’ from Cranfield to Sunderland (over 200 miles) in live traffic. This was completed in November
2019 and demonstrated successful navigation of country roads, motorways and dual carriageways. The
project commenced in July 2017 and ran for a duration of 33 months, finishing at the end of March 2020.
The project was divided into ‘work packages’, with the Connected Places catapult (CPC) leading on the
Project Management and Safety work packages, but also taking a key role in the supporting of work
packages relating to ‘Trials, Demonstration and Validation’. The HumanDrive consortium consists of the
organisations shown in Table 1 below:

                                         Organisation                         Role
                          Nissan                                       Lead

                          Atkins Ltd                                   Collaborator

                          Cranfield University                         Collaborator

                          Highways England                             Collaborator

                          Hitachi                                      Collaborator

                          HORIBA MIRA                                  Collaborator

                          SBD Automotive                               Collaborator

                          Connected Places Catapult                    Collaborator

                          Aimsun Ltd                                   Collaborator

                          University of Leeds                          Collaborator

                                    Table 1 : Organisations involved in HumanDrive

One of the major innovative aspects of HumanDrive was the development of an Advanced Control System
(ACS), designed to allow the AV to emulate a natural, human-like driving style. A key enabler for this is the
integration of an Artificial Intelligence (AI) controller, developed by Hitachi, which utilised Artificial Neural
Networks (ANNs), and deep learning, for perception and decision-making.

Background
AV technology could provide end users with benefits, including safer travel and increased personal time,
as the driver is able to relinquish driving responsibilities to the vehicle and their journey time becomes
their own time. AVs could also provide more independent and flexible travel for those who have had to
forego their driving licence, or to those who do not have access to a vehicle, limited to travelling with
others or by the availability of current public transport offerings.

v1.0 | July 2020                                                                                               5
HumanDrive
Measuring the User Comfort of Autonomous Vehicles
Visionaries and marketeers are already proposing novel vehicle designs and suggesting that a vehicle
interior might look more like an office or a relaxing pod within which to read or undertake other non-
driving related activities. If such a vision is to be realised, ensuring comfortable and safe travel for users of
AVs will be critical to the success of these novel concepts. Even if the design of AVs diverges little from the
conventional design of the vehicles we know today, great consideration needs to be taken for ensuring the
vehicle ride is a comfortable, one as well as being a safe one.
Exploring the requirements for comfort in the early phases of AV design is key to ensuring that the
appropriate requirements can be built into the wider design, developed and explored appropriately
through iterative testing. The overall cost of design has been proven to be reduced when user
requirements are considered at the beginning of the design phase (Design Council, 2007, Steen, Kuijt-Evers
& Klok, 2007 and Waller et al., 2015). This paper investigates the current research into the comfort of
highly automated vehicles (SAE levels 4 and 5, SAE, 2019).
Figure 1: Proposals for AV configurations (for source see references (section 6))
v1.0 | July 2020 6HumanDrive
Measuring the User Comfort of Autonomous Vehicles
2. Definitions of Comfort for AVs
Researchers who have explored user comfort in the context of AVs have quoted the broader definitions of
comfort:
“Psychological aspects describe comfort as a pleasant state of physiological, psychological and
physical harmony between a human being and the environment”
(Slater, 1985, cited by Hartwich, Beggiato & Krems, 2018).
“Comfort is a pleasant state of well-being, ease, and physical and psychological harmony between
a person and the environment. Discomfort [is] a state where one experiences hardship of some
sort, which could be physical, physiological or psychological”
(Wasser et al., 2017).
“Comfort is commonly associated with a feeling of well-being and an attribution of positive valence
towards the eliciting entity and, depending on the view of comfort, associated with the absence of
discomfort and uneasiness.”
(Bellem et al., 2018)
Bellem et al. (2018) acknowledge that no widely shared and agreed-upon definition of comfort has been
established in the scientific community, citing that it is also debated whether comfort and discomfort
should be seen as opposite poles of one construct, or whether they can co-exist (Vergara & Page, 2000
and Zhang, Helander & Drury, 1996). Whereas, Wasser et al. (2017) cited Vink (2005) and considered
comfort as a bipolar phenomenon, whereby comfort is positioned at the extreme positive end, and
discomfort at the extreme negative end, of a continuum with a neutral point between. Bellam et al. (2018)
also point to comfort as a pleasant state that is not experienced in the face of high arousal (Summala,
2007). Though overall, it is commonly agreed that there are a few key assumptions about this concept:
comfort is subjective and can therefore, differ between and within individuals. Comfort is influenced by
internal and external factors, it is affected by physical, physiological and psychological factors, it is
experienced as a reaction to a stimulus or results from the interaction between individuals and their
environment (Bellam et al. 2018 and De Looze, Kuijt-Evers & Van Dieën, 2003, cited by Hartwich, Beggiato
& Krems, 2018).
In the context of AVs, researchers consider that the relationship between expected and actual driving
experience, a loss of physical control of the vehicle, and the ability to engage in different tasks, could lead
to the user engaging in non-driving related tasks, such as games or email, resulting in more novel seating
configurations (as illustrated in
Figure 1). All of the above will further influence the design and management of user comfort (Elbanhawi
et al., 2015, Bellam et al. 2018, Hartwich, Beggiato & Krems, 2018 and Ekman et al. 2019, Diels, 2014).
Regarding the loss of physical control, Hartwich, Beggiato & Krems, (2018) specifically defined discomfort
as states of tension or stress resulting from unexpected, unpredictable or unclear actions of the automated
system.
v1.0 | July 2020 7HumanDrive
Measuring the User Comfort of Autonomous Vehicles
3. AV Ride Comfort
Measuring AV Ride Comfort, for the HumanDrive Project
Comfort has been a popular measure for evaluating and proposing designs for an acceptable AV ride across
a number of studies. The HumanDrive project sought to obtain feedback from both professional drivers
and the general public to determine whether an AV could emulate a natural, human-like driving style, and
if this was comfortable and felt safe for end users.
During the course of the project research was carried out by the University of Leeds, CPC, and Cranfield
University to determine the driving characteristics and risk profiles of different drivers. Further to this,
Human Factors evaluations were carried out on the HumanDrive Advanced Control System (ACS) in both
real-world and simulator environments, to gain insights into the perceived naturalness, comfort and safety
of the system behaviour.
Evaluation of the AV in the real-world was evaluated in two stages, initially with professional drivers, during
the earlier stages of development and evaluated again at a later stage with participants from partner
organisations but who were not part of the HumanDrive project itself. The initial study acted as a sense
check to validate the intention to create a more natural and humanlike AV ACS and provided
recommendations to develop a more robust system to be reviewed by potential users from the public.
Both evaluations took place on the Cranfield University test track in controlled settings, the route included
segments of straight road with two adjoining T-junctions, a bus stop and pedestrian crossing, a curved
segment of road and a roundabout. This introduced a variety of driving environments to see how these
influenced occupant comfort. Vehicle data, video footage, audio, vehicle (via Global Positioning System
(GPS)) and other road user positioning was collected during the drives as well as the capture of subjective
perceptions.
Real-world study one:
Seven professional drivers were recruited after completing a demographic questionnaire which
captured age, gender, driving experience, job role and attitudes towards technology and
automation. A selection of participants were invited to participate in the trial. The professional
drivers were initially interviewed to understand their view about AVs, and then completed the
Arnett Sensation Seeking (Arnett, 1994), Traffic Locus of Control (Özkan & Lajunen, 2005) and
Driving Style (French et al. 1993, West, Kemp & Elander, 1993 and West, Elander & French 1992)
questionnaires.
Two weeks later the participants were invited back to the test track, they were asked to drive a
Nissan Leaf for a specific route. The vehicle then, in an automated mode, replayed the participant’s
own drive and that of the HumanDrive system. At this point of the trial the participants were not
informed that it was their own drive or that of the HumanDrive system. These drives were
randomised to manage the order effect. Only pedestrian actors were present, standing on the
pathways and there was no other traffic on the roads. For the AV drives, the participant sat in the
front passenger seat, a safety engineer sat in the driving seat and a test engineer and trials
facilitator sat in the back of the vehicle. During each drive, the participant was asked to speak
aloud about their experience, and they were given a hand-held controller to record when they felt
the drive was natural or un-natural. The participants were asked to press one of the buttons on
v1.0 | July 2020 8HumanDrive
Measuring the User Comfort of Autonomous Vehicles
the hand controller, at thirty second intervals and at any moment they felt necessary to provide
feedback. The marker data could be compared to the vehicle data and positioning within the
environment. Following each drive, the trial participants completed a questionnaire of rating
scales and comment boxes to provide feedback and to note their intention to use such a system
in the future. The questionnaire included adaptions of questions from the Godspeed (Bartneck,
Kulic & Croft, 2008) and the Unified Theory of Acceptance and Use of Technology (UTAUT),
(Venkatesh et al. 2003).
At the end of the trial participants ranked the driving experiences in order of preference (their
manual drive, the AV and the replay of their drive). A pictorial overview of the trial is presented
within Figure 2.
Figure 2: Real-world study one overview
Real-world study two:
The second trial invited twenty people from the general public to participate, again these
participants completed a recruitment questionnaire as in study one.
The participants were invited to the test track and initially completed a questionnaire about their
attitudes towards AVs and the Arnett Sensation Seeking questionnaire (Arnett, 1994). Each
participant was asked to drive along a controlled roadway, either driving themselves, driven by
v1.0 | July 2020 9HumanDrive
Measuring the User Comfort of Autonomous Vehicles
the Nissan AV ACS or driven by a human driver. During each of these conditions, choreographed
scenarios were present on the test track that included pedestrians on pathways, pedestrians at
crossings, oncoming vehicles, parked vehicles and vehicles at T-junctions. The order of the drives
was randomised. As in the real-world study one, feedback was captured during the AV and human
driven drive, via the hand-held controller to mark events comfort and discomfort and each drive
was followed by the completion of questionnaires. The think aloud process was removed when
there was a human driver and the feedback questionnaire was adapted. This was because of the
feedback during the pilot study which found that some participants did not feel comfortable
commenting on the human driver, whilst they were sat next to them and that some of the
questions were only applicable to an AV. After experiencing all driving conditions participants
completed the Traffic Locus of Control (Özkan & Lajunen, 2005 and Warner, Özkan & Lajunen
2010) and Driving Behaviour (Reason et al. 1990) questionnaires.
Twelve participants who had provided a variety of feedback during the initial trial were invited
back two weeks after the trial to be interviewed and provide further feedback about the drives,
and their attitudes towards AVs. An auto-confrontational method was applied to the interview,
whereby, video footage of the participant’s drives was played back during the interview itself. This
allowed the participant to discuss and comment on aspects of their experience for each drive as
well as their overall experience. A pictorial overview of the trial is presented within Figure 3.
Figure 3: Real-world study two overview
Some preliminary analysis of the trial participants’ scoring of the overall behaviour of the AV was
undertaken. They were asked to score whether they felt that the AV was safe or un-safe, unnatural or
natural, comfortable or uncomfortable. The majority of participants provided positive feedback of their
AV ride experience. Most positively agreed that the AV was comfortable (sixteen of nineteen participants)
and that it behaved naturally (thirteen of nineteen participants) and safely (seventeen of nineteen
participants).
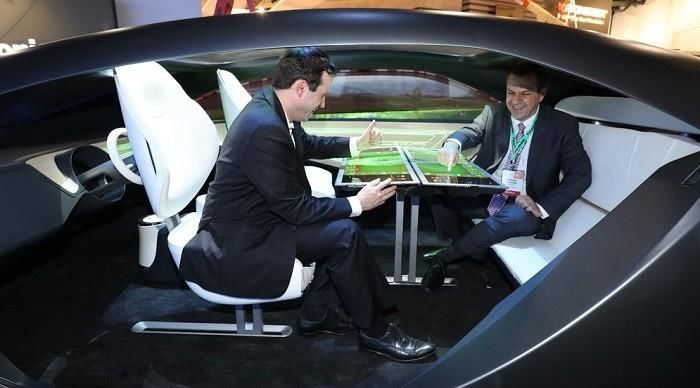
v1.0 | July 2020 10HumanDrive Measuring the User Comfort of Autonomous Vehicles The University of Leeds also carried out research studies within their simulator facilities to determine preferences for the different AV driving styles and behaviours, this also included the consideration of how humans drive and how these characteristics might be considered within an ACS. For all studies, the subjective feedback continues to be analysed alongside the data capture of the vehicle performance and positioning. The capture of the participant’s own drive shall also be compared to their feedback of the other drives. Findings from other studies measuring AV Ride Comfort Elbanhawi et al. (2015) provided an overview of measures to investigate ride comfort in autonomous cars. They advise that researchers need to consider factors such as vehicle control, motion sickness and safe distance keeping in addition to the more traditional in car ergonomics such as, Noise Vibration and Harshness (NVH), temperature, air quality and load/road disturbances. They found that few studies have begun to investigate and suggest appropriate AV behaviours to satisfice occupant comfort, trust and acceptance. On the basis, of their findings they suggest research solutions to manage the comfort of user’s riding in AVs, as illustrated in Figure 4. They also advise that comprehensive human testing is still required, at this stage, to identify the effect of autonomous driving on passenger comfort. (DVI is Driver-vehicle interface) Figure 4 : Research solutions to manage the comfort of user’s riding in autonomous vehicles (Elbanhawi et al, 2015) A number of studies which have started to explore and recommend considerations for “comfortable vehicle motion” for AVs, are building on and adapting existing research techniques and applying them to this subject. In a study where Bellem et al (2016) requested drivers to mimic dynamic, comfortable and everyday driving, they found that acceleration, jerk, quickness and headway are essential components of an v1.0 | July 2020 11
HumanDrive
Measuring the User Comfort of Autonomous Vehicles

automated driving style for comfort and ease. With small allowances, these metrics are applicable in both
rural-urban environments and under highway conditions. Bellem et al (2018), later investigated the
influence of manipulating acceleration and jerk through the course of different driving manoeuvres to
identify comfortable driving strategies. They also considered whether they could identify a comfortable
experience for as many people as possible and whether these preferences were dependent upon
personality. Overall, they found that the main preferences remained the same across participants,
regardless of age, gender or attitudes. Overall, a driving style characterised by lower jerks and eliciting a
feeling of safety through early actions in situations in which a criticality might arise and a softer onset in
‘regular’ situations was perceived as comfortable. Though some significant differences in preferences
could be found for those individuals who reported having risky and high velocity driving styles for
acceleration and or lane change manoeuvres. They also suggested that there could be scope to tailor the
AV driving style for different customer segments and also provide a style that could be adapted by all. The
overall preferred driving style did not necessarily correspond to how a human driver might drive a vehicle
manually.
Bae, Moon & Seo (2019) also focused on accelerations and jerks of vehicles to improve the comfort of
passengers riding an automated shuttle bus. Consideration was made for both standing and seated
passengers and their susceptibility to motion sickness. Basing their recommendations on previous
literature, they opted for a driving style that would be accepted by a cautious passenger, who might favour
softer steering, acceleration and braking control. Their summary of different driving thresholds and zones
is presented within Figure 5. Acceleration and deceleration was also manipulated by Yusof et al. (2019), as
presented within Table 2, to simulate a defensive and assertive AV driving style and a style to replicate
Light Rail Transit (LRT). Given that LRT typically accelerates and decelerates at a slower rate than human
driving, it provided more freedom for users to carry out non-driving related tasks. They also looked at
whether assertive drivers or defensive drivers may prefer specific driving styles. Overall, they found that,
participants agreed with the defensive AV style and found the LRT too defensive and the Assertive AV too
assertive. Most participants with a defensive driving style agreed that the simulated defensive AV was
similar to their own style and some participants with an assertive driving style stated that the simulated
defensive AV was also a good reflection of their own driving style. All these drivers pointed out that the
forces in the assertive AV should be lowered. Two of the participants also mentioned that, as a driver they
may drive more akin to the assertive style but as a passenger the defensive style is preferable.

v1.0 | July 2020                                                                                           12
HumanDrive
Measuring the User Comfort of Autonomous Vehicles

               Figure 5: Summary of different acceleration and jerk criteria (Bae, Moon & Seo, 2019)

    Type of Acceleration          Light Rail Transit AV          Defensive AV Driving           Assertive AV Driving
                                      Driving Style                     Style                           Style

 Longitudinal acceleration           0.00 g to 0.14 g               0.14 g to 0.25 g               0.25 g to 0.5 g

 Longitudinal deceleration          0.00 g to -0.14 g              -0.14 g to -0.33 g             -0.33 g to -0.76 g

    Lateral acceleration             0.00 g to 0.15 g               0.15 g to 0.42 g               0.42 g to 0.54 g

    Vertical acceleration                    -                      0.00 g to 0.16 g               0.16 g to 0.66 g

          Table 2 : Ranges of accelerations for the AV driving styles in triaxial directions (Yusof et al. 2019)

In a study which investigated trust in autonomous driving styles, Ekman et al. (2019) invited participants
to evaluate an aggressive and a defensive driving style. Based on previous literature, changing gears,
starting and stopping behaviour, acceleration and retardation patterns, lane positioning and distance to
objects were manipulated for each driving style, Table 3 presents these differences. They found that the
aggressive driving behaviours affected the participants’ ability to trust the vehicle and, in some cases, the
participants stated that the poor comfort of the vehicle motion was what had contributed to their reduced
trust in the vehicle.
Voss et al. (2018) specifically investigated the accepted comfort and safety thresholds of lateral vehicle
control for an AV. Participants observed the lateral vehicle performance and provided subjective feedback.
The findings indicate that vehicle position to the road centreline always had a significant influence on the
participant’s adequacy ratings, however, when oncoming traffic was present the threshold was lowered.
Weather conditions, personality trait and sensation seeking attitudes were also influential for scenarios
which included oncoming traffic. The preference of a reactive and static autonomous trajectory behaviour,
which varied in lateral position was investigated by Rossner & Bullinger (2019). The reactive trajectory
would shift to the curb-side edge of the lane when interacting with oncoming traffic, whereas the static
trajectory would maintain positioning within the centre of the lane throughout the drive. It was found that
overall passengers preferred the reactive trajectory and felt safer when the road lane was wider. Perceived

v1.0 | July 2020                                                                                                       13
HumanDrive
Measuring the User Comfort of Autonomous Vehicles
safety was significantly influenced by a wider lane width. Driving comfort and joy was significantly greater
for the reactive trajectory behaviour and perceived driving style was influenced by both trajectory
behaviour and lane width for the reactive trajectory. Although overall the reactive trajectory received
higher positive scores for perceived safety, driving comfort, joy and driving style. The static trajectory only
received negative scores for perceived driving joy. Statistical analysis was not carried out for the position,
type and quantity of oncoming traffic interactions which were studied, yet it appears that perceived safety
is influenced by the on-coming traffic scenarios.
Driving Properties Defensive Driving Style Aggressive Driving Style
Changing gears Use highest gear possible Use gear with most torque
(low revs) (high revs)
Starting and Keep the vehicle rolling Start and stop (comes to full
Stopping behaviour (avoid standstill) stop)
Acc./Retardation Avoid heavy accel./decel. Heavy accel./decel. Measured
pattern Measured to be within: to be within:
0.06 to 0.09g (accel.), 0.11 to 0.23 g (accel.),
-0.1 g to -0.13 g (decel.) 0.17 g to -0.32 g (decel.)
Lane positioning Early indicate right or left Indicate late right or left turn
turn (through positioning in (through positioning in lane)
lane)
Distance of objects Keep bigger gap (lateral & Keep smaller gap (lateral &
longitudinal) to other longitudinal) to other objects
objects
Table 3 : Criteria for driving styles Ekman et al. (2019)
Hartwich, Beggiato and Krems (2018) studied the perceived comfort and enjoyment of experiencing,
familiar and unfamiliar driving styles. By replaying the individual’s own driving and by playing other drives
more familiar to and not so familiar to their own replay, in doing so they unearthed some interesting
differences between age groups. Younger drivers (aged 25-35 years) showed higher comfort, enjoyment
acceptance with familiar driving styles, whereas, older drivers (aged 65-84 years) preferred unfamiliar,
automated driving styles that tended to be faster than their age-affected manual driving styles.
Though, Basu et al. (2017), also found that a younger population for drivers (aged 18-31 years) tended to
prefer more defensive driving styles than their own, but that preferences for driving style was also
influenced by driving context. Interestingly, they did find that preferred styles were similar to the style that
participants perceived mimicked their own, however, there was actually little similarity between what they
thought was their own driving verses their actual driving.
Research approaches for studies measuring AV Ride Comfort
These overall findings suggest that the following factors could influence the comfort of vehicle motion:
• Acceleration, deceleration, jerk, headway, quickness and speed
v1.0 | July 2020 14HumanDrive
Measuring the User Comfort of Autonomous Vehicles
• Lateral position
• Vertical loadings
• Type of manoeuvre
• Weather
• Environment type
• Presence of other road users (vehicles)
• Personal driving style and familiarity
• Age
• Personality traits (including attitudes towards sensation seeking)
These factors should, therefore, be considered within the scope of further research into the ride comfort
of AVs. Given that these findings are based upon a limited number of research studies of various levels of
fidelity (realness) and with limited representation of all possible autonomous car users, further evidence
is required to confirm these factors. The inter-relationships between these factors, and the interaction
between these scenarios and end users comfort needs to be further explored. For example, the scenarios
explored for the presence of other road users might further consider the size of vehicles, and other road
users. Table 4Table 5 (Annex A), provides a more detailed overview of the scope and limitations of the
research discussed.
Given that this paper has reviewed studies regarding ride comfort, the adjective “comfort” was commonly
used as an item to rate the preference of different AV driving styles. Other adjectives used to measure
user experiences with the AVs have been listed within Table 4. As well as using questionnaires, other
methods used to obtain these preferences included the use of think aloud protocol (Basu et al. 2017),
marking feedback in real-time via hand-held devices (Hartwich, Beggiato & Krems, 2018 and Rossner &
Bullinger, 2019) and by further interviews (Rossner & Bullinger, 2019 and Ekman et al. 2019).
Additional adjectives used alongside Reference
Comfort
“Acceptance” Hartwich, Beggiato & Krems, 2018
Rossner & Bullinger, 2019)
“Enjoyment” Hartwich, Beggiato & Krems, 2018
“Joy” Rossner & Bullinger, 2019
“Pleasant” Yusof et al. 2016
“Trust” Rossner & Bullinger, 2019
Ekman et al. 2019
“Safety” Rossner & Bullinger, 2019
Voss et al. 2018
Yusof et al. 2016).
Table 4: Adjective measures used in addition to “Comfort”
For the experiments carried out, the simulation of different AV driving styles were represented using
simulators (of varied degree of fidelity) (Basu et al. 2017, Bellem et al. 2018, Bae, Moon & Seo, 2019,
v1.0 | July 2020 15HumanDrive Measuring the User Comfort of Autonomous Vehicles Hartwich, Beggiato & Krems, 2018, Rossner & Bullinger, 2019 and Voss et al. 2018) and Wizard of Oz set- ups in the real word with professional drivers (Ekman, 2019 and Yusof et al. 2016). Different driving styles were often categorised as defensive or aggressive (Bae, Moon & Seo 2019, Basu et al. 2017, Ekman et al, 2019 and Yusof et al. 2016). Rossner & Bullinger (2019) described the behaviour as more reactive or static based on the vehicle’s ability to move in response to other traffic and Bellem et al. (2016) categorised driving styles as either dynamic, comfortable or everyday driving. The characteristics of current public transport vehicle behaviour were considered by Bae, Moon and Seo (2019) and Yusof et al. (2016). The factors such as acceleration, deceleration, jerk, headway, quickness and speed, lateral position and vertical loadings were manipulated to create and develop an appropriate AV diving style, though Diels (2014) points out that high levels of accelerations are typically observed in urban or rush hour motorway traffic (Diels, 2014). Therefore, the traffic flow influenced by other traffic behaviour could make it more difficult to achieve the recommended driving criteria in all scenarios. Where there is a predominant fleet of AVs this might be better managed, otherwise, more optimum route planning could be utilised to avoid scenarios which are likely to induce discomfort. In addition, to avoid motion sickness the AV design should maximise the ability for the user to anticipate the future motion path. Forward and sideways visibility should be maximised and ideally occupants would have a clear view of the road ahead. Though if conditions do not allow for this, any visual information, that correctly indicates the direction of travel will reduce the amount of sensory conflict and enhance the ability to anticipate the motion path. Window surface areas or day light openings should, therefore, be maximised with minimal obstruction by A/B/C pillars, with low belt lines or seats of a sufficient height to enable occupants to see out of the vehicle. New lighting technologies such as Organic Light Emitting Diodes (OLED) may provide the possibility to provide simulated optic flow pattern displays inside the vehicle. See-through displays, such as head up displays will reduce the impact of incongruent motion cues. Future research may also explore the effectiveness of using visual, auditory, and/or tactile cues to provide an artificial horizon and signal the future motion path. Altering the sensation of speed (user perception of the rate at which objects or the environment pass the vehicle) can also be achieved through changing the driving position, from lower in the vehicle (greater sensation of speed as it is harder to view relative positioning of objects to each other, and the lower centre of gravity also provides a feeling of being closer to the inputs of the vehicle) to a higher position (lesser sensation as a raised position allows the user to gain greater perspective of the relationship of different objects, and vehicle inputs are experienced at a different rate). This can be provided and manipulated through multiple senses. Through the visual field it is possible to provide passengers in AVs with display screens, instead of actual windows. This enables the ability to project visual information that can conflict or override the sensations provided by the vestibular system. Latency and delays between sensation and visual field are commonly known to cause conflicts, leading to a feeling of discomfort, but there is also potential to manipulate this for a more pleasant experience. Controlling acoustic information and other inputs through the vehicle have often been tested through NVH. This is a more traditional approach utilised by car manufacturers to addressing refinement and comfort with a relative relationship between magnitude and feelings of comfort. The greater the magnitude, the less pleasant the experience (although there are occasions where noise can be linked to enjoyment, through exhaust or engine for some passengers).Interestingly, a few of the studies have looked at comparing participants’ driving behaviours to that of the AV behaviours, or investigating how this might influence preferences towards AV driving styles and behaviours, either by capturing data on their actual driving behaviour (Basu at al. 2017, Bellem et al. 2016 and Hartwich, Beggiato & Krems, 2018) or profiling drivers, based on their responses to v1.0 | July 2020 16
HumanDrive
Measuring the User Comfort of Autonomous Vehicles

questionnaires (Bellem et al. 2018, Voss et al. 2018 and Yusof et al. 2016). The use of questionnaires,
however, relies on the validity of the subjective reporting from each individual. Basu et al. (2017) also
found that when participants experienced the different drives there was actually little similarity between
what participants thought was their own driving, versus their actual driving data. Questionnaires, which
profile individuals based upon their overall personality types, should also ensure correlation to their driving
style or preferences too. Yusof et al. (2016) also reported that how you may wish to be driven as a
passenger could be different to the way in which you like to drive. Comfort is subjective and can therefore,
differ between, and within individuals. Yosof et al. (2016) echoes this point, by suggesting that in some
situations, individuals might prefer a more comfortable drive when utilising time or engaging in secondary
tasks and for other situations a more assertive drive, for example to experience a thrilling drive, or when
late for an appointment. As greater levels of personalisation are provided in the form of selectable options
within vehicle settings, the way in which they are perceived by end users may vary considerably. One way
in which this is mitigated is through the different touch points that a user engages with, once they are in
the confines of the vehicle and additionally providing varying levels of configurability. These can be
through seating, lighting levels, sounds and environmental conditions.

v1.0 | July 2020                                                                                            17
HumanDrive
Measuring the User Comfort of Autonomous Vehicles

4. Further considerations regarding the
   overall comfort of AVs
When considering the design of AVs for occupant comfort, further factors should be taken into account in
addition to the vehicle driving style to ensure a holistic experience. Wasser et al. (2017), acknowledges
that the comfort of AVs is influenced by far more factors than the vehicle itself and spans across associated
services. They discuss a much broader approach, which considers more holistic facets which contribute to
the overall user experience, basing their approach upon the existing research established within aviation
travel. This approach considers the physical designs of the vehicles, behaviours and social interactions
within the wider service and infotainment offerings.
These authors considered the extent to which the eight factors proposed as being particularly important
in determining comfort within the aviation industry by Ahmadpour et al. (2014), could be extrapolated to
guide the design and evaluation of last mile driverless pods. Initially comparing this to the semantic
environment descriptions for the assessment of vehicle interiors (Karlsson et al., 2003), as displayed within
Figure 6.

               Figure 6 : Comparison between comfort factors for aviation and (Wasser et al., 2017)

In the context of driverless pods, the researchers advise that the following should be considered within
each factor:

        Peace of mind: Providing an efficient interior layout. With consideration to offering secure storage
        for belongings, to rest mentally and physically. Providing an ability for the passenger to observe
        vehicle behaviour and to recognise intentions, for example via the HMI (human machine interface)
        or via a good view to the exterior, also important in instilling trust. Enabling passengers to
        intervene if they wish by prematurely terminating a route or choosing a different path.

v1.0 | July 2020                                                                                          18
HumanDrive
Measuring the User Comfort of Autonomous Vehicles
Physical wellbeing: Attributes providing good body support but whilst also providing a degree of
privacy and comfort from other passengers. This also considers the amount energy which maybe
exerted by a passenger for example, by entry or restraint against vehicle movements. Ability to
perform non-driving tasks and combat motion sickness.
Proxemics: Describing the feeling of autonomy over the space such as seats and HMI. Also
including segmenting zones for personal space or specific scenarios.
Satisfaction: Includes symbolic, hedonic and functional considerations.
Pleasure: Linked closely to proxemics and satisfaction, it can be positively influenced by providing
the passenger with the ability to make choices, adjustments and generally performing different
activities during transit. The haptics of the vehicle materials that the passenger comes into contact
with and quality of the infotainment system.
Social: This leads to a mixture of preferences whereby the passenger can interact with others but
also seek personal space. Opportunities around Mobility as a Service (MaaS) will facilitate a wider
range of interactions. The influence of network connectivity can also influence the ability for the
passenger to socially interact.
Aesthetics: Including a clutter free and clean interior that is well maintained and a vehicle that
conveys a sense of stability and protection.
Association: A symbolic satisfaction attribute, for example associating something as modern or
perhaps during the early introduction of AVs, as something novel.
These factors were further considered for developing a set of criteria to analyse different driverless pod
concepts. The criteria included consideration of accessibility, the interior space and seating. Interaction
with booking and access systems and emotional experience such as sense of control and ability to observe
vehicle movements.
(Nordoff et al, 2019) also found that participants attributed factors of comfort to service quality. In this
study, interviews were carried out with people who had taken a ride on a shared, automated shuttle
service demonstrator. The open interview approach enabled the researchers to capture a rich overview of
the factors influencing users’ expectations, both in terms of their expectations of automated driving
technology, and whether this particular experience fulfilled these expectations. The interview quotes were
analysed and assigned to six categories, and associated sub-categories, as presented within Figure 7.
Suggestions around comfort included comfortable seating, travelling in or with their back to the driving
direction, access to seating, including a place for luggage, free internet, outside visibility, cleanliness, air
conditioning, an attractive interior room and the size of the shuttle. It was also suggested that automated
public transport should be more comfortable and of better quality than existing public transport. In line
with the factors considered within the research reported on ride comfort, some users also discussed
braking behaviour and the capability to overtake obstacles as factors which affected their comfort.
Nordoff et al. (2018) also investigated how respondents rated a shared service automated shuttle, its
potential as a feeder to transport systems in urban and rural areas, and its advantages in comparison to
the respondent’s existing form of travel. They found that there was a strong positive relationship between
shuttle and service characteristics, and overall intention to use. Shuttle characteristics included, size,
v1.0 | July 2020 19HumanDrive
Measuring the User Comfort of Autonomous Vehicles
aesthetics, comfort of entry and exit, spaciousness, number of seats, seating comfort, space for luggage,
the general atmosphere and safety considerations.
In a study which investigated the key factors which influence trust in driverless cars, a brief link was also
made between comfort and safeguards within the design of the vehicle system. The findings confirmed
that trust/safety was a valid and reliable factor to measure user adoption of autonomous driving, where
the statement “Driverless cars have enough safeguards to make me feel comfortable using it” scored the
second highest validity loading (Kaur and Rampersad, 2018).
Further research investigating the wider factors of comfort may be found within research investigating
acceptance and satisfaction in AVs. The KANO model, as presented within Figure 8 and cited as important
by Wasser et al. (2017) , is a theoretical model which enables designers to determine which features could
be included within a product or service to improve customer satisfaction. The model is constructed of five
categories of customer preferences which are classified depending on their ability to create customer
satisfaction or to cause dissatisfaction. The five categories include
• Performance (requirements at the top of the customer’s mind),
• Basic (requirements expected and taken for granted, “must-be’s”),
• Excitement (unexpected and pleasant surprises),
• Indifferent (neutral requirements which the customer does not care for), and
• Reverse (requirements which cause dissatisfaction when present and satisfaction when absent),
(Verduyn, 2014).
The model highlights that user preferences change across time, and that providing specific features can
move from the excitement category and into a basic requirement as technology develops and therefore,
such attributes for comfort should be continuously reviewed. It would also be appropriate to acknowledge
the model for different service scenarios and use cases.
The research approaches which have been utilised to explore comfort more broadly have been discussed
in Table 6, (Annex B).
v1.0 | July 2020 20HumanDrive
Measuring the User Comfort of Autonomous Vehicles
Figure 7: Pie chart presenting the main categories and corresponding sub-categories derived from the interviewee
quotes (Nordoff et al, 2019)
v1.0 | July 2020 21HumanDrive
Measuring the User Comfort of Autonomous Vehicles
Figure 8 : The Kano Model (Lee, 2011)
v1.0 | July 2020 22HumanDrive Measuring the User Comfort of Autonomous Vehicles 5. Conclusion and Further Research This review can report that researchers are beginning to explore the ride comfort of AVs, which allows the outputs from the HumanDrive project to complement any existing approaches and findings, enabling engineers, designers and policy makers to make more informed and evidence-based decisions regarding the specification and successful deployment of AVs. Factors found to influence ride comfort for AVs can be comparable to those which may influence passenger or driver comfort in today’s conventional vehicles. However, further consideration into the loss of occupant control and the will of users to engage in non-driving related tasks need to be considered within the design process. There is certainly potential for ride comfort to be managed by the manipulation of the driving style and behaviour, but also via the design of the vehicle and the routing it may take. There is a possibility that one driving style might suit all, with research suggesting that more “defensive” driving styles are more favourable by the vehicle occupants. However, preferences for situation, personality type, gender, age and driving experience could be further investigated to determine whether a range of driving styles should be on offer, and selectable by users. Current research has predominately focused on the experience of the participant in the passenger seat of a conventional vehicle. However, if the occupant of an AV is to engage with a variety of tasks and be seated in a more novel vehicle configuration, the management of ride comfort needs to be further assessed. Further research should also look to establish the wider factors of comfort, how these systematically influence one and another, and how different factors might adapt over time, and by scenario. Current research has mostly been carried out with hypothetical use cases, simulation or demonstrators. We suggest that comfort should be considered in the early stages of the development process for a vehicle design and continue to be tracked as more sophisticated systems are deployed. This is because comfort is likely to be greatly influenced by performance and excitement features, which in time will be expected as a standard feature by the costumer or user. It also appears that there could be opportunity to tailor comfort to the preferences of individuals, or market segments, which may provide a greater array of services and opportunities, both for the end user, and for businesses. v1.0 | July 2020 23
HumanDrive
Measuring the User Comfort of Autonomous Vehicles

6. References
       Ahmadpour N., Robert, J.M. & Lindgaard G. (2016) Aircraft passenger comfort experience:
       underlying factors and differentiation from discomfort. Applied Ergonomics. 52, 301-3018
       Arnett, J. (1994). Sensation seeking: A new conceptualization and a new scale. Personality and
       Individual Differences. 16(2), 289-296
       Bae, I., Moon, J. & Seo, J. (2019) Toward a Comfortable Driving Experience for a Self-Driving
       Shuttle Bus. Electronics. 8
       Bartneck, C., Croft, C. & Kulic, D. (2008) Measuring the anthropomorphism, animacy, likeability,
       perceived intelligence and perceived safety of robots. Proceedings of the Metrics for Human-
       Robot Interaction. Workshop in affiliation with the 3rd ACM/IEEE International Conference in HMN-
       Robot Interaction (HRI 2008), Technical Report 471, Amsterdam 37-44
       Basu, C., Yang, Q., Hungerman, D., Singhal, M. and Dragan, A. (2017) Do You Want Your
       Autonomous Car to Drive Like you? In: 12th ACM/IEEE International Conference on Human-Robot
       Interaction. (HRI, 2017). Pp. 417-425. Vienna
       Bellem, H., Schönenberg, T., Krems, J.F & Schrauf, M. (2016) Objective metrics of comfort:
       Developing a driving style for highly automated vehicles. Transport Research Part F: Traffic
       Psychology and Behaviour. 41(A), 45-54
       Bellem, H., Thiel, B., Shrauf, M. & Krems, J.F. (2018). Comfort in automated driving: An analysis of
       preferences for different automated driving styles and their dependence on personality traits.
       Transport Research Part F: Traffic Psychology and Behaviour. 55, 90-100
       De Looze, M.P., Kuijt-Evers, L.F.M. & Van Dieën, J. (2003). “Sitting Comfort and Discomfort and the
       Relationships with Objective Measures.” Ergonomics. 46(10), 985–997
       Design Council. (2007). 11 lessons: as study of the design process. Online:
       https://www.designcouncil.org.uk/resources/report/11-lessons-managing-design-global-brands
       [01/07/20]
       Diels, C. (2014). Will autonomous vehicle make us sick? In: Contemporary Ergonomics and Human
       Factors, S. Sharples and S. Shorrock (eds.). pp. 301-307
       Elbanhawi, M., Jazar, R. & Simic, M. (2015) In the Passenger Seat: Investigating Ride Comfort
       Measures in Autonomous Cars. IEEE Intelligent Transportation Systems Magazine. DOI:
       10.1109/MITS.2015.2405571
       Ekman F., Johansson, M., Bilgård, L-O., Karlsson, MA. & Strömberg, H. (2019). Exploring automated
       vehicle driving styles as a source of trust information. Transport Research Part F: Traffic Psychology
       and Behaviour. 65, 268-279
       Engelbrecht, A. (2013). Fahrkomfort Und Fahrspaß Bei Einsatz Von Fahrerassistenzsystemen
       [Driving Comfort and Driving Enjoyment When Using ADAS]. Hamburg: Disserta-Verlag

v1.0 | July 2020                                                                                          24
HumanDrive
Measuring the User Comfort of Autonomous Vehicles
French, D., West R., Elander, J. and Wilding, J. (1993) Decision making style, driving style and self-
reported involvement in road traffic accidents. Ergonomics. 36, 672-644
Hartwich, F., Beggiato, M. & Kres, J.F. (2018) Driving comfort, enjoyment and acceptance of
automated driving – effects of drivers’ age and driving style familiarity. Ergonomics. DOI:
10.1080/00140139.2018.1441448
Jian, J.Y, Bisantz, A.M. & Drury, C.G. (1998). Towards an empirically determined scale of trust in
computerized systems: Distinguishing concepts and types of trust. Proceedings of the human
factors and ergonomics society 42nd annual meeting. Volume 1&2, 501-505
Jian, J.Y, Bisantz, A.M. & Drury, C.G. (2000). Foundations for an empirically determined scale of
trust in automated systems. International Journal of Cognitive Ergonomics. 4(1), 53-71
Karlsson B.S.A., Aronsson N., & Svensson, K.A. (2003) Using semantic environment description as a
tool to evaluate car interiors. Ergonomics. 46(13-14), 1408-1422
Kaur, K. & Rampersad, G. (2018). Trust in driverless cars: Investigating key factors influencing the
adoption of driverless cars. Journal of Engineering and Technology Management. 48, 87-96
Keshavarz, B., & Hecht, H. (2011) Validating an efficient method to quantify motion sickness.
Human Factors. 53(4), 415-426
Lee Y.C.H., Lin, S.B. & Wang,Y.L. (2011) A new Kano’s evaluation sheet. The TQM Journal. 23(2),
179-195
Lee, J.D. & See, K.A. (2004). Trust in automation: Designing for appropriate reliance. Human
Factors. 46(1), 50-80
Nordoff, S., Winter, J., Madigan, R., Merta, N. & Arem, B, & Happee, R. (2018) User acceptance of
automated shuttkes in Berlin-Schöneberg: A questionnaire study. Transport Research Part F:
Traffic Psychology and Behaviour. 58, 843-854
Nordhoff, S., Winter, J., Payre, W., Arem, B. & Happee, R. (2019). What impressions do users have
after a ride in an automated shuttle? An interview study. Transport Research Part F: Traffic
Psychology and Behaviour. 63, 252-269
Özkan, T. and Lajunen, T. (2005) Multidimensional Traffic Locus of Control Scale (T-LOC): factor
structure and relationship to risky driving. Personality and Individual Differences. 38, 533-545
Reason, J., Manstead, A., Stradling, S., Baxter, J. and Campbell, K. (1990) Errors and violations on
the roads: a real distinction? Ergonomics. 33(10-11), 1315-1332
Rossner, P. and Bullinger, A.C. (2019). Do You Shift or Not? Influence of Trajectory Behaviour on
Perceived Safety During Automated Driving on Rural Roads. In: Krömker H. (eds) HCI in Mobility,
Transport and Automotive systems. HCII 2019. Lecture Notes in Computer Science. 11596.
Springer, ChamRoth, M., & Mayerhofer, D. (2003). Deutsche Version des Arnett Inventory of
Sensation Seeking (AISS-d). Zusammenstellung sozialwissenschaftlicher Items und Skalen. ZIS
Version 14.00. Bonn: GESIS.
v1.0 | July 2020 25HumanDrive
Measuring the User Comfort of Autonomous Vehicles
Rotter, J.B. (1966). Generalized expectancies for internal versus external control of reinforcement.
Psychological Monographs: General and Applied. 80(1), 1-28
SAE International. (2019). SAE J3016 Levels of driving, SAE Standards News: J3016 automated-
driving graphic update. Online: https://www.sae.org/news/2019/01/sae-updates-j3016-
automated-driving-graphic [26/03/2020]
Slater, Keith (1985). Human Comfort. Charles C Thomas Publishing Ltd
Steen, M., Kuijt-Evers, L. & Klok, J. (2007). Early user involvement in research and design projects –
A review of methods and practices. Paper for the 23rd EGOS Colloquium (European Group for
Organizational Studies) July 5–7, 2007, Vienna
Summala, H. (2007). Towards understanding motivational and emotional factors in driver
behaviour: Comfort through satisficing. In: P.C. Cacciabue ed. Modelling driver behaviour in
automotive environments: Critical issues in driver interactions with intelligent transport
systems, Springer, London. pp. 189-207
Taubman-Ben-Ari, O., Mikulincer, M., & Gillath, O. (2004) The multidimensional driving style
inventory—Scale construct and validation. Accident Analysis & Prevention. 36(3), 323-332
Van Der Laan, J.D., Heino, A., and De Waard, D. (1997). “A Simple Procedure for the Assessment of
Acceptance of Advanced Transport Telematics.” Transportation Research Part C: Emerging
Technologies. 5(1), 1–10
Vegara, M. & Page, A. (2000) System to measure the use of the backrest in sitting-posture office
tasks. Applied Ergonomics. 31(3), 247-254
Venduyn, D. (2013) Discovering the Kano Model [online] available from
[26/03/20]
Venkatesh, V., Morris, M.G., Davis, G.B. & Davis, F.D. (2003) User Acceptance of Information
Technology: Toward a Unified View. MIS Quarterly. 27(3), 425-478
Vink, P. (2005). Comfort and design principles and good practice. Boca Raton, FL: CRC Press
Voss, G.M.I, Herzberger, N.D., Hoffmann, H., Frey, A., & Schwalm, M. (2016). Assessing drivers’
subjectively experienced driving performance – development of a questionnaire. [in preparation].
Voss, G.M.I., Keck, C.M. & Schwalm, M. (2018). Investigation of drivers’ thresholds of a subjectively
accepted driving performance with a focus on automated driving. Transport Research Part F:
Traffic Psychology and Behaviour. 56, 280-292
Waller, S., Bradley., M, Hosking, I., & Clarkson, J. (2015). Making the case for inclusive design.
Applied Ergonomics. 46, 297-303
Warner, H,W., Özkan, T. & Lajunen, T. (2010) Can the traffic locus of control (T-LOC) scale be
successfully used to predict Swedish drivers’ speeding behaviour? Accident and Analysis
Prevention. 42, 1113-1117
Wasser, J., Diels, C. & Tovey, M. (2017). Driverless Pods: From Technology Demonstrators to
Desirable Mobility Solutions. Advances in Intelligent Systems and Computing. DOI: 10.1007/978-3-
319-60441-1_53
v1.0 | July 2020 26You can also read