Measuring Water Clarity and Quality in Minnesota Lakes and Rivers: A Census-Based Approach Using Remote-Sensing Techniques
←
→
Page content transcription
If your browser does not render page correctly, please read the page content below
Measuring Water Clarity and Quality in
Minnesota Lakes and Rivers: A Census-Based
Approach Using Remote-Sensing Techniques
by Patrick L. Brezonik, Leif G. Olmanson, Marvin E. Bauer, and Steven M. Kloiber
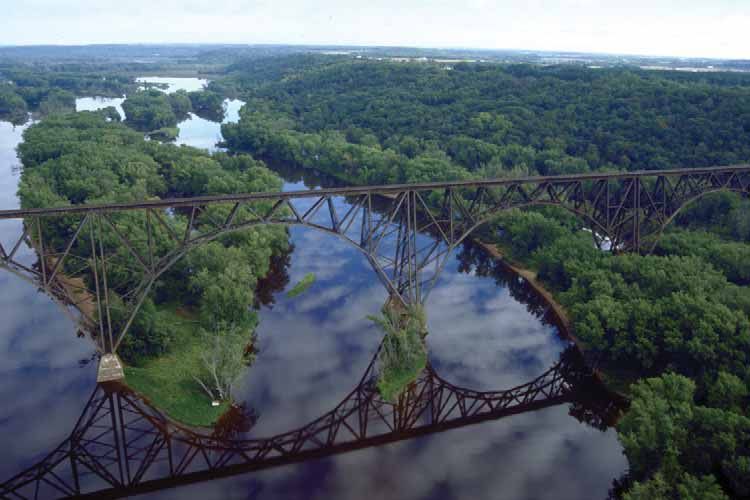
Photo © The Regents of the University of Minnesota. Used with permission of the Metropolitan Design Center.
The St. Croix River near Washington County, Minnesota.
O
ver the past few decades, marvels. Google Earth now provides production, and monitor forest health.
satellite-derived information has detailed images on our television and More recently, the MODIS satellites
become an integral part of our computer screens of far-off places using have been used to estimate terrestrial
daily life. It is difficult to imagine how high-resolution satellite images. In addi- primary production on a continental
crude and inaccurate weather forecasts tion, GPS systems based on satellites scale and to monitor oceanic levels of
would be without the daily satellite now enable even “directionally chal- chlorophyll on a global scale. Satel-
feeds that drive the complex models lenged” drivers to head their cars to the lites also provide essential hydrologic
on which weather forecasts are based, desired destination and make it possible information (e.g., snow pack, rainfall,
and of course the satellite images them- to locate and track people in the most and evapotranspiration estimates)
selves have revolutionized how we view remote and inaccessible locations. for water resources management.
the movement (and scale) of weather Satellite technology also has had Despite many efforts reported in
patterns. Similarly, satellite technology profound impacts on the Earth sciences the scientific literature during the past
has become such an essential and and on science-based management three decades, however, procedures using
commonplace component of global of natural resources. For example, satellite imagery to measure surface
telecommunications, television, and Landsat imagery has been used for water quality have not been adopted on
Internet systems that few give a second several decades to analyze land-use a routine basis. For the past nine years,
thought to the technology behind these and land-cover patterns, estimate crop we have been working with colleagues
SUMMER 2007 3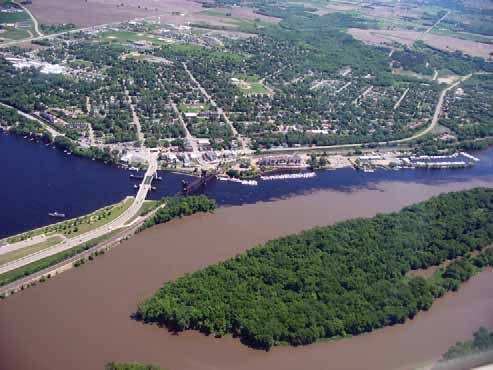
and students to change this state of           algal abundance. Water clarity is useful       image; we found that measurements
affairs and to develop workable proce-         in measuring water quality because             taken within a few days (±3 to 7 days)
dures for routine use of satellite imagery     it relates directly to both human-use          of image acquisition still provide strong
and related technology to assess surface       perceptions of quality (clear water gener-     relationships. This is because water
water-quality conditions by Minnesota’s        ally being preferred, especially for swim-     clarity (Secchi depth) usually does not
water management agencies. Most                ming) and to the abundance of algae.           exhibit large and rapid fluctuations
of our work has focused on lakes and           Thus, water clarity is an indirect measure     in a given lake (although there are
water clarity as a simple measure related      of a lake’s “trophic state”—its status in      strong seasonal patterns in clarity).
to users’ perceptions of water quality.        terms of nutrient concentrations and               The general predictive equa-
However, we also have explored the use         biological productivity. Because of its        tion that we found for water
of satellite imagery to measure other          simplicity, Secchi depth is one of the         clarity estimation has the form:
water-quality characteristics, such as         most frequently measured properties
chlorophyll (a measure of the abundance        of lakes, and many citizen monitoring              ln(SD) = a(TM1/TM3) + b(TM1) + c
of algae in water) and humic matter            programs have been developed over the
(natural derivatives from plants that          past quarter century to supplement the         where a, b, and c are coefficients fit to
produce the brown stain in wetlands            monitoring by government agencies.             the calibration data by the regression
and water draining from forested areas),       Nonetheless, only about 10% of the lakes       analysis, ln(SD) is the natural logarithm
and evaluated the potential of remote-         in the Twin Cities metropolitan area are       of the Secchi depth for a given lake, and
sensing techniques to identify and map         monitored for water clarity in any given       TM1 and TM3 are the brightness values
aquatic vegetation in lakes and wetlands.      year, and in some parts of the state, the      measured by the Landsat sensor in the
We have explored the capabilities and          fraction monitored is much lower.              blue and red bands, respectively, for
limitations of several satellite sensor             In our early studies on poten-            a pre-defined area of the lake surface.
systems, as well as aircraft-mounted           tial applications of satellite imagery         Once coefficients have been fitted to
sensors with high spectral and spatial         to measure surface water quality, we           the equation, it can be used to infer
resolution that provide special capa-          found close correlations between water         Secchi depth values for all other lakes
bilities for remote measurements of            clarity, as measured by the Secchi disk,       in the Landsat image. The images are
water quality in rivers and streams.           and light in the blue and red bands of         approximately 110 miles on a side and
     This article summarizes progress we       the spectrum reflected from lake water         may contain hundreds of lakes and
have made in these areas with emphasis         surfaces and measured as “brightness” by       ponds. The spatial resolution (so-called
on water clarity and provides some             satellite sensors. We used this informa-       pixel size) of brightness data in the
perspectives on the likely future role         tion to develop procedures to estimate         Landsat images is 30 meters (roughly
of satellite- and aircraft-based remote-       water clarity in terms of “inferred Secchi     100 feet) on a side. Because we need
sensing techniques in water resource           depth” using images gathered routinely         to use data only from pixels for water
monitoring and management in Minne-            (every 16 days, assuming no interference       surfaces not affected by land or aquatic
sota. The work described here has been         by cloud cover) by the Landsat satel-          vegetation, the net effect is that the
supported by a variety of state and federal    lites. With financial support from the         procedure is capable of obtaining high-
agencies, including the Metropolitan           Metropolitan Council, our initial studies      quality results on lakes larger than
Council, Minnesota Pollution Control           focused on lakes in the Twin Cities metro      about 20 acres (8 hectares). For the
Agency, Department of Natural Resources,       area, but we later expanded our coverage       seven-county Twin Cities metro area,
Legislative Commission on Minnesota            across the entire state. Colleagues have       which constitutes part of one Landsat
Resources, NASA, and the U.S. EPA. The         applied our techniques for lake clarity        image, this translates to approximately
senior author was the 2003–2004 Fesler-        monitoring in Wisconsin and Michigan,          550 lakes and open-water wetlands.1
Lampert Chair in Urban and Regional            and recently we conducted pilot studies
Affairs, and some of the work described in     to evaluate the usefulness of the tech-        Lake Water Clarity in the Twin Cities
this paper was supported by that position.     nique in Ohio, Indiana, and Illinois.          Metropolitan Area
                                                    Because atmospheric conditions (e.g.,     Our initial studies on the method estab-
Ground and Satellite Measurements of           haze and water vapor content) affect the       lished that it works in a practical sense
Lake Water Clarity                             light reflected by land and water surfaces     and that it provides reliable data not
In essence, clarity measures the distance      as it travels back toward satellite sensors,   otherwise available. Regarding prac-
that light penetrates in a water body.         no universal predictive relationship           ticality, historical Landsat images are
In lakes, water clarity commonly is            exists between water clarity and satellite     available from the EROS Data Center in
measured by a simple device called a           sensor response. Instead, it is necessary      Sioux Falls, South Dakota, for relatively
Secchi disk—a 20-cm (8-inch) diameter          to calibrate the general relationship          low cost (a few hundred dollars), and
white disk—that is lowered into the            applicable to Landsat and Secchi depth         many images are available for free in
water column until it can no longer            data for each Landsat image. We do this        existing local archives. Once the proce-
be seen. The depth of disappearance is         using standard regression procedures and       dure is established for a given region,
called the Secchi depth. Three types of        Secchi depth measurements collected            the processing time per image for an
constituents affect water clarity: algae       by existing monitoring programs on             experienced analyst is less than a week,
and algal-derived particles; natural,          a few lakes (at least 20 and sometimes         and the processing uses software that is
colored organic matter (humic matter);         as many as 100 per image) near the
                                                                                              1
and soil-derived clay and silt particles. In   time the satellite image was taken. The          The above description is a simplification of the
                                                                                              procedures used to convert Landsat data into
Minnesota lakes, soil-derived turbidity        ground-based Secchi depth data do
                                                                                              inferred lake clarity (Secchi depth) values. Details
usually is not important, and water            not need to be collected at exactly the        on the method are found in a manual available
clarity most commonly is related to            same time that Landsat acquires an             online at http://water.umn.edu.

4 CURA REPORTER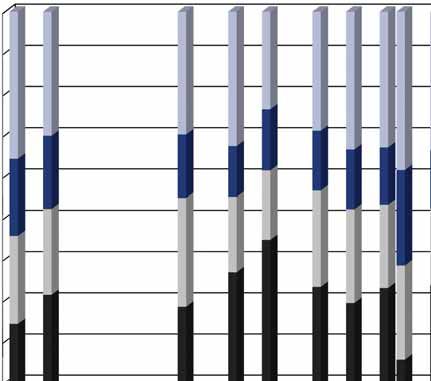
readily available in remote-sensing labo-     Figure 1. Water Clarity (SD) for Twin Cities Metropolitan Area Lakes (inferred from
ratories. A search of historical archives     Landsat TM image), September 1998
showed that at least one cloud-free
image is available for the Twin Cities
metro area nearly every year for a late-
summer index period (late July to early
September), which we found to be the
optimal time to assess water clarity in
Minnesota lakes. Regarding data reli-
ability, R2 values (a measure of goodness
of fit) for the regression relationships to
establish the coefficients of the predic-
tive equation normally are in the range
of 0.8 to 0.9, meaning that they explain
80 to 90% of the variance in the relation-
ship, and occasionally they are as high
as 0.95 (95% of the variance). Given that
ground-based measurements of Secchi
depth are themselves subject to some
imprecision, we consider this to be quite
acceptable. In addition, excellent agree-
ment between satellite-estimated and
ground-observed Secchi depth trends can
be achieved. For example, Secchi depth
temporal trends during the 25-year
record were found to be virtually iden-
tical in several metro-area lakes for which
long-term ground-based data were avail-
able to compare with Landsat-inferred
results. For Coon Lake (Anoka County),
Secchi depth was found to increase at
a rate of 0.062 m per year during the
period 1973–1998 based on in-lake
measurements, and a best-fit regression
equation of the satellite-inferred Secchi
depth yielded an increase of 0.067 m
                                              Note: One (1) meter equals 3.3 feet.
per year during the same time period.
    In subsequent studies on water clarity        Results for 1998, the last year in this   and higher clarity in many lakes. The
in metro-area lakes, we were interested in    initial analysis (Figure 1), demonstrate      1996 image was acquired in mid-July,
evaluating spatial and temporal patterns      that at any given time lakes in the           just outside the late-summer window
in lake clarity. Specifically, we wanted to   metro area exhibit a wide range of water      that we found best represents the period
answer the following questions: (1) Does      clarity. Analysis of the temporal trend       of lowest water clarity in Minnesota
lake water clarity in the metro area vary     results shown in Table 1 indicates that       lakes, and this also may explain the
depending on climatic conditions, such        climatic conditions have an important         higher water clarity values in that year.
as extended periods of drought or above-      influence on water clarity in the region’s        Several statistical tests were used
average precipitation?; (2) Can long-term     lakes. For example, 1988, which was           to examine temporal differences
trends in water clarity of metro area lakes   one of the hottest and driest summers         and trends across years in lake water
be related to well-documented changes         on record in the region, had the highest      clarity. A Kruskal-Wallis test showed no
in land-use/cover within the region?;         fraction of lakes in the lowest clarity       significant differences in metro-area
and (3) How strong are the relation-          class and one of the lowest fractions         regional lake water clarity between
ships between lake clarity and land-use/      of lakes in the highest clarity class         the years 1983, 1986, 1991, 1995,
land-cover conditions in the landscape        among all the study years. Hot sunny          and 1998, but water clarity was below
around lakes? To address these questions,     weather, combined with low rainfall           normal in 1973 and 1988 and above
we first analyzed a series of 10 images       that produced little flushing of water        normal in 1975, 1993, and 1996.
from the late-summer index period             through the lakes, yielded heavy algal            Although no simple long-term trend
covering a 25-year interval (1973–1998).      blooms and low water clarity in many          in lake water clarity was detected at the
Ground-based calibration data were            lakes. In contrast, 1993 and 1996, which      scale of the entire Twin Cities metro
obtained for each image, primarily from       were wet and relatively cool summers,         area, a Kendall Tau-b analysis for each of
the Metropolitan Council’s citizen moni-      had low fractions of lakes in the lowest      the approximately 500 metro-area lakes
toring program, and Landsat-inferred          clarity class and high fractions in the       with sufficient data to conduct a trend
Secchi-depth values were obtained by          highest clarity class. The combination        analysis indicates that 49 lakes (10%
the procedures described above for            of cooler temperatures, less sun, and         of the total) had significant temporal
approximately 575 lakes and open-water        greater flushing of water through the         trends. Water clarity improved in 34
wetlands in the Twin Cities metro area.       lakes resulted in lower amounts of algae      lakes since 1973 and declined in only

                                                                                                                      SUMMER 2007 5
Table 1. Water Clarity Trends for Twin Cities Metropolitan Area Lakes, 1973–1998
Number of lakes, by month and year
Secchi
Depth (SD)
July Aug Sept Aug Aug Sept Aug July July Sept
1973 1975 1983 1986 1988 1991 1993 1995 1996 1998
> 4 meters 7 4 14 0 3 0 0 1 4 0
(1.6%) (1.0%) (3.2%) (0.0%) (0.6%) (0.0%) (0.0%) (0.2%) (0.8%) (0.0%)
2–4 meters 94 79 61 94 77 75 68 86 118 96
(21.1%) (18.9%) (14.0%) (19.5%) (16.4%) (15.5%) (14.0%) (17.7%) (23.9%) (19.7%)
1–2 meters 192 165 182 160 120 187 218 192 245 184
(43.2%) (39.6%) (41.7%) (33.3%) (25.5%) (38.6%) (45.0%) (39.6%) (49.6%) (37.8%)
0.5–1 meter 122 137 114 168 168 173 144 151 104 149
(27.4%) (32.9%) (26.1%) (34.9%) (35.7%) (35.7%) (29.8%) (31.1%) (21.1%) (30.6%)
< 0.5 meter 30 32 65 59 102 49 54 55 23 58
(6.7%) (7.7%) (14.9%) (12.3%) (21.7%) (10.1%) (11.2%) (11.3%) (4.7%) (11.9%)
Total 445 417 436 481 470 484 484 485 494 487
Note: One (1) meter equals 3.3 feet. Column percentages may not total 100% due to rounding.
15 lakes. The most common trend (43% adopted the procedure and is conducting brightness signatures from 19 lakes with
of lakes with trends) was an increase annual assessments of water clarity in Secchi depth measured within three days
in clarity of 4 to 8% per year. Lakes metro-area lakes. Results for 2003, 2004, of the image date yielded a strong fit
with decreasing clarity generally were and 2005 are available from MCES. to the equation model described earlier
small or quite shallow, suggesting that (R2 = 0.82, meaning that the relationship
morphometry (the physical shape and Water Clarity in Ponds and Small Lakes explains more than 80% of the varia-
size characteristics of a lake) may predis- The relatively modest spatial resolu- tion in the data). We created a pixel-level
pose a lake to respond more strongly to tion of the Landsat sensor (30 m) limits map of water clarity of small lakes and
changes in natural or human-induced the usefulness of Landsat imagery to ponds in Eagan, as shown in Figure 2.
stresses. The finding that more lakes assess water clarity conditions in small Only 14 of Eagan’s 375 lakes, ponds,
had improving rather than worsening lakes and ponds. Newer commercial and wetlands were large enough to be
clarity during the 25-year record at satellites with spatial resolution (pixel included in our previous metro-area
first was surprising, given the major sizes) of 1 to 4 meters overcome this assessments and 22 were included in our
geographic expansion of the Twin Cities limitation and allow assessment of statewide assessments (see below), but
footprint that occurred during that water clarity in neighborhood ponds the IKONOS image assessed 236 water
time period. However, suburban sprawl much smaller than an acre in area. Two bodies. The wide range of water clarity in
has occurred largely at the expense of such commercial satellites, IKONOS small ponds within a small geographic
agricultural lands rather than more and Quickbird, are the primary sources area is striking and likely reflects both
pristine forested areas, and croplands of the amazing aerial images shown natural factors (pond depth and water-
often produce higher levels of nutri- increasingly in television news broad- shed area) and effects of landscape use
ents in storm-water runoff than do casts and the imagery that provides the and management practices. We found
suburban residential areas. Moreover, basis for Google Earth. Both satellites similar results for images obtained in
the salutary effects of efforts to manage have sensors similar to the Landsat TM 2001 and 2002. The cost of IKONOS
the quality of urban and suburban sensors in spectral characteristics (e.g., data ($2,500 to $4,000 per image) prob-
storm-water runoff, and also to directly three broad bands in the visible spec- ably would be too large for many cities
manage water-quality conditions in trum and one in the near infrared). just for lake-clarity assessments, but
lakes, should not be discounted. Figure 2 shows an image for Eagan, should be justifiable if the images also
Since the studies described above Minnesota, acquired on August 23, are used to monitor changes in land
were completed, we have continued to 2000, by the IKONOS satellite. The use, land cover, and wetland status.
assess lake water clarity across the Twin city of Eagan, located in the south-
Cities metro area. Additional informa- eastern metro area (just southeast of Statewide Census-Level Assessment of
tion for 2000, 2003, and 2005 is available the Minneapolis–St. Paul Airport) and Lake Water Clarity
on the “Twin Cities Lake Browser” (see roughly 6 by 6 miles (about the size of Starting in 2000, we expanded our
http://water.umn.edu), through which an IKONOS image), has about 375 small analysis of lake water clarity in Minne-
one can locate individual lakes of interest lakes, ponds, and open-water wetlands sota from the metro region to the
and obtain data for the entire period greater than one acre in area. The image entire state. Since that time, we have
of record. Perhaps more significant is was processed using the basic proce- completed five censuses at approxi-
the fact that the Metropolitan Council dures we developed for Landsat imagery. mately five-year intervals for the 20-
Environmental Services (MCES) has Multiple regression analysis of the year period 1985–2005. Each census
6 CURA REPORTERFigure 2. IKONOS Image Showing Water Clarity for Lakes and Ponds in Eagan, Minnesota, August 23, 2000
0 1 2 3 4 5 6
Miles
comprises information on more than Landsat images for parts of the state spatial and temporal trends. Figure 3
10,000 lakes and open-water wetlands during the late-summer measurement illustrates the distribution of lake water
across the entire state of Minnesota. period, the statewide censuses usually clarity across the state for the year 2005
The techniques used to produce these are composites of analyzed images (a similar image for 2000 is available
results are similar to those we devel- acquired within plus or minus one from the authors as a large poster suit-
oped for the metro-area assessments. year of the nominal year for a census. able for framing and classroom use),
For the statewide assessments, we We currently are in the process of and Table 2 summarizes temporal trends
generally sought Landsat images where analyzing this data set, which we believe in the numbers of Minnesota lakes in
ideally each entire path across the state is unprecedented in size and scope, for different water-clarity classes for the
yielded useable information (clear
skies). Landsat orbits Earth such that it Table 2. Water Clarity in Minnesota Lakes Based on Landsat-Inferred Secchi Depth
traverses Minnesota in southwest-to- (SD), 1985–2005
northeast paths that are approximately
110 miles wide, and the trajectory is Number of lakes, by year
Secchi
such that successive paths partially Depth (SD)
overlap. By using entire paths across the 1985 1990 1995 2000 2005
state rather than single images, we were
> 4 meters 1,043 1,213 1,059 909 1,254
able to extend the geographic range
with available ground data for calibra- 2–4 meters 4,917 3,981 4,649 4,641 4,363
tion purposes; some remote areas in
northern Minnesota, for example, have 1–2 meters 3,080 3,150 3,356 2,637 3,091
very limited ground-based measure-
ments. The overlapping nature of the 0.5–1 meter 1,627 1,898 1,670 1,729 1,902
Landsat paths also meant that multiple
satellite-inferred Secchi depth measure- < 0.5 meter 469 490 254 600 631
ments were obtained for approximately
60% of the state’s lakes in each census. Total 11,136 10,732 10,988 10,516 11,241
Because clouds sometimes obscure
Note: One (1) meter equals 3.3 feet.
SUMMER 2007 7Figure 3. Landsat-TM–Based Census of Water Clarity in Minnesota Lakes, 2005 record (through 1998). However, when
the entire 32-year study period is exam-
ined, no simple linear trend is apparent
regarding the extent to which metro-area
lakes support swimming. Instead, a cyclic
pattern is evident that may be related
to climatic conditions. For example, the
fraction of lakes in the non-supporting
category reached a maximum in the
late 1980s, corresponding to the end of
a long-term drought, and a minimum
in the mid-1990s, corresponding to a
period of above-average rainfall in the
region. The fraction of lakes in the fully
supporting category showed the opposite
trend (minimum in the late 1980s and
maximum in the mid-1990s). Thus, it
appears that climatic conditions play an
important role in the temporal pattern
of lake water clarity at the region scale.
With the larger database available from
the statewide censuses, we also have been
able to examine relationships between
lake clarity and land-use/land-cover
conditions in the surrounding terrestrial
landscape, a goal we were not able to
achieve in our earlier studies focused
only on the Twin Cities metro area.
For example, contrasts in land use/land
cover among the three largest eco-
regions in the state (Figure 5) are
obvious, and patterns of lake clarity
appear to reflect these differences. The
Northern Lakes and Forests (NLF) eco-
region in northeastern Minnesota
is more than 60% forested and only
roughly 6% agricultural; the Western
Cornbelt Plains (WCP) ecoregion in
southern Minnesota is only 4% forested,
period of record. Overall, the distribution classes based on water clarity over the and agricultural land occupies more
of lakes across the water-clarity classes extended period of record, 1973–2005. than 80% of the region; and the North
is fairly stable throughout the 20-year The Minnesota Pollution Control Agency Central Hardwood Forest (NCHF) ecore-
period 1985–2005, but a few differences developed criteria for these use-support gion in the center of the state has inter-
stand out. For example, substantially classes based on algal bloom problems mediate land-use/land-cover conditions
fewer lakes were found in the lowest associated with various concentrations of (12% forested and 50% agricultural
water clarity class (< 0.5 m) in 1995 total phosphorus (TP) in lakes. Based on land). Reflecting these ecoregion differ-
than in all other years, and in 2000 established relationships between TP and ences, water clarity in NLF lakes aver-
there were fewer lakes with water clarity Secchi depth, we converted the criteria ages slightly more than 3 m, and about
values in the 1 to 2 m range but more into equivalent Secchi depth values. For 70% of the lakes have values in the 2 to
lakes with values in the 3 to 4 m range example, a TP concentration of about 80 4 m range. In contrast, water clarity
than in other years. Information on micrograms per liter (µg/L) corresponds in WCP lakes averages just less than
trends in lake clarity for individual coun- to a Secchi depth of 0.62 m (or 2.0 ft) 1.0 m, and only about 8% of the lakes
ties and across Minnesota’s ecoregions in lakes where phosphorus controls the in this region have clarity values in
can be found at http://water.umn.edu, growth of algae. Lakes with higher TP the 2 to 4 m range (and very few have
and the “Lake Browser” on this site concentrations (hence, lower Secchi values greater than 4 m). Lakes in the
allows users to locate individual lakes depth values) than that are considered NCHF exhibit a wide range of clarity,
across the state and obtain water to be “non-supporting” (that is, unfit) but the average value is about 1.5 m,
clarity and other information. for swimming because they have a high and roughly 40% of the lakes have
Of interest regarding the statewide frequency of nuisance algal blooms. clarity values in the 1 to 2 m range.
census information is how it extends The results in Figure 4 suggest a gradual Of course, other factors aside
the earlier information on lake clarity trend in the fraction of metro-area lakes from land use/land cover affect lake
within the Twin Cities metro area. in the non-supporting category during clarity—water column depth, under-
Figure 4 shows the distribution of TCMA the first half of this decade, compared lying geology, and population density
lakes in four “swimming use-support” with results for the end of the earlier in lake catchments also play important
8 CURA REPORTERFigure 4. Swimming Use Support for Twin Cities Metropolitan Area Lakes, 1973–2005
100%
90%
80%
70%
60%
Full
50% Full (Marginal)
Partially Impaired
40% Non-Supporting
30%
20%
10%
0%
Note: Swimming use support based on water clarity (Secchi depth, SD). SD values defining the use-support classes are as follows: full, > 1.60 meter; full (marginal), 1.21–1.60
meter; partially impaired, 0.80–1.20 meter; non-supporting, < 0.80 meter. One (1) meter equals 3.3 feet.
roles. In general, lakes in the NLF tend Aircraft-Based Remote Sensing of Water offer an attractive possibility for moni-
to be deeper than lakes in the WCP, Quality in Rivers and Streams toring river water quality and obtaining
and geology and climate are important Satellite imagery works well to assess more complete spatial coverage than is
factors that predispose the NLF to be water clarity and related optical proper- possible with ground-based sampling.
much more forested than the WCF. ties of lakes (such as chlorophyll and To explore the usefulness of this tech-
Striking relationships between humic color), but geometric consider- nique, we conducted a series of studies
lake water clarity and land use/cover ations make satellite imagery a poor in the summers of 2004 and 2005 on
also were found when the data were choice for remote sensing of rivers and rivers in the Twin Cities metro area
examined at the county level (Figure streams. As they pass through the Twin and nearby areas using a small plane
6). Across Minnesota counties, average Cities metro area, only large rivers like and sensor system operated by the
lake clarity increases with increasing the Minnesota and Mississippi Rivers are University of Nebraska. In contrast to
percentages of forested land and wide enough to have pixels representing the Landsat TM and IKONOS sensors,
decreases with increasing percentages water surfaces that are not affected which have only a few, broad spec-
of agricultural and urban land. The by shoreline and land surfaces. High- tral bands, the sensors we used in the
rate of decrease with degree of urban resolution satellites like IKONOS do have aircraft studies collected reflected light
land is especially dramatic; average lake the required spatial resolution, but acqui- in many (narrow) spectral bands, and
clarity declines to only about 1.0 m sition of such images for a particular this provided much better opportunities
(3.3 ft) at 10% urban land in a county. date and time is not a straightforward to develop stronger predictive relation-
Others have reported similar effects of proposition, and the relatively small ships for various optically related water-
urbanization and extent of impervious areas these images cover lead to impracti- quality characteristics. Support for this
area on the biotic integrity of streams. cally large costs per river mile monitored. work was provided by the Legislative
Digital map layers delineating indi- Multispectral sensors similar to Commission on Minnesota Resources
vidual lake catchments are becoming those in satellites like Landsat and through the Minnesota Pollution
available for Minnesota, and it will be IKONOS (or with higher spectral reso- Control Agency (MPCA), and collec-
interesting to see whether relationships lution) that are deployable in small tion of ground-based calibration data
with lake clarity improve when land- aircraft are commercially available. was achieved by a collaborative effort
use analyses are conducted at the scale Because aircraft can be flown precisely of the MPCA and the Metropolitan
of individual lake catchment areas. on flight paths along river reaches, they Council Environmental Services.
SUMMER 2007 9Figure 5. Land-Use/Land-Cover Distribution and Water Clarity in Three Minnesota Ecoregions
Northern Lakes North Central Western Cornbelt
and Forest Hardwood Forest Plains
Ecoregions
Water Wetland
1.2% 0.9%
Forest Deciduous Shrubland
Urban Shrubland 3.7% 0.6%
Wetland Urban
0.9% Agriculture 4.6%
5.2% 4.6% Forest Coniferous Urban
6.1% 0.1% 1.6%
Wetland Grassland
4.1% 5.4% Water
6.1%
Shrubland Grassland
13.5% 9.2%
Land Uses
Water
8.9% Forest Coniferous Forest Deciduous
18.0% 10.9%
Agriculture
49.5%
Grassland Agriculture
18.2% 82.7%
Forest Deciduous
42.9%
Forest Coniferous
0.8%
4000 1600 350
Number of Lakes
3500 1400 300
3000 1200
250
2500 1000
200
2000 800
150
1500 600
100
1000 400
500 200 50
0 0 0
> 4.0 2.0–4.0 1.0–2.0 0.5–1.0 < 0.5 > 4.0 2.0–4.0 1.0–2.0 0.5–1.0 < 0.5 > 4.0 2.0–4.0 1.0–2.0 0.5–1.0 < 0.5
Water Clarity Ranges (meters)
Source: Land-cover data are from 1990 Minnesota Land Cover GAP. Secchi depth data are from 2000.
Note: One (1) meter equals 3.3 feet.
10 CURA REPORTERFigure 6. Relationship between Average Secchi Depth (SD) for Lakes in each Minne- Procedures used to obtain and
sota County and Percentage of Forested, Agricultural, or Urban Land analyze data from the aircraft-mounted
sensor were generally similar to those
4 we have been using for satellite data.
Because of the high degree of spatial
Countywide Average Secchi Depth (m)
3.5 and temporal variability in optical
properties (such as turbidity, water
3 clarity, and chlorophyll concentra-
tions) of flowing waters, collection
2.5 of water samples from the rivers was
y = 0.28x + 0.97 coordinated to occur near the same
2 R² = 0.64 time as the aircraft overpass. Water
clarity was measured on river samples
1.5 using a Transparency Tube (T-tube) that
provides data analogous to Secchi depth
1 but is easier to use in flowing waters.
Statistically strong relationships were
0.5 found between ground-based measure-
ments of water-quality characteristics
0 and the brightness of light at specific
0 20 40 60 80 100 wavelengths collected by the aircraft-
Percent Forest mounted sensor (R2 = 0.94 for T-tube
water clarity and 0.72 for chlorophyll a).
4 The exploratory studies were
successful and yielded maps for several
Countywide Average Secchi Depth (m)
3.5 optically related water-quality character-
istics, including turbidity, water clarity,
3 suspended solids, and chlorophyll,
along several major river reaches in the
2.5 region. Typical results are shown in
Figure 7, which illustrates the distribu-
2 tion of water clarity (a) and chlorophyll
(b) along a stretch of the Mississippi
y = -0.023x + 3.17
1.5 River starting at highly turbid Spring
R² = 0.73
Lake (above Lock and Dam No. 2)
1 near Hastings, Minnesota. The influ-
ence of water low in suspended matter
0.5
from the St. Croix River on clarity in
the Mississippi River is apparent, and
0
the figure shows that water clarity
0 20 40 60 80 100
improved further as suspended matter
Percent Agriculture + Urban settled out over a distance of about
3 to 4 miles from the confluence of
4 the St. Croix. Chlorophyll levels were
very high in parts of Spring Lake (but
Countywide Average Secchi Depth (m)
3.5 spatially highly variable) and the Missis-
sippi River downstream of the lake,
3 y = -0.29x + 3.31 but concentrations decreased mark-
R² = 0.56
edly after confluence with the cleaner
2.5 waters of the St. Croix River. As illus-
trated in Figure 7, in typical ground-
2 based routine monitoring programs on
rivers, one or perhaps a few sampling
1.5 locations along the river would be
sampled and the high spatial variability
1 of water quality would be missed.
0.5 Concluding Comments: Prospects for
the Future
0
Effective management of natural
0 20 40 60 80 100
resources depends on accurate and
Percent Urban complete information, as well as an
informed public. We view the remote-
Note: One (1) meter equals 3.3 feet. Trend line for urban area is based only on counties with urban area < 11%. sensing techniques for information
SUMMER 2007 11Figure 7. Spatial Distribution of (a) Water Clarity Measured by a T-tube and (b) Total Chlorophyll a in the Mississippi River from Spring Lake to Downstream of the Confluence with the St. Croix River Note: Based on aircraft-based imagery collected August 19, 2004. 12 CURA REPORTER
Photo courtesy of the Minnesota Pollution Control Agency
Science Foundation since August 2004. His
research focuses on understanding human
perturbations on biogeochemical cycles of
nutrients and metals in aquatic systems,
and applications of remote sensing to
regional-scale assessment of water quality.
Leif G. Olmanson is a research fellow in
the Department of Forest Resources and
the Remote Sensing and Geospatial Anal-
ysis Laboratory at the University of Minne-
sota, and a Ph.D. student in the Natural
Resources Science and Management
Program. His research focuses on devel-
opment of satellite imagery and aircraft-
based remote-sensing tools to measure
the status and trends of ecological condi-
tions in lakes, rivers, and wetlands. Marvin
E. Bauer is a professor in the Department
of Forest Resources and director of the
Remote Sensing and Geospatial Analysis
Laboratory at the University of Minne-
sota. His research focuses on applications
of digital remote sensing to inventory,
monitor, and analyze land, vegetation,
and water resources. Steven M. Kloiber
This photo shows the dramatic difference in water clarity at the confluence of the
St. Croix River (blue water) and the highly turbid Mississippi River. is a senior planner with the Metropolitan
Council Environmental Services in St. Paul.
gathering on surface water described in tion. Development of techniques for His Ph.D. dissertation in civil engineering
this article as tools that will help achieve automated correction of satellite data on the application of satellite imagery to
both of these goals. Satellite imagery to account for atmospheric effects measurement of lake water clarity trends
provides a cost-effective means to obtain should be possible, and this would in the Twin Cities metro area provided a
comprehensive spatial coverage on the eliminate the need to gather ground- foundation for our research. His current
status and trends in key characteristics based calibration data for every image. research focuses on understanding the
of surface-water quality, and the results Our recent work with aircraft- impacts of urban and suburban devel-
can be made readily available to the mounted sensors is especially promising opment on surface water quality and
public in easily understood formats. in that it provides a means of gath- nutrient export from watersheds.
Of course, these methods cannot tell ering spatially comprehensive infor- The research upon which this article
us everything we would like to know mation on water quality in rivers and is based was supported in part through
about water quality; satellite sensors streams heretofore not practical with funds provided by the Fesler-Lampert
cannot detect the presence of poten- ground-based sampling programs. Such Chair in Urban and Regional Affairs, one
tially harmful metal pollutants, organic comprehensive information, as shown of four endowed chairs and two named
pollutants, or bacterial pathogens in for the Mississippi River in Figure 7, professorships made possible through a
water. However, the sensors do provide could be used to provide much more generous contribution to the University
accurate information about water clarity robust validation of models used to of Minnesota by David and Elizabeth
and the occurrence of algal blooms in forecast water-quality conditions than Fesler. The Fesler-Lampert Endowment
water, and these are common issues current ground-based methods allow. in Interdisciplinary and Graduate Studies
affecting the usability as well as the Moreover, the compelling nature of was initially established in 1985 to
economic value of Minnesota lakes. the visual images themselves should stimulate interdisciplinary research and
Scientists in other states have help both scientists and the public to teaching through the appointment of
adopted the methods we developed to gain a deeper appreciation and better distinguished, broadly learned schol-
study Minnesota lakes, and resource understanding of our aquatic resources. ars to endowed faculty positions at the
management agencies in Minnesota University of Minnesota. Additional sup-
and elsewhere are starting to adopt Patrick L. Brezonik is a professor in port was provided by the Metropolitan
these same methods as routine. Pros- the Department of Civil Engineering at Council, Minnesota Pollution Control
pects for future improvements of the the University of Minnesota and held Agency, Department of Natural Resources,
techniques are bright, because satellite the Fesler-Lampert Chair in Urban and Legislative Commission on Minnesota
sensors likely to be developed during Regional Affairs in 2003–2004. He has been Resources, National Aeronautics and Space
the next decade should provide better on leave serving as program director for Administration (NASA), and the U.S.
spectral, spatial, and temporal resolu- environmental engineering at the National Environmental Protection Agency (EPA).
SUMMER 2007 13You can also read