MEDICAL EVALUATION OF TTM: PRESENT AND EXPECTATION
←
→
Page content transcription
If your browser does not render page correctly, please read the page content below
Proceedings of the International Conference on Non-Ionizing Radiation at UNITEN (ICNIR 2003)
Electromagnetic Fields and Our Health
20th -22nd October 2003

        MEDICAL EVALUATION OF TTM: PRESENT AND
                    EXPECTATION
                                          Zhongqi Liu
      Professor of the Department of Life Science and Bio-Engineering, Beijing Industry
                                           University
                    President of Bioyear (Beijing) Medical System Co., Ltd
               Address: Dong Sanmen Haidian Stadium,Beijing 100080,China
       Tel:008-610-62549887/91, Fax:008-610-62549890, E-mail: bbym@bioyear.net

                                            ABSTRACT

This paper is an introduction to Thermal Texture Maps (TTM), starting from the end of the
80’s to the present, topics covered will be basic theory, medical and other fields’
                                                                                  application.
It will also discuss TTM’     s present technical problems and the expectation of TTM
applications in this new century; proliferation of TTM technology in industrial engineering,
military and medical fields and revolutionary consequences in human health model.

                                            KEYWORDS

TTM, human health model, important revolution

                                         INTRODUCTION

Due to the progress of society and increasing health concerns, the health issue is becoming
important. However, thousands of years in the medical field practically presented us with the
fact that humans played a passive role in the process of fighting diseases. We may keep track
of some diseases by resorting to modern medicine. However, we are not content and still
lagged far behind in understanding the root cause, initial and early detection, link between
diseases and the organization of the human body, treatment and monitoring. The above-
mentioned unsatisfied answers to diseases led to the birth of innovative TTM evaluation
technology. TTM evaluation technology mainly concerns the living cells’      function. Unlike
other imaging techniques such as CT and MRI that primarily provide information on the
anatomical structures, TTM is more sensitive and provides functional information not easily
measured by other methods. In addition, the technology is based on the detection of heat
radiation generated by metabolic activities of living cells; it is non-invasive, non-hurt and
environmental friendly technology. Therefore, the emotion of a human being will not affect
the wide deployment of TTM evaluation technology.

                           DEVELOPMENT AND STAGE OF TTM

Functional medical imaging technology is a mainstream in the technological world in these
few decades to unleash a method that can totally change the conflict between human beings
and diseases. The end of 1990’   s witnessed the breakthrough brought about by a group of
researchers in China who did exceptional research in CT, MRI and U/S. They were the ones
who were initiating the research of TTM. After a large chunk of data having been collected
and analyzed, finally the research group accepted the detection of radiation heat generated by

                                                   1
Proceedings of the International Conference on Non-Ionizing Radiation at UNITEN (ICNIR 2003)
Electromagnetic Fields and Our Health
20th -22nd October 2003

human body cells’   metabolic activities as one of the medical imaging technologies: the birth
of TTM. In 1995 Bioyear was incorporated, after 8 years of continuous R&D work, the
relationship between the surface temperature distribution and internal heat source of the
human body was initially established. In 1997, US-based Bioyear company was incorporated,
then the first Thermal Infrared (TIR) imaging scanner with slicing capability was
manufactured. Also, a series of Thermo-Scanner Imaging (TSI) products was manufactured
and shipped to Chinese hospitals. In 1998, a brand new TSI system that adopted uncooled
Infra-Red detector was shipped to China, US and Canadian hospitals for clinical studies. In
1997, application for a patent of TTM technology was made to Food & Drug Administration
(FDA) of US and 93 other countries’      patent offices for patent protection. The patent was
granted by the US on February 2, 2000. During a conference held in Houston, U.S., experts
named the thermal infra-red imaging slicing technology as Thermal Texture Maps,
abbreviated as TTM. The first partial public announcement of TTM technology took place at
the special event “From Tanks to Tumors: A Workshop on the Application of IR Imaging and
Automatic Target Recognition (ATA) Image Processing for Early Detection of Breast
Cancer,”  held in Arlington, Virginia, U.S., 4-6 December 2001.

This Workshop was jointly sponsored by the Office of the Deputy Undersecretary of Defence
(S&T-Sensor Systems), Office of the Deputy Assistant Secretary of the Army for
Installations and Environment (Environmental Safety and Occupational Health), The Army
Research Office (ARO), and the Defense Advanced Research Project Agency (DARPA). On
8-11 March, 2002, Science Daily News Paper, China was covering a special report on TTM
technology. On 4-6 July, 2002, at the IEEE-BM IMAGE conference, TTM technology was
for the first time fully introduced to the public. Later, at the IEEE-BM and IEEE-MBE
conferences, TTM technology was for the second time introduced to the world while at the
same time having their technical talks and training workshops. In December 2002, a
workshop for training TTM technology was held at the National Institutes of Health (NIH),
one of the agencies of the Public Health Services which, in turn, is part of the U.S
Department of Health and Human Services. From 23 to 25 September, 2003, the first
International Conference of TTM technology in Medicine and Engineering was held at
Houston, Texas, U.S.

In China, to speed up the deployment of TTM technology, the uppermost level of a specially
tailored conference was held; the Xiangshan Science Conference. To date, more than 100
medical units in China are equipped with TTM facilities. Since 2001, NIH has been using
TTM technology for skin cancers. The results achieved are encouraging. At the end of 2002,
NIH used TTM technology to monitor the efficacy of breast cancer treatments. At the
beginning of 2003; during the SARS outbreak, under the guidance of China Foreign Affairs
and Ministry of Health leadership, and the recommendation of Wang Ta Xing, Zheng Yi, Ma
Jing Lo and others, hospitals in Beijing, China like You An, Xiong Ke, and De Tan hospitals
strongly supported the use of TTM technology in clinical studies against SARS. Significant
results had been achieved then. At present, mass production of TTM scanners is under
consideration in order to bring the technology to the benefit of human health as soon as
possible.

                                                   2
Proceedings of the International Conference on Non-Ionizing Radiation at UNITEN (ICNIR 2003)
Electromagnetic Fields and Our Health
20th -22nd October 2003
TTM THEORY AND APPLICATION IN EARLY
BREAST CANCER DIAGNOSIS
EARLY RESEARCH
Temperature is a long established indicator of health. The Greek physician, Hippocrates,
wrote in 400 B.C. that “ In whatever part of the body excess of heat or cold is felt, the disease
is there to be discovered.” The ancient Greeks immersed the body in wet mud and the area
that dried more quickly, indicating a warmer region, was considered the diseased tissue [4],
[10]. Before Galileo invented thermoscope, the ancient Egyptians used fingers as scanners to
monitor the surface temperature of the human body [10]. Modern development of the
temperature measurement has been in the area of TIR imaging which does not need body
contact Infrared (IR) radiation occupies the region on the electromagnetic spectrum between
the visible and microwaves. All objects in the universe emit radiations in the IR region as a
function of their temperature. As an object gets hotter, it gives off more intense infrared
radiation, and it radiates at a shorter wavelength [3]. Human eye cannot detect IR rays, but
they can be detected using the thermal infrared cameras and detectors. TIR imaging has been
applied to wide spectra of applications, ranging from the military, industrial engineering, to
modern medicine. It is non-invasive and non-destructive, which makes it a valuable tool to
assist diagnosis.
The application of IR imaging in breast cancer study started as early as 1961 when Williams
and Handley first published their results in the Lancet [7]. However, “ the ill-conceived and
poorly controlled introduction of IR imaging into the Breast Cancer Detection Demonstration
Projects (BCDDP)” 30 years ago has led to its early demise [5]. IR-based diagnosis was
criticized for generating a higher false-positive rate than mammogram, and thus was not
recommended as a standard modality for breast cancer detection. We argue that one of the
major problems that existed in the early study of IR imaging was the prevalence of some
superficial understanding of the generation of IR images. Conclusions such as “ the resulting
IR image contains only a small amount of information as compared to the mammogram, so
that the reading of the IR image is a substantially simpler task [11]” shows severe
misinterpretation of the thermogram.
Unlike imaging techniques such as X-ray radiology and CT that primarily provide
information on the anatomical structures, IR imaging provides functional information not
easily measured by other methods [3]. Thus a correct use of IR images requires an in-depth
physiological knowledge for its effective interpretation.
All objects at a temperature above absolute zero emit electromagnetic radiation
spontaneously, called the natural thermal radiation [3]. The heat emanating on to the surface
from the cancerous tissue and the surrounding blood flow can be quantified using the Pennes
[9] bio-heat equation [8]. This equation includes the heat transfer due to conduction through
the tissue, the volumetric metabolic heat generation of the tissue, and the volumetric blood
perfusion rate whose strength is considered to be the arterio-venous temperature difference.
The equation is given as:
kD2T –
cbwb(T-Ta) + qm = 0 (1)
3Proceedings of the International Conference on Non-Ionizing Radiation at UNITEN (ICNIR 2003)
Electromagnetic Fields and Our Health
20th -22nd October 2003
where k is conductivity, qm is volumetric metabolic rate of the tissue, cbwb is the product of
the specific heat capacity, the mass flow rate of blood per unit volume of tissue T is the
unknown tissue temperature, and Ta is the arterial temperature. In theory, given the heat
emanating from the surface of the body measured by IR imaging, by solving the inverse heat
transfer problem, we can obtain the heat pattern of various internal elements of the body.
Different methods of solving the bio-heat transfer equation have been presented in literature
[1],[2]. Although it is possible to calculate the thermal radiation from a thermal body by
thermodynamics, the complexity of the boundary conditions associated with the biological
body makes this approach impractical.
THE THERMAL-ELECTRIC ANALOG
This paper presents a new method for analyzing a thermal system based on an analogy to
electrical circuit theory; referred to as thermal-electric analog [6]. We demonstrate how the
analog can be used to estimate the depth of the heat source, and furthermore, help understand
the metabolic activities undergoing within the human body. The method has been used in
early breast cancer detection and has achieved high sensitivity. Several breast cancer study
cases are given to show the effectiveness of the method. On-going clinical study results are
provided as well. As the living cells within a biological body are constantly undergoing
metabolic activities, the biochemical and the physical metabolic processes generate heat.
Thus the amount of radiation on the surface of the human body can reflect its metabolic rate.
The theory underlying conventional thermographic techniques as applied to cancer is that the
change of the pulse distribution around a cancerous area and the rate of metabolism are
greater than the general tissue, resulting in a higher temperature at the skin surface [6]. Even
though the temperature of the skin surface can be measured, if the relationship between the
surface temperature and the emissions from inside of the body cannot be established, the
application of TIR imaging technique is still limited. Pennes’ bio-heat equation models the
process of heat transfer but has its limits in practice. Thus, a new method that does not
require a direct solution to the inverse heat transfer problem, the thermal-electric analog,
comes into light.
Figure 1 illustrates the analogy between thermodynamics systems and the electrical circuit,
where the heat source S inside the human body can be simulated as a battery with voltage US,
the heat loss inside the heat source can be simulated as the heat loss on a resistor RS. The
temperature of the heat source can then correspond to the voltage of the battery, and the heat
4Proceedings of the International Conference on Non-Ionizing Radiation at UNITEN (ICNIR 2003)
Electromagnetic Fields and Our Health
20th -22nd October 2003
current to the circuit current. Similarly, we can map the heat source in the air (outside the
human body) as UA, and the heat loss as RA. The set of Ri’ s and Ci’ s corresponds to the unit
heat resistance and heat capacity along each radiation line. The circuit in Fig. 1 only shows
the analogy for one radiation line. In the study of breast cancer, it is reasonable to assume that
the medium between the heat source (S) and the surface is homogeneous. Therefore, the
radiation pattern sensed by the IR camera at the surface should have a distribution like
Gaussian as shown in Fig. 1. The surface temperature H(x) which corresponds to the output
voltage can then be calculated by Eq. 2.
n
åR
i =1
i
H ( x) = U S - n
x (U S - U A ) (2)
RS + R A + åR i =1
i
and
ê D ú
n=ê ú
ëRo cos a û
where ëa û represents the largest integer less than a, n is the number of resistors used in the
circuit, D is the depth of the heat source, and R0 is the unit heat loss in a certain medium (or
the heat resistance rate). Different parts of human body have different heat resistance rate, as
shown in Table I.
Body parts heat resistance rate
Fatty tissue 0.1 – 0.150C/cm
0
muscle 0.2 C/cm
bone 0.3 – 0.60C/cm
Table 1: Heat Resistance Rate of Different Body Parts
The thermal-electric analog provides a convenient way to estimate the depth of the heat
source.
A. Estimation of the Depth of the Heat Source
The depth estimation is based on the assumption that we can use Gaussian to model the
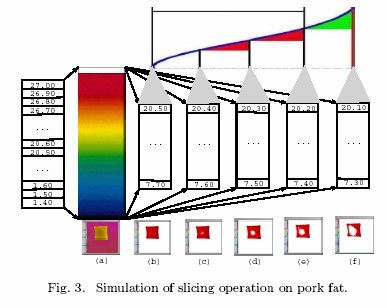
distribution of the surface temperature. A half power point is a useful property of Gaussian
distribution. The property says that the half power point divides the area enclosed by the
Gaussian into equally half. If we slice the Gaussian from top to bottom at a fixed interval as
shown in Fig. 2, the increment of the radius in the horizontal direction would not have
dramatic change until the half power point is crossed. From Fig. 2, we can see that the
relative increment of the radius between the first slice and the second slice is 34 pixels, and
40 pixels between the second slice and the third slice, but 116 pixels between the third slice
and the fourth slice. Therefore, the half power point is at the position of the third slice.
5Proceedings of the International Conference on Non-Ionizing Radiation at UNITEN (ICNIR 2003)
Electromagnetic Fields and Our Health
20th -22nd October 2003
Suppose the temperature of the heat source is H0. In the right triangle formed by SAB, the
hypotenuse (SB) is equal to H0 and the sides (SA = AB) should be equal to 0.707H0. The
horizontal side (SA) is the depth of the heat source, and the vertical side (AB) is the
temperature drop between the maximum value of the Gaussian and the half power point. In
another word, if we can find the half power point, we can find the depth of the heat source.
Each slice of the Gaussian curve corresponds to a temperature deduction of 0.1 degree. For
the application of breast cancer detection, based on the heat resistance rate of fat tissues, the
0.1 degree temperature drop corresponds to a distance of 1cm. Therefore, by slicing
(decreasing) the surface temperature at a certain degree per step, we can find the half power
point with the accuracy at the level of centimeter.
EXPERIMENTAL RESULTS AND ANALYSIS
A. Simulation Results
Figure 3 shows a synthetic example of how slicing works. The image is taken from a piece of
pork fat. An electric bulb is lit and inserted at the center of the pork fat as a heat source such
that we can control the location of the heat source. The pseudo colour-map is also shown in
the figure. “ White” represents the highest temperature and “ black” represents the lowest
temperature. First of all, an appropriate temperature needs to be found such that white pixels
at the center of the pork fat will show up in the next slice. In this example, this appropriate
temperature is 20.500. Each following slicing process decreases the highest temperature in the
color-map by 0.1 degree (e.g. the threshold is lowered by 0.1 degree), such that more white
pixels can appear. If we come to a point where the increment of the white pixel is dramatic,
the half power point is the slice before it. In the example, the fourth slice generates much
more white pixels than the previous three slices. The depth of the bulb is 3cm, which is the
same as the ground truth. Note that the increment of the white pixel is measured by the
increment of the radius of the white cluster.
6Proceedings of the International Conference on Non-Ionizing Radiation at UNITEN (ICNIR 2003)
Electromagnetic Fields and Our Health
20th -22nd October 2003
B. Patient Data Analysis
Besides measuring the depth of the heat source, slicing can also reveal the growth pattern of
the white pixels. Different tissues have different growth patterns. By observing this pattern,
different tissues can be distinguished as well. For example, the pixels of lymph nodes and
tumours should grow in a circular pattern, while the growth pattern of blood vessel is along
the direction of the blood vessel. A diagnosis protocol has been designed for early breast
cancer detection. Six steps are involved in this protocol:
• Step 1: Growth pattern of lymph nodes in the armpits
• Step 2: Size of the abnormal area
• Step 3: Appearance of the abnormal area
• Step 4: Vascular pattern
• Step 5: Nipples and areola pattern
• Step 6: Dynamic diagnosis with outside agents
(antibiotic,etc.)
Take the first step as an example, if the lymph nodes in the armpits reveal one heat source
with a depth less than 2cm, one abnormal sign (+) will be recorded; if two heat sources
appear with a depth less than 2cm and a bilateral temperature difference greater than 0.2
degree, then two abnormal signs (++) will be recorded, etc.
Figure 4 shows a patient with lobular carcinoma in the left breast. From slicing, we observe
the following abnormal signs:
1. 2cm tumour surrounded by 4 blood vessels (+++);
2. White pixels surround the nipple in 3 slices (+++);
3. Nipple bilateral temperature difference is 0.8 degree
(+).
7Proceedings of the International Conference on Non-Ionizing Radiation at UNITEN (ICNIR 2003)
Electromagnetic Fields and Our Health
20th -22nd October 2003
Figure 5 shows a patient diagnosed to have ductal carcinoma in her left breast. From slicing,
we observe the following abnormal signs:
1. Lymph node bilateral temperature difference is 0.8
(++++);
2. The tumour is 2cm from the surface (++);
3. The tumour is surrounded by five blood vessels (+++);
4. It takes less than three slices to have the white pixels
surround the nipple (++).
CONCLUSION
The innovations of this paper lie in the fact that they first reveal the relationship between the
pattern in each slice with the metabolic activities within a patient’ s body. Using thermal-
electric analog and half power point to estimate the depth of tumour is just one way to reveal
this relationship. This technique and the resulting apparatus have been patented [6]. We refer
to the system as Bioyear system or the TMI system. Clinical study has shown increased
sensitivity and specificity. The concept has been validated in China for several applications,
including breast cancer detection, and ovarian cancer detection. About 400,000 patients were
scanned using the Bioyear system in five years. Among them, 50,000 patients did breast scan.
There are 103 breast cancer cases detected by TMI which were proved by biopsy. Among
these 103 cases, 92 cases also went through mammography. Mammography missed 6 out of
these 92 cases. 2 of the missed tumour size is 2mm. The concept is also in the process of
validation in US/Canada, including the Ville Marie Breast Cancer Center in Canada (TMI’ s
diagnosis agrees with Center’ s diagnosis on 198 cases out of 200 testing images), Elliott
Mastology Center at Baton Rouge, LA, and NIH (Karposi Sarcoma / Angiogenesis).
EXISTING PROBLEMS AND EXPECTATION
The next improvement of TTM technology is based on basic research in engineering and
clinical studies in scientific work. The important area of basic engineering research work
should concentrate on the relationship between surface heat distribution and single heat
source’ s depth and size under complicated situations; more important is under multi heat
sources condition, the relationship between surface heat distribution and heat source. Some
encouraging initial results in relationship between surface heat distribution and heat source
size have been achieved so far. In conclusion, it is not easy to solve the problems. Standard
database storage is another factor to be considered for the improvement of TTM technology.
The healthy growth and benefits of TTM technology will certainly build on standardization
of training and operation. The engineering world should produce practical and simple mobile
machines to satisfy multi-purpose requirements, also they should produce economical
machines for medium size hospitals.
5
2Proceedings of the International Conference on Non-Ionizing Radiation at UNITEN (ICNIR 2003)
Electromagnetic Fields and Our Health
20th -22nd October 2003
Research and development in detector and detector’ s materials will certainly influence the
advance of TTM technology in the future. It is especially true in low cost, high sensitivity,
high accuracy and high stability of uncooled detectors and scanners’ head. The research work
in these areas will directly influence the speed of popularization and quality of TTM
technology.
SUMMARY
After 10 years of R&D work, TTM medical evaluation technology have been going through
different phases; from merely a lab experiment to application, accepted by society and
finally enters the initial stage of mass production and popularization. In a new century, TTM
technology will change the conventional medical model and leads human health into a
completely new phase; it is called the second health phase where the foundation is mainly
based on medical prediction system. This will turn human beings from a passive role to an
active role; from seeing a doctor and getting healed to health prediction and protection; to
restrain unhealthy elements which appear before the onset of diseases. Therefore human
health is fully protected and improved.
REFERENCES
[1] L. Chan. 1992. Boundary element method analysis for the bioheat transfer equation.
ASME J. Heat Transfer, 114:358– 365.
[2] R. Hsu, N. S. Sun, and G. G. Chen. 1992. Finite element formulation for two dimensional
inverse heat conduction analysis. ASME J. Heat Transfer,114:553– 557.
[3] B. F. Jones. December 1998. A reappraisal of the use of infrared thermal image analysis
in medicine. IEEE Transactions on Medical Imaging, 17(6):1019– 1027.
[4] Samuel Hodge Jr. 1987. Thermography and Personal Injury Litigation. Wiley Law
Publications.
[5] J. R. Keyserlingk, P. D. Ahlgren, E. Yu, N. Belliveau, and M. Yassa. May/June 2000.
Functional infrared imaging of the breast. IEEE Engineering in Medicine and Biology, pages
30– 41.
[6] Z. Qi. Liu and C. Wang. Method and apparatus for thermal radiation imaging. 2000.
Technical Report 6,023,637, United States Patent.
[7] K. Lloyd-Williams and R. S. Handley. 1961 Infrared thermometry in the diagnosis of
breast disease. Lancet,(2):1378– 1381.
[8] E. Y. K. Ng and N. M. Sudarshan. March/April 2001. XXX. Journal of Medical
Engineering and Technology, 25(2):53– 60.
[9] H. H. Pennes. 1948. Analysis of tissue and arterial blood temperature in resting human
forearm Journal of Applied Physiology, 2:93– 122..
[10] Thermology;http://www.thermology.com/history.htm.
[11] J. D. Wallace. 1975. Thermographic examination of the breast: An assessment of its
present capabilities. In Gallagher H. S., editor, Early Breast Cancer: etection and Treatment,
pages 13– 19.
3You can also read