ABSTRACT Medical Image Analytics in SAS Viya with Applications in the Treatment of Colorectal Cancer Spread to the Liver
←
→
Page content transcription
If your browser does not render page correctly, please read the page content below
Paper SAS3341-2019
Medical Image Analytics in SAS® Viya® with Applications in the
     Treatment of Colorectal Cancer Spread to the Liver
             Fijoy Vadakkumpadan and Joost Huiskens, SAS Institute Inc.

ABSTRACT
The powerful analytics in SAS ® Viya® have been recently extended to include the ability to
process medical images, the largest driver of health-care data growth. This new extension,
released in SAS® Visual Data Mining and Machine Learning 8.3 in SAS® Viya® 3.4 enables
customers to load, visualize, analyze, and save health-care image data and associated
metadata at scale. As SAS continues to build on this foundation, several substantially new
medical image processing capabilities are planned for future versions of SAS Visual Data
Mining and Machine Learning. In particular, these new capabilities will enable customers to
perform the following tasks: process generic data files, such as radiotherapy (DICOM-RT)
files, under the Digital Imaging and Communications in Medicine (DICOM) standard; process
images in a single SAS ® Cloud Analytic Services (CAS) action call even when the processing
parameters vary from one image to another in the input table; use highly advanced
techniques to perform image segmentation; and quantify the size and shape of tissue
regions in binary images. This paper demonstrates the new capabilities by applying them to
colorectal liver metastases (CRLM) morphometry with computed tomography (CT) scans to
assess patients’ response to chemotherapy. This study is a collaborative effort between SAS
and Amsterdam University Medical Center (AUMC) for improving CRLM treatment strategies.

INTRODUCTION
Imaging has been revolutionizing medicine for decades. From simple 2-D X-rays at the
dentist’s office to exquisite 4-D ultrasounds of a baby in its mother’s womb, it has touched
and saved countless lives. Physicians routinely rely on image-based data to diagnose
diseases, guide therapeutic procedures, and monitor patients’ response to treatment. The
benefits of these imaging technologies come with a hefty price, however, since medical
image data are notoriously large. As of 2016, over 600 million imaging procedures were
performed annually in the US alone, generating millions of terabytes of data. This
constitutes over 90% of total health-care data, making imaging the largest driver of health-
care data growth. To make matters worse, the extraction of relevant information from
medical images, for example, the boundaries of tumors, is typically done manually by
health-care professionals using a labor-intensive and subjective process. The sheer volume
of the data combined with the extensive cognitive input required for its processing make it
extremely challenging for the health-care industry to convert the images into objective
insights that can drive decisions. Further, as the volume of medical imaging data continues
to rise, radiologists are subject to excessive cognitive workloads, which leads to fatigue and
increased risk of medical errors. A typical radiologist combs through thousands of images in
a single day, as he or she examines tens of patients, each with hundreds of cross -sectional
image slices. Therefore, any automated assistance offered to the radiologists can
dramatically improve their lives and the quality of the health care their patients receive.
SAS has a rich history of supporting health and life sciences customers for their clinical data
management, analytics, and compliance needs. SAS ® Analytics provides an integrated
environment for collection, classification, analysis, and interpretation of data to reveal
patterns, anomalies, and key variables and relationships, leading ultimately to new insights
for guided decision-making. The application of SAS® algorithms has enabled patients to
transform themselves from being passive recipients to becoming active participants in their
own personalized health care. With the release of SAS ® Viya® 3.4, SAS customers can now

                                               1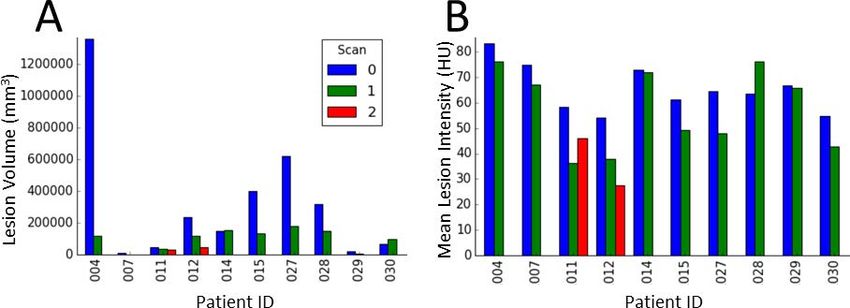
extend the analytics framework to take advantage of medical images along with statistical,
visualization, data mining, text analytics, and optimization techniques for better clinical
diagnosis. Images are supported as a standard SAS data type in SAS ® Visual Data Mining
and Machine Learning, which offers an end-to-end visual environment for machine learning
and deep learning—from data access and data preparation to sophisticated model building
and deployment in a scalable distributed framework. It provides a comprehensive suite of
programmatic actions to load, visualize, process, and save health-care image data and
associated metadata at scale in formats such as Digital Imaging and Communication in
Medicine (DICOM), Neuroimaging Informatics Technology Initiative (NIfTI), nearly raw
raster data (NRRD), and so on.
The goal of this paper is twofold. First, it provides a comprehensive overview of end-to-end
medical image analytics capabilities in SAS® Visual Data Mining and Machine Learning in
SAS Viya, with special focus on future releases of this product. Second, it illustrates these
capabilities by working through a real-world, clinically significant use case that is part of a
collaboration between SAS and Amsterdam University Medical Center (AUMC) aimed at
improving treatment strategies for patients with c olorectal cancer spread to the liver, known
as colorectal liver metastases (CRLM).

END-TO-END BIOMEDICAL IMAGE ANALYTICS IN SAS VIYA
SAS Viya uses an analytic engine known as SAS Cloud Analytic Services (CAS) to perform
various tasks, including medical image analytics. Building end-to-end solutions in SAS Viya
typically involves assembling CAS actions, which are the smallest units of data processing
that are initiated by a CAS client on a CAS server. CAS actions are packaged into logical
groups called action sets. At this time, two action sets, Image and BioMedImage, host
actions that directly operate on medical imagery.
The Image action set contains two actions that directly operate on medical image imagery:
the loadImages action loads biomedical images from disk into memory, and the saveImages
action saves the loaded images from memory to disk. These actions support all common
biomedical image formats, including the DICOM standard, which is widely used in clinical
settings. The BioMedImage action set currently includes three actions,
processBioMedImages, segmentBioMedImages, and buildSurface, with two new actions,
loadDicomData and quantifyBioMedImages, to be added in future releases. The
loadDicomData action is for loading generic DICOM files, including non-image files, into
memory. The other actions facilitate preprocessing, segmentation, visualization, and
quantification of medical images. At this time, full support is available only for two- and
three-dimensional (2-D and 3-D), single-channel medical images in these action sets.
The output produced by some of the actions in the Image and BioMedImage action sets can
be used as input to other actions, such as those in action sets for traditional machine
learning (ML) and deep learning (DL), to derive insights that inform decisions. Figure 1
presents an end-to-end biomedical image analytics pipeline in SAS Viya. On one end of the
pipeline are raw image data and metadata on disk, and on the other end are helpful insights
that can inform decisions. The major steps in the pipeline, along with the primary action
sets (in italics) that can be used to implement those steps, are displayed in rectangular
boxes. The examples of ML and DL action sets include the RobustPCA action set, which
performs principal component analysis (PCA), and the DeepLearn action, which performs
deep learning. Steps in which new actions or major upgrades to existing actions will be
available in upcoming releases of SAS® Visual Data Mining and Machine Learning are
highlighted in red. The green arrows signify critical features available in future releases of
the Image and BioMedImage action sets to facilitate the use of generic data processing
action sets such as DataStep and FedSQL to process tables containing image data. These
generic action sets are critical to integrating binary image-based data from various sources

                                              2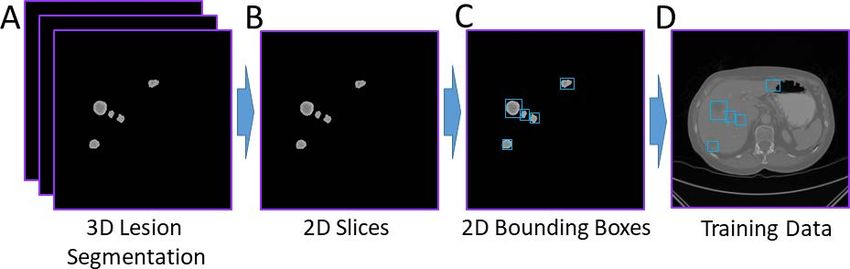
and to processing non-binary image-based metadata while retaining the corresponding
binary image-based data.

Figure 1. Processing Pipeline for End-to-End Biomedical Image Analytics in SAS Viya

CRLM MORPHOMETRY: AN EXAMPLE USE CASE
This section provides an example for the pipeline shown in Figure 1 by demonstrating how
to build an end-to-end solution that can assist with a real-world biomedical image analytics
problem, specifically assessment of therapy response in patients with CRLM, based on 3-D
computed tomography (CT) images of the patients’ torsos. Colorectal cancer is the third
most common cancer and the second leading cause of cancer-related deaths worldwide
(Bray et al. 2018). Most cancer deaths are the result of progression of metastases, that is,
spreading of the cancer. Approximately 50% of colorectal cancer patients will develop
metastases to the liver (Donadon et al. 2007). Patients with liver-only colorectal metastases
can be treated with curative intent. Complete surgical resection of CRLM is considered the
only chance for cure for these patients (Angelsen et al. 2017). Initially unresectable liver
metastases c an become resectable after downsizing of the lesions by systemic therapy, the
main component of which is chemotherapy (Lam et al. 2012). However, there is no
consensus regarding the optimal systemic therapy regime.
Accordingly, assessment of patient response to treatment is a crucial feature in the clinical
evaluation of systemic therapy. The widely accepted and applied criterion for such
assessment is the Response Evaluation Criteria In Solid Tumors (RECIST), which aims to
measure the objective change of anatomical tumor size (Eisenhauer et al. 2009). The
RECIST assessment is performed by measuring changes in one-dimensional (1-D) diameter
of two target lesions before and after therapy. Though RECIST is a clinical standard
worldwide, it is highly limited. Firstly, its measurement is manual and labor intensive.
Secondly, it is very subjective, as the target lesions, image slices for measurement, and the
line segment for lesion diameter measurement are all selected by a radiologist subjectively
(Yoon et al. 2016). Finally, RECIST ignores the exquisite 3-D and gray-scale information
provided by modern CT scanners. Some of this information has been proven to be
significantly associated with pathologic response and overall survival in patients with CRLM
(Chun et al. 2009).
This paper demonstrates the medical image analytics capabilities of SAS Viya by using the
SAS® Platform to compute new criteria that can potentially assist radiologists with
improving assessment of CRLM treatment response. Two different approaches, one based
on semi-automatic image segmentation, and the other on automatic object detection with

                                               3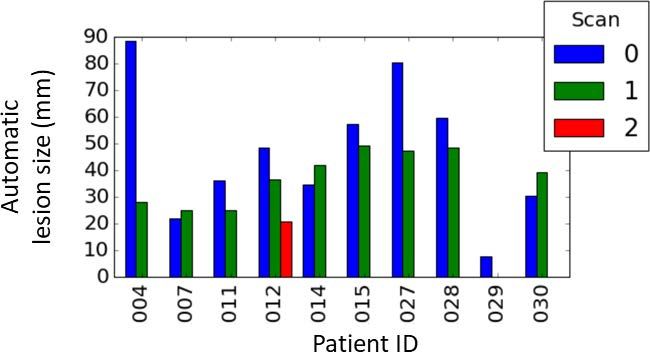
deep learning, are demonstrated. All client-side source code in this demonstration was
written in Python. The SAS Scripting Wrapper for Analytics Transfer (SWAT) package was
used to interface with the CAS server, and the Mayavi library (Ramachandran and
Varoquaux 2011) was used to perform 3-D visualizations of image-based data.
DATA SELECTION AND PREPROCESSING
All patient data used in this paper was collected as part of the Treatment Strategies in
Colorectal Cancer Patients with Initially Unresectable Liver-Only Metastases (CAIRO5)
clinical trial (Huiskens et al. 2015) and provided by AUMC. The data consisted of 3-D,
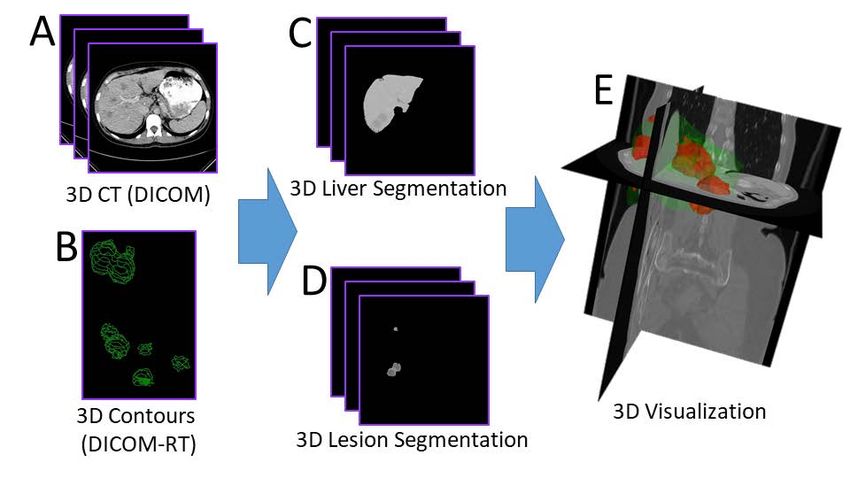
abdominal and thoracic transaxial CT images of patients in DICOM format (Figure 2A), and
expert radiologist segmentations of liver and lesions in each scan. The in-plane pixel size of
the images ranged from 0.6 to 0.8 mm, and the slice thickness ranged from 3 to 5 mm. The
expert segmentations were performed semi-automatically using the Philips IntelliSpace
Portal software at AUMC, and the resulting 3-D organ contours were stored as DICOM
radiotherapy (DICOM-RT) files (Figure 2B). Each patient received a baseline scan before
therapy and regular follow-up scans throughout therapy. Most patients received one follow-
up scan, with some receiving two. Since the goal of this paper is to demonstrate the
capabilities of SAS Viya and not to statistically show clinical significance, only a small set o f
10 patients was included in the analyses.
Figure 2. Steps in Data Processing
To preprocess the data, all 3-D images were recursively loaded on the CAS server as
illustrated by this code snippet:
# DICOM Keywords for images
imsuid = 'SeriesInstanceUID'
impn = 'PatientName'
imad = 'AcquisitionDate'
impa = 'PatientAge'
impx = 'PatientSex'
all_keys_im = [imsuid, impn, imad, impa, impx]
4# Load the DICOM series
imdata = s.CASTable(name='imdata_orig', replace=True)
r = s.image.loadimages(
path='AUMCImages',
casOut=imdata,
recurse=True,
addcolumns=dict(
general={'position', 'orientation', 'spacing'},
dicomattributes=dict(keywords=all_keys_im)),
series=dict(dicom=True),
decode=True
)
Note that several DICOM attributes of each image, including SeriesInstanceUID, were
loaded by specifying the dicomattributes parameter. Next, the DICOM-RT data were
loaded as follows:
# DICOM keywords for RT data
rtsuid =
'ReferencedFrameOfReferenceSequence{1}RTReferencedStudySequence{1}RTReferen
cedSeriesSequence{1}SeriesInstanceUID'
rtcsq = 'ROIContourSequence'
rtsdesc = 'SeriesDescription'
all_keys_rt = [rtsuid, rtcsq, rtsdesc]
# Call the new loadDicomData
rtdata = s.CASTable(name='rtdata', replace=True)
r = s.biomedimage.loaddicomdata(
path='AUMCDicomRt/',
casOut=rtdata,
addColumns=dict(keywords=all_keys_rt)
)
Here, loadDicomData is an action that will be available in future releases of SAS Visual Data
Mining and Machine Learning in the BioMedImage action set. This action can load user-
provided attributes from DICOM files in a given directory or file path, including nested
sequence attributes. For example, the attribute specified by the variable rtsuid in the
above snippet specifies multiple nesting levels to access the DICOM series universal
identifier (UID) of the image that corresponds to each DICOM-RT file being loaded.
The next step was to merge imdata, the table containing the images, with rtdata, the table
containing DICOM-RT data, by using the DataStep action set in CAS, as follows:
# Function to convert strings into column names
def col(s):
s = str.replace(str.replace(s, '{', '_'), '}', '_')
return '_'+s+'_'
# Create views in preparation for data step
r = s.table.view(
name='rtview',
tables=[dict(name='rtdata',
computedvars={'vccsq', 'suid', 'rtid'},
computedvarsprogram=
"length vccsq varchar(*); vccsq="+col(rtcsq)+";"
"length suid varchar(64); suid="+col(rtsuid)+";"
"rtid=_id_;",
varlist={col(rtsdesc)})],
5replace=True)
r = s.table.view(
name='imview',
tables=[dict(name='imdata_orig',
where='_depth_>1',
computedvars={'vcimage', 'vcres', 'vcpos', 'vcori', 'vcspa',
'adate', 'suid'},
computedvarsprogram=
"length vcimage varchar(*); vcimage=_image_;"
"length vcres varchar(24); vcres=_resolution_;"
"length vcpos varchar(24); vcpos=_position_;"
"length vcori varchar(72); vcori=_orientation_;"
"length vcspa varchar(24); vcspa=_spacing_;"
"length suid varchar(64); suid="+col(imsuid)+";"
"adate=input("+col(imad)+", yymmdd8.);",
varlist={'_id_', '_dimension_', '_imageFormat_', col(impn)})],
replace=True)
# Merge the tables on DICOM series UID
r = s.datastep.runcode(code="data imrt;"
"merge imview(in=a) rtview(in=b);"
"by suid;"
"if a & b;"
"run;")
Note that the runCode action in the DataStep action set was performed on views of the
image data tables generated by the view action in the table action set, and not directly on
the tables. This is because the tables contained binary data columns of type varbinary, such
as _image_, which the runCode action does not currently support. The views helped cast
the binary data as the character type varchar, which runCode supports. To facilitate
processing of the table produced by runCode, actions in the BioMedImage action set have
been updated to accept columns of type varchar also for variables where it previously
required varbinary columns.
Three-dimensional images of liver (Figure 2C) and lesion (Figure 2D) segmentations were
then generated by processing the merged table with the processBioMedImages action in the
BioMedImage action set, like so:
masks = s.CASTable(name='masks', replace=True)
imrt = s.CASTable(name='imrt', replace=True)
s.biomedimage.processbiomedimages(
images=dict(table=imrt, image='vcimage',
resolution='vcres',
position='vcpos',
orientation='vcori',
spacing='vcspa'),
steps=[dict(stepparameters=dict(steptype='roi2mask',
roi2maskparameters=dict(roi2masktype='dicomrt_specific',
roicontoursequence='vccsq',
pixelintensity='image')))],
casout=masks,
decode=True,
copyvars={‘_SeriesDescription_’},
addcolumns={'position', 'orientation', 'spacing'}
)
Here, roi2mask is a new step that will be available in future releases of the
processBioMedImages action. This step is capable of processing image-specific DICOM-RT
6contour data, as indicated by the ‘dicomrt_specific’ value of the roi2masktype
parameter. The value of ‘image’ given to the pixelintensity parameter directed the
action to retain gray-scale values of pixels that belong to the regions delineated by the
DICOM-RT contours. The liver and lesion segmentations generated by the
processBioMedImages action can be fed into the buildSurface action in the BioMedImage
action set to reconstruct highly detailed surfaces of liver and lesions for 3-D visualization.
One such visualization presented in Figure 2E illustrates the exquisite 3-D detail captured by
the data used in this paper.
CRITERIA USING IMAGE SEGMENTATION
To compute new criteria in assessing CRLM response that overcome some of the limitations
of RECIST, quantifyBioMedImages, a new action that will be available in future releases of
SAS® Visual Data Mining and Machine Learning in SAS Viya, was applied to the lesion
segmentation images generated in the previous section. This action can compute user-
specified quantities or metrics from images. The code to invoke this action was as follows:
qdata = s.CASTable(name='qdata', replace=True)
s.biomedimage.quantifybiomedimages(
images=dict(table=masks.query("find(_SeriesDescription_, 'seg')>0")),
region='component',
quantities=[dict(quantityparameters=dict(quantitytype='mean')),
dict(quantityparameters=dict(quantitytype='content'))],
labelparameters=dict(labeltype='basic', connectivity='face'),
casout=qdata)
The quantities specified above are mean and content, which directed the action to compute
mean CT intensity and volume of each lesion region. Note, the masks table was filtered
using information contained in one of the DICOM attributes to select only the lesion
segmentation images for these calculations. Also, the combination of region and
labelparameters options directed the action to compute the quantities for each connected
component (Johnson, McCormick, and Ivanez 2015); that is, lesion region, of each image.
The result of the quantifyBioMedImages action was then further processed with the
summary action in the Simple action set to compute the total lesion volume and mean
lesion intensity of each lesion in each scan of each patient. The results are summarized in
Figure 1. Scans 0, 1, and 2 referred to in the legend of the figure were the baseline, first
follow-up, and second follow-up scans, respectively. Overall, both the lesion volumes and
the mean lesion intensities decreased over therapy. Note that the unit for mean lesion
intensity is the Hounsfield unit (HU), the unit of pixel values in CT images.
Figure 3. Total Lesion Volumes and Mean Lesion Intensities for Each Scan of Each Patient
7CRITERION USING AUTOMATIC OBJECT DETECTION WITH DEEP LEARNING
This section demonstrates preliminary efforts toward using a convolutional neural network-
based deep learning object detection model to develop an objective, fully automated
surrogate for the RECIST criterion. To prepare the data needed to train the model, the 3-D
lesion segmentation images (Figure 4A) were split into individual 2-D slices (Figure 4B)
using the export_photo step of the processBioMedImages action in the BioMedImage action
set (Vadakkumpadan and Sethi 2018). Then, the bounding box for each 2-D lesion region of
each slice was computed (Figure 4C) using the quantifyBioMedImages action, as follows:
bbdata = s.CASTable(name='bbdata', replace=True)
s.biomedimage.quantifybiomedimages(
images=dict(table=masks_exp),
region='component',
quantities=[dict(quantityparameters=dict(quantitytype='boundingbox'))],
labelparameters=dict(labelType='basic', connectivity='face'),
casout=bbdata)
Here, the masks_exp table contained the 2-D slices (Figure 4B). The output table containing
the bounding boxes was then merged with corresponding slices from the original 3-D
DICOM image (Figure 2A). The merged table contained about 900 rows, each row
containing an image slice from one of the 10 patients and bounding boxes of lesions in t hat
slice. Note that only those slices with at least one lesion region was included in this data.
These data was then randomly split into training and testing sets of approximately equal
size. The YOLOv2 model available in SAS® Visual Data Mining and Machine Learning in SAS
Viya was then optimized using the training set to detect CRLM lesions.
Figure 4. Data Preparation for Training the YOLOv2 Deep Learning Object Detection Model
The model was then scored with the testing set, and the automatically detected lesions
were visually examined using the extractDetectedObjects action in the Image action set
(Figure 5). It was evident that the model was learning to detect the lesions. At the same
time, the model was not perfect, since it missed many lesions, for example, those pointed
to by the yellow arrows inFigure 5. To compute a single lesion size metric for each 3-D
patient scan, for each detected 2-D bounding box in that scan, the volume of a disc with
diameter equal to the average side length the bounding box and thickness equal to the
scan’s slice thickness was calculated. The volumes of all such discs were then totalled, and
the diameter of a sphere with volume equal to this sum was computed. Figure 6 presents
this new automatic lesion size metric for each scan of each patient. It is clear from the
figure that this new metric captures the reduction in lesion size over therapy, and therefore
can be an objective, fully automated surrogate for the RECIST criterion. Note that two of
the scans, specifically scan 2 of patient 11 and scan 1 of patient 29, are missing in this plot.
This is because the deep learning model failed to detect any lesions in those scans.
8Figure 5. Examples Results from Automatic Detection of CRLM Lesions Using the YOLOv2 Model
in This Paper
Figure 6. Results from Automatic Lesion Size Measurement Using YOLOv2 Object Detection
DISCUSSION
This paper describes the various SAS Viya components for medical image analytics and to
provide illustrations of how to assemble those components to solve real-world problems.
Two CAS action sets, Image and BioMedImage, currently host all actions that directly
operate on medical imagery. CRLM treatment response assessment is us ed as an example
to illustrate how to assemble these actions in combination with other SAS Viya actions to
build complex pipelines that convert raw medical image data and annotations into insights
that can help address clinically significant problems. Two image analytic approaches, one
using semi-automatic image segmentation and the other using automatic object detection
with deep learning, are demonstrated.
The CRLM response assessment metrics presented in this paper can potentially overcome
important limitations of the RECIST criterion. The focus of the semi-automatic segmentation
approach was to incorporate information ignored by RECIST, while that of the object
detection method was to provide a criterion that was fully automated and objective.
Specifically, the former approach used the 3-D (Figure 2A) and gray-scale (Figure 4B)
information from all lesion regions. In contrast, RECIST is restricted to the usage of simple
1-D diameter measurements made on two target lesions. The object detection approach
9provided a lesion size measure (Figure 6) similar to RECIST, but without the subjectivity or
labor that is part of RECIST. Such an objective and automated approach, when implemented
in a clinic, will help radiologists use their time efficiently and make more consistent
decisions across patients. Our preliminary analyses have found quantitative evidence
demonstrating that the criteria presented in this paper strongly correlate with, and contain
information complementary to, the RECIST measure. These analyses are, however, beyond
the scope of this paper and therefore will be published elsewhere.
The CRLM response criteria presented in this paper have some limitations. First, the image
segmentation approach involves labor-intensive delineations of the liver and lesion regions
from 3-D CT images. However, this limitation will be overcome in the future by using deep
U-net style deep learning models (Christ et al. 2016) that will be available in future releases
of SAS® Visual Data Mining and Machine Learning. Training of such models was the primary
purpose of expert delineations of the liver. Second, the YOLOv2 model used in the object
detection approach had limited accuracy. But achieving highly accurate lesion detection was
not the goal in this paper. The objective for the model was to attain an accuracy that was
sufficient to provide a metric that strongly correlated with the RECIST criterion. Finally, the
images in the testing set used to evaluate YOLOv2 deep learning model in this paper
strongly correlated with those in the training set since slices from the same 3-D image were
included in both sets. However, the goal of this paper was to describe the medical image
analytics component of SAS Viya and to demonstrate its potential for solving a clinically
significant image analytics problem. The goal was not to develop a model that can be
deployed in the clinic.
CONCLUSION
The medical image analytics extension of SAS Viya, available in SAS® Visual Data Mining
and Machine Learning, enables customers to load, visualize, process, and save health-care
image data and associated metadata at scale. Specific examples provided in this paper
demonstrate how the new action sets, when combined with other data analytic capabilities
available in SAS Viya, such as deep learning, empowers customers to assemble end-to-end
solutions to significant, image-based health-care problems. Upcoming releases of SAS Viya
will build on the foundation that this paper demonstrates. These future development efforts
will include additional capabilities to process images with image-specific parameters, and to
compute more complex quantities from images such as histograms. Also, the BioMedImage
action set will be expanded by adding dedicated actions that perform binary operations on
images, such as addition and masking.
REFERENCES
Angelsen, J. H., et al. 2017. “Population-based study on resection rates and survival in
patients with colorectal liver metastasis in Norway.” The British Journal of Surgery,
104(5):580-589.
Bray, F., et al. 2018. Global cancer statistics 2018: GLOBOCAN estimates of incidence and
mortality worldwide for 36 cancers in 185 countries. CA Cancer J Clin, 68(6):394-424.
Christ, P. F., et al. 2016. “Automatic Liver and Lesion Segmentation in CT Using Cascaded
Fully Convolutional Neural Networks and 3D Conditional Random Fields.” In Medical Image
Computing and Computer-Assisted Intervention – MICCAI 2016, ed. Ourselin, S., et al, 415-
423. Cham: Springer.
Chun, Y. S., et al. 2009. “Association of computed tomography morphologic criteria with
pathologic response and survival in patients treated with bevacizumab for colorectal liver
metastases.” JAMA, 302(21):2338-2344.
10Donadon M. et al. 2007. “New paradigm in the management of liver-only metastases from
colorectal cancer.” Gastrointestinal Cancer Research, 1(1):20-27
Eisenhauer E.A., et al. 2009. “New response evaluation criteria in solid tumours: revised
RECIST guideline (version 1.1).” European J Cancer, 45(2):228-247.
Huiskens J., et al. 2015. Treatment strategies in colorectal cancer patients with initially
unresectable liver-only metastases, a study protocol of the randomised phase 3 CAIRO5
study of the Dutch Colorectal Cancer Group (DCCG).” BMC Cancer, 15:365.
Johnson, H. J., M. McCormick, and L. Ivanez. 2015. The ITK Software Guide Book 1:
Introduction and Development Guidelines – Volume 1. New York: Kitware, Inc.
Lam, V. W., et al. 2012. “A systematic review of clinical response and survival outcomes of
downsizing systemic chemotherapy and rescue liver surgery in patients with initially
unresectable colorectal liver metastases.” Ann Surg Oncol, 19(4):1292-1301.
Ramachandran, P., and G. Varoquaux. 2011. “Mayavi: 3D Visualization of Scientific Data.”
IEEE, 13(2):40-51.
Vadakkumpadan, F., and S. Sethi. 2018. “Biomedical Image Analytics Using SAS ® Viya®.”
Proceedings of the SAS Global Forum 2018 Conference. Cary, NC: SAS Institute Inc.
Available https://www.sas.com/content/dam/SAS/support/en/sas-global-forum-
proceedings/2018/1961-2018.pdf.
Yoon, S. H., et al. 2016. “Observer variability in RECIST -based tumour burden
measurements: a meta-analysis.” Eur J Cancer, 53:5-15.
ACKNOWLEDGMENTS
We thank Dr. Geert Kazemier at AUMC for providing us with the image data, and Dr. Nina
Wesdorp at AUMC for annotating the images.
RECOMMENDED READING
• SAS® Visual Data Mining and Machine Learning 8.3: Programming Guide
CONTACT INFORMATION
Your comments and questions are valued and encouraged. Contact the authors at:
Fijoy Vadakkumpadan
SAS Institute, Inc.
+1 919 531 1943
fijoy.vadakkumpadan@sas.com
Joost Huiskens
SAS Institute, Inc.
+31 35 6996 831
joost.huiskens@sas.com
SAS and all other SAS Institute Inc. product or service names are registered trademarks or
trademarks of SAS Institute Inc. in the USA and other countries. ® indicates USA
registration.
Other brand and product names are trademarks of their respective companies.
11You can also read