Medium spiny neurons activity reveals the discrete segregation of mouse dorsal striatum - eLife
←
→
Page content transcription
If your browser does not render page correctly, please read the page content below
RESEARCH ARTICLE

                                     Medium spiny neurons activity reveals the
                                     discrete segregation of mouse dorsal
                                     striatum
                                     Javier Alegre-Cortés†, Marı́a Sáez†, Roberto Montanari, Ramon Reig*

                                     Instituto de Neurociencias CSIC-UMH, San Juan de Alicante, Spain

                                     Abstract Behavioral studies differentiate the rodent dorsal striatum (DS) into lateral and medial
                                     regions; however, anatomical evidence suggests that it is a unified structure. To understand striatal
                                     dynamics and basal ganglia functions, it is essential to clarify the circuitry that supports this
                                     behavioral-based segregation. Here, we show that the mouse DS is made of two non-overlapping
                                     functional circuits divided by a boundary. Combining in vivo optopatch-clamp and extracellular
                                     recordings of spontaneous and evoked sensory activity, we demonstrate different coupling of
                                     lateral and medial striatum to the cortex together with an independent integration of the
                                     spontaneous activity, due to particular corticostriatal connectivity and local attributes of each
                                     region. Additionally, we show differences in slow and fast oscillations and in the
                                     electrophysiological properties between striatonigral and striatopallidal neurons. In summary, these
                                     results demonstrate that the rodent DS is segregated in two neuronal circuits, in homology with
                                     the caudate and putamen nuclei of primates.

*For correspondence:                 Introduction
ramon.reig@umh.es                    The basal ganglia are a group of subcortical nuclei involved in a diversity of functions including
†                                    motor control, learning, decision making, and reward (Packard and Knowlton, 2002; Schultz et al.,
 These authors contributed
equally to this work                 1997; Yin and Knowlton, 2006). The striatum is the main input structure of the basal ganglia,
                                     receiving glutamatergic transmission from the cortex and the thalamus (Alloway et al., 2009;
Competing interests: The             Kincaid et al., 1998; Wilson, 1987). In primates and other mammals, the dorsal part of the striatum
authors declare that no
                                     is formed by the nuclei caudate and putamen, which are anatomically separated by the internal cap-
competing interests exist.
                                     sule. In contrast, rodent dorsal striatum (DS) is considered a homogeneous structure due to the
Funding: See page 24                 absence of anatomical border and the copious presence of overlapping axonal connections
Received: 27 September 2020          (Alloway et al., 2006; Hooks et al., 2018; Hoover et al., 2003). However, some recent studies
Accepted: 15 February 2021           have divided the DS in two regions, dorsomedial (DMS) and dorsolateral (DLS) striatum, based on
Published: 18 February 2021          their behavioral roles (Graybiel, 2008; Hauber and Schmidt, 1994). While both regions participate
                                     in motor control, DLS is often related with habit, stimulus-response associations and navigation,
Reviewing editor: Olivier J
                                     whereas the DMS mediates action-outcome associations, goal-directed actions and flexible shifting
Manzoni, Aix-Marseille
University, INSERM, INMED,
                                     between behavioral strategies, suggesting a role in higher cognitive functions (Faure et al., 2005;
France                               Hilário and Costa, 2008; Lerner et al., 2015; Thorn et al., 2010). In order to understand the basal
                                     ganglia circuits and their related behaviors, an essential question should be addressed: Is the func-
   Copyright Alegre-Cortés et al.
                                     tional segregation of the DS supported by two different circuits?
This article is distributed under
                                         Cortex and thalamus project to the striatum, forming organized glutamatergic synapses along its
the terms of the Creative
Commons Attribution License,         mediolateral axis, and defining multiple striatal subregions (Hintiryan et al., 2016; Hunnicutt et al.,
which permits unrestricted use       2016). This corticostriatal axonal innervation presents a high degree of convergence and divergence
and redistribution provided that     (Flaherty and Graybiel, 1991) and originates in both hemispheres from different subtypes of pyra-
the original author and source are   midal neurons (Cowan and Wilson, 1994; Hooks et al., 2018; Levesque et al., 1996; Reiner et al.,
credited.                            2003; Wilson, 1987). Corticostriatal connections innervate both striatonigral and striatopallidal

Alegre-Cortés, Sáez, et al. eLife 2021;10:e60580. DOI: https://doi.org/10.7554/eLife.60580                                         1 of 29
Research article Neuroscience
medium-sized spiny neurons (direct and indirect MSNs, respectively) (Doig et al., 2010; Wall et al.,
2013), which represent 95% of the neurons in the striatum (Kita and Kitai, 1988), and different
types of interneurons (Tepper et al., 2008). The lateral region of the striatum is highly innervated by
axons from somatosensory and motor related cortical areas, while the medial one receives cortical
axons from visual, auditory, associative, limbic (Hintiryan et al., 2016; Hunnicutt et al., 2016) and
with lower axonal density from somatosensory cortical regions (Reig and Silberberg, 2014).
In addition to the differences in cortical or thalamic axonal innervation, there are dissimilarities in
the composition of the striatal microcircuits. The distribution of parvalbumin (PV) and cholinergic
interneurons (ChIs) along the mediolateral axis of the DS is not homogeneous (Gerfen et al., 1985;
Kita et al., 1990; Matamales et al., 2016; Muñoz-Manchado et al., 2018). Furthermore, dopami-
nergic projections from the lateral part of the substantia nigra massively innervate the DS (Ike-
moto, 2007), with particular impact in the activity of ChIs along the DS (Chuhma et al., 2018). All
these precise afferent connectivity, microcircuit interactions, and neuromodulation regulate the syn-
aptic activity of DLS- and DMS-MSNs.
The activity of every neural circuit is limited by anatomical and functional constrains which will
restrict the repertoire of spontaneous and evoked activity patterns, defining the functional connec-
tivity of the brain (Getting, 1989; Luczak et al., 2015). In this work, we describe how MSNs of the
lateral and medial regions of the DS integrate spontaneous and sensory evoked activity.
The slow wave oscillation (SWO) is characterized by periods of high spontaneous activity (Up
states) intermingled with silent periods (Down states) at the frequency of ~ 1 Hz, which is originated
in the cortex (Sanchez-Vives and McCormick, 2000; Timofeev et al., 2000) and propagates directly
to the striatum, modulating the resting state of MSNs (Sáez et al., 2018; Wilson and Kawaguchi,
1996) and interneurons (Reig and Silberberg, 2014). Based in their heterogeneous activity, we
found that DS is segregated in two circuits and propose a biological substrate that explains their
differences.
Because MSNs recorded in vivo are known to fire scarcely (Adler et al., 2012; Berke et al.,
2004; Wilson, 1993), we performed single and pairs of whole-cell patch-clamp recordings to analyze
their subthreshold dynamics during spontaneous and evoke activity, identifying their specific path-
ways. Our findings show how the DS is divided in two non-overlapping circuits, based on the MSNs
activity. DLS- and DMS-MSNs differ in the integration of the slow wave and beta oscillations, as well
as in the functional coupling to multiple cortical regions. By means of double in vivo patch-clamp
recordings, we demonstrate a sequential propagation of the cortical slow wave oscillation (SWO)
along DS. In addition, we found that the evoked responses of MSNs to visual stimulation displayed
different properties along the medio-lateral axis, that were consistent with cortical projections and
independent of the circuit in which the MSN was embedded. MSNs close to the midline responded
with shorter delays, bigger amplitudes and faster slopes than the ones placed in dorsocentral territo-
ries. Finally, we identified that the direct and indirect pathways MSNs have particular attributes in
the DLS and DMS, displaying differences in their electrophysiological properties and synaptic
integration.
In conclusion, consistent with previous behavioral studies, our results demonstrate that DS is
divided in two functional circuits, separated by a sharp boundary, each of them with specific proper-
ties that are essential to understand the striatum and basal ganglia functions.
Results
MSNs in the DLS and DMS have different electrophysiological
properties
We obtained in vivo whole-cell patch-clamp recordings from 223 neurons located in the DS (n = 197)
and several cortical areas (n = 26). All of them displayed SWO with prominent Up and Down states
(Figures 1C, 2A, Figures 4A–B, D, 5A–B and 6A), at close frequency of ~ 0.7 Hz in both brain
regions. The different types of striatal neurons were identified by their electrophysiological proper-
ties and morphology (Figure 1B, see Materials and methods). Direct and indirect pathway MSNs
were determined by their responses to the light stimulation using the optopatcher (Katz et al.,
2019; Ketzef et al., 2017; Figure 7A). All average graphs showed in this study represent the stan-
dard deviation unless stated otherwise.
Alegre-Cortés, Sáez, et al. eLife 2021;10:e60580. DOI: https://doi.org/10.7554/eLife.60580 2 of 29Research article Neuroscience
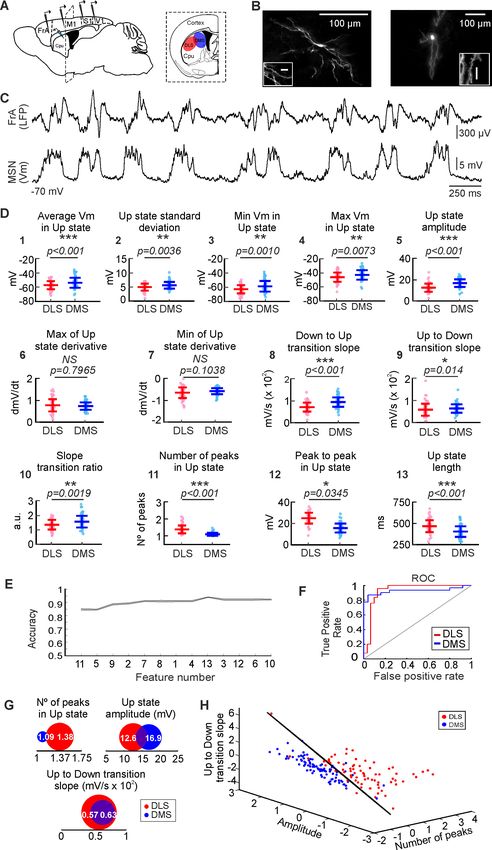
Figure 1. Analysis and classification of SWO in dorsal striatum. (A) Schematic representation of the in vivo
recording setup. (B) Morphological reconstruction of DLS-MSN (left) and DMS-MSN (right). Different scales show
neuron magnitude and its dendritic spines, confirming that the recorded neuron is a MSN. (C) Representative LFP
(top) and whole-cell patch-clamp recording of a MSN (bottom). (D) Featurization of the SWO of DLS- and DMS-
Figure 1 continued on next page
Alegre-Cortés, Sáez, et al. eLife 2021;10:e60580. DOI: https://doi.org/10.7554/eLife.60580 3 of 29Research article Neuroscience
Figure 1 continued
MSNs (see Materials and methods). (E) RFE of the computed features (feature number) to determine their order of
relevance classifying DLS- and DMS-MSNs. A SVM with a linear kernel was selected as classification algorithm. (F)
Example ROC curve of the DLS-DMS classification for one of the crossvalidations using the three most relevant
features, illustrated in D. (G) Schematic representation of the data distribution of DLS and DMS groups for the
most relevant features (numbers 11, 5, and 9, respectively). White number represent the mean; the radius of the
circle represents the variance. (H) Subspace of classification based on the RFE results. Dots represent individual
MSNs recorded in DLS (red) or DMS (blue). Classification hyperplane obtained after training the SVM with linear
kernel in black. p Values obtained using the Wilcoxon Rank-sum test.
The online version of this article includes the following figure supplement(s) for figure 1:
Figure supplement 1. Classification of DLS- and DMS-MSNs at animal level.
Figure supplement 2. Correlation between the SWO features and electrophysiological properties of MSNs.
In order to study the circuit attributes that may characterize the DS, our initial approach was to
compare the electrophysiological properties of striatal MSNs recorded in the lateral (DLS, n = 77)
and medial (DMS, n = 91) regions of the DS in anesthetized mice. The membrane potential of the
Down states was stable during the recordings with no differences between striatal regions (DLS-
MSNs = 69.89 ± 5.79 Hz, DMS-MSNs = -69.867 ± 7.67 Hz, p=0.42). MSNs exhibited a rich sub-
threshold activity during Up states; however, they displayed a very low rate of spontaneous action
potentials with similar frequencies along DS (DLS-MSNs = 0.3 ± 0.95 Hz, DMS-MSNs = 0.24 ± 0.53
Hz, p=0.58). Input resistance was higher for DLS-MSNs (DLS-MSNs = 312 ± 25 MW, DMS-
MSNs = 255 ± 16 MW, p=0.04). These changes in resistance could impact in the neuronal properties
of synaptic integration, setting the gain and timing for their synaptic inputs. Thus, the integration of
the spontaneous activity on DLS- and DMS-MSNs could be, at least partially, modulated by the cellu-
lar differences which underlie their intrinsic electrophysiological properties.
The spontaneous activity from DLS- and DMS-MSNs have different
attributes
We first studied the properties of the SWO recorded in whole-cell from dorsal striatal MSNs. In
order to obtain a quantitative description of the activity of the MSNs in this brain state, we com-
puted 13 different features to characterize the magnitude (i.e mean and max membrane potential,
amplitude) and shape (i.e. ratio between transitions, number of peaks) of the Up states (Figure 1D),
from which 11 were statistically different between DLS- and DMS-MSNs (Ups extraction and all fea-
tures are explained in methods section). The average membrane potential in the Up states was
higher in the DMS-MSNs, as well as their standard deviation, minimum and maximum membrane
potential and the total amplitude (Figure 1D, features n˚ 1–5). Their upward and downward transi-
tion slopes and its ratio were also higher in DMS-MSNs (Figure 1D, features n˚ 8–10). DLS-MSNs dis-
played higher number of peaks during the Up states and peak to peak amplitude, as well as longer
Up states (Figure 1D, features n˚ 11–13). Similar to cortical neurons (Sanchez-Vives and McCormick,
2000), Up states in MSNs are comprised by a barrage of excitatory and inhibitory synaptic inputs
(Reig and Silberberg, 2014). Therefore, these divergences in the integration of the spontaneous
activity may reflect changes in the excitatory and inhibitory inputs that DLS- and DMS-MSNs receive.
Once we obtained a statistical prove of the differences in the SWO between DLS and DMS, we
asked whether these differences were sufficient to define DLS- and DMS-MSNs as two different pop-
ulations. More specifically, we asked which parameters, or combination of them, could be used to
distinguish between DLS- and DMS SWO more accurately. To do so, we searched for those features
of the Up states whose combination maximized the accuracy of classifying MSNs corresponding to
DLS or DMS circuits. Using a supervised machine-learning technique, named Support Vector
Machine (SVM) (Cortes and Vapnik, 1995) with a linear kernel, we performed a Recursive Feature
Elimination (RFE) analysis to rank the 13 computed features of the Up states, according to their com-
bined utility to classify DLS- or DMS-MSNs (Figure 1E). Therefore, starting from the whole set of
parameters, they were recursively removed depending on their relevance for the classification of
DLS- and DMS-MSNs (see Materials and methods); as a results of the RFE, we obtained a sorting of
the features depending on their relevance for the classification. The most relevant features were:
first, the number of peaks in the Up states and second, the amplitude inside the Up state, which
Alegre-Cortés, Sáez, et al. eLife 2021;10:e60580. DOI: https://doi.org/10.7554/eLife.60580 4 of 29Research article Neuroscience
Figure 2. Beta band in membrane voltage of dorsal striatal MSNs. (A) Example of energy of the beta band (red
trace) during the MSN SWO recorded in DMS. (B) Energy of the beta band of DLS- and DMS-MSNs. (C) Average
of phase alignment of beta band to the SWO in DLS- (left) and DMS-MSNs (right) (Raylegh test, pResearch article Neuroscience
relevant features for further analyses; number of peaks, amplitude and Up to Down transition slopes
(Figure 1H).
Because multiple MSNs were recorded from the same animals (on average ~ 4 MSNs per mouse,
Supplementary file 1B), and this could weigh the distributions and bias the result, we did an addi-
tional one-animal-out classification (Figure 1—figure supplement 1). In this analysis, all the MSNs
recorded from one animal are excluded from the training phase of the classifier. Once trained, these
MSNs are presented to the classifier in order to predict their position (see Materials and methods).
By using this approach, we ensure that any bias that the animal may have introduced into the train-
ing phase of the classifier is removed. The result shows that the classification is present at the animal
level (Figure 1—figure supplement 1), as well as the neuronal one (Figure 1H). In conclusion, our
classifier based on the spontaneous activity integration of the MSNs indicates that DLS and DMS are
identified as two distinct functional circuits.
In order to unravel the source of the Up states differences between DLS- and DMS-MSNs, we first
computed the correlations of the intrinsic membrane properties, showed in Table 1 and the Up state
features of the MSNs; no comparison had an absolute correlation value over 0.3 (Figure 1—figure
supplement 2). Therefore, it cannot be concluded that the intrinsic electrophysiological properties
of MSNs are relevant to discriminate between striatal regions.
In the next step to further depict the differences between DLS and DMS, we characterized the
fast oscillations that are phase locked to the Up state. High-frequency oscillations are prominent dur-
ing wakefulness and during the Up states of the SWO (Compte et al., 2008; Steriade et al., 1996).
In the cortico-basal ganglia-thalamic loop, high-frequency activity has been related with different
functions and processes in health and disease (Brown, 2003; Feingold et al., 2015). For instance,
exaggerated beta-band oscillations occur in Parkinson’s disease. With the purpose to study possible
differences in the high-frequency oscillations of DLS and DMS, we compared the energy in the theta
(6–10 Hz), beta (10–20 Hz) and gamma (20–80 Hz) bands of DLS- and DMS-MSNs (Figure 2—figure
supplement 1). To that end, we applied the Noise-Assisted Multivariate Empirical Mode Decompo-
sition (NA-MEMD), extracting the Intrinsic Mode Functions (IMFs) (see Materials and methods) carry-
ing the information of the different oscillatory activity bands. The NA-MEMD is a noise-assisted
template-free technique for time frequency analysis of n-dimensional signals; it let us obtain an
enriched decomposition of the spontaneous activity compared to traditional techniques (Fourier
decomposition, wavelet, and others), due to the non-linear properties of neural oscillations
(Averbeck et al., 2006; Cole and Voytek, 2017; Laurent, 1996; Shamir and Sompolinsky, 2004).
Our results show that the energy of the beta band was higher, and statistically different, in DMS-
MSNs (Figure 2B–D). On average, the peak of beta energy occurs in the first third of the Up state in
both striatal regions, but it is closer to the beginning of the Up state for DMS-MSNs (Figure 2C,
DMS=-26.81±24.63o, DLS=-13.26±30.01o, p=0.0007). Following this divergence in beta band, we
tested whether high-frequency oscillation contained enough information to classify DLS- and DMS-
Table 1. Intrinsic properties of DLS and DMS of direct and indirect MSNs.
Comparisons between DLS- and DMS-MSNs (pResearch article Neuroscience
MSNs. To that end, we trained an SVM with a linear kernel with the amplitude and position of the
peak energy inside the Up state of each band. We obtained a classification accuracy of 70.61 ±
0.89% indicating that the high frequencies do not discriminate between DS regions as clearly as Up
state properties. Moreover, the addition of the high-frequency properties as extra features to our
previous classifier did not improve the level of discrimination obtained by the SWO features
(Figure 1E,F). Therefore, we conclude that DLS- and DMS-MSNs can be identified as belonging two
different circuits based on the features of the Up states during the SWO.
DLS and DMS are two non-overlapping functional circuits in mouse
Once it had been shown that DLS and DMS circuits could be separated based on their SWO, we
studied the transition from one circuit to the other, exploring the properties of this brain state in
dorsocentral striatum (DCS) (Figure 3A), a hypothetical third region between DLS and DMS (see
Materials and methods). We considered three possible scenarios (Figure 3A,B): If the activity of
both circuits is mostly driven by the afferent inputs, we should observe a gradient moving from one
circuit to the other (Hypothesis 1), or alternatively a third type of circuit (Hypothesis 2). Whether
other factors, either extrinsic or intrinsic to the DS, control the spontaneous activity of these circuits,
we should observe a sharp transition from one circuit to the other (Hypothesis 3). To address this
question, we recorded MSNs in the DCS (see Materials and methods) in whole-cell, extracting the
previous 13 features of the SWO (Supplementary file 1A). Then, we projected the DCS-MSNs into
the standardized space used for the classification of DLS- and DMS-MSNs (Figure 3C), containing
the values of number of peaks in the Up state, Up state amplitude and Up to Down transition slopes
(Supplementary file 1A, Figure 3—figure supplement 1). In order to study the distribution of DCS-
MSN in the parameter space relative to the populations of DLS- and DMS-MSNs we used the SVM
that had been used previously to classify these two populations. We wanted to understand if the
DCS-MSNs created a continuum between the DLS- and DMS-MSNs populations along the decision
axis or whether this separation remained after the addition of the new pool of MSNS. To answer this
question, we used the hypervector computed by the SVM to perform the classification (Figure 3C,
see Materials and methods). We projected the data onto this hypervector and compared the distri-
bution of the MSNs recorded from DCS to determine whether they belonged to either DLS or DMS
circuits, or whether they had different properties (Figure 3D). If a sharp functional boundary exists
between DLS and DMS, we would have recorded an undetermined amount of MSNs belonging to
both circuits (Hypothesis 3). Otherwise, it would appear a new cluster with an undescribed third
functional type of MSN, with an unknown distribution along the hypervector (Hypothesis 2) or in
between DLS and DMS-MSNs distributions (Hypothesis 1). The distribution of MSNs recorded in the
DCS was consistent with a mixture of MSNs from DLS and DMS circuits supporting a sharp transition
between DLS and DMS regions [see discussion]. DCS distribution (Figure 3D, green trace) was sig-
nificantly different to either the DLS and DMS distributions (pResearch article Neuroscience Figure 3. Study of the SWO in the DCS striatum and determination of the functional boundary between DLS and DMS. (A) Schematic representation of the ‘boundary question’. (B) Three possible hypotheses about DCS-MSNs SWO. Hyp. 1: There is an intermediate distribution between DLS and DMS SWO (top); Hyp. 2: There is a different type of SWO distribution (middle); Hyp. 3: There is no specific DCS distribution of SWO and the MSNs recorded at DCS are a combination of DLS- and DMS-MSNs (bottom). The black line displays the distribution of the SWO combining both DLS and DMS. (C) Distribution of DLS-, DMS-, and DCS-MSNs in the subspace of classification determined by the RFE. Classification plane in black. Orthogonal hypervector to the classification plane in gray. (D) Distribution of dorsolateral, dorsomedial and dorsocentral MSNs and the combining DLS-DMS function along the orthogonal hypervector to the hyperplane classification. All comparison between distributions are significant (p
Research article                                                                                                      Neuroscience

                                    amplitudes and slopes were statistically different and clearly higher in the DMS-MSNs (amplitudes
                                    DCS = 8.84 ± 3.15 mV, DMS = 18.67 ± 3.86 mV, p=0.00009; slopes DCS = 139 ± 48.1 mV/s,
                                    DMS = 432 ± 302.9 mV/s, p=0.0003). Importantly, the onset of the visual responses was nine milli-
                                    seconds slower for the DCS-MSNs (DCS = 64.84 ± 5.49 ms; DMS = 55.02 ± 8.37 ms, p=0.007)
                                    (Figure 3G), suggesting that they receive inputs from different populations of neurons. This result is
                                    consistent with the difference in cortico-striatal projections from visual areas (Hintiryan et al., 2016),
                                    in which V1 axons project to the most medial region of the striatum, while they are absent in the
                                    DCS coordinate. On the other hand, axons from anterior medial (AM) and anterior lateral (AL) visual
                                    regions, related with other aspects of the visual processing (Garrett et al., 2014; Marshel et al.,
                                    2012) reach the central region of the DS with a smaller density of projections than V1 to DMS
                                    (Hintiryan et al., 2016). This is compatible with the smaller amplitudes and slower slopes
                                    (Figure 3H,I). Thus, we support that the differences in the visual response are due to the different
                                    visual regions that are projecting to those MSNs, independently of whether they belong to DLS or
                                    DMS circuitry.

                                    DLS- and DMS-MSNs segregation is explained by their membrane
                                    potential transitions
                                    To understand the main source of differences between the integration of the spontaneous activity in
                                    the DLS- and DMS-MSNs, we started by analyzing the first ranked feature: number of peaks during
                                    Up states (Figure 1D–E, feature n˚11). We studied whether this difference occurred in cortical
                                    regions, from where they can be transmitted to the DS (Figure 4A). It is known that striatal oscilla-
                                    tions depend on the cortical ones (Kasanetz et al., 2002; Wilson, 1993) and in vitro slices contain-
                                    ing the striatum are absent of spontaneous oscillations (Planert et al., 2013).
                                       We performed in vivo whole-cell recordings in Layer V of FrA (frontal associative cortex), M1 (pri-
                                    mary motor cortex), S1 (primary visual cortex), and V1 (primary visual cortex) (Figure 4B). We found
                                    that S1 and M1 have significantly higher average number of peaks per Up state than FrA and V1
                                    (Figure 4C). This result together with previous anatomical descriptions (Alloway et al., 2006;
                                    Hoffer et al., 2003; Hooks et al., 2018) strongly suggest that the membrane dynamics inside the
                                    Up state in the DLS are controlled by the sensory-motor cortical areas.
                                       The main features for the classification of DLS- and DMS-MSNs (Figure 1G) were relative to state
                                    transitions (Up to Down transition) or intra-state transitions (number of peaks). In order to under-
                                    stand whether these differences may be caused by changes in the depolarizing and hyperpolarizing
                                    dynamics of MSNs, we studied the temporal properties of the membrane potential transitions. To
                                    analyze the convergence of synchronized hyper/depolarizing events onto MSNs that created detect-
                                    able changes in the whole-cell recording, we first detected the sharp transitions of the voltage trace
                                    and phase locked them to the SWO cycle (Figure 4D [see Materials and methods]). Thus, we
                                    obtained a measure of the temporal dynamics of hyper/depolarizing events of the MSNs. Then, we
                                    computed their ratio for the DLS- and DMS-MSNs. We found differences in the depolarizing/hyper-
                                    polarizing ratio (DH ratio) of DLS- and DMS-MSNs aligned to the transitions between Up and Down
                                    states (Figure 4E). The DH ratio was significantly higher, implying that the total balance of inputs,
                                    onto DLS-MSNs was biased toward a bigger depolarization during the transition from the Down to
                                    the Up state and toward a larger hyperpolarization values during the transition from the Up to the
                                    Down state. This is consistent with the significant differences found for both Up states slopes
                                    (Figures 1D and 4F, features 8–9).
                                       In summary, our results show that the main differences between DLS- and DMS-MSNs spontane-
                                    ous activity, selected by our classifier, are consistent with the number and the temporal distribution
                                    of the voltage fluctuations of the membrane potential during the Up states, suggesting that they are
                                    modulated by excitatory inputs from specific cortical areas and the striatal microcircuits interactions,
                                    mostly inhibitory.

                                    Sequential propagation of the cortical Up states to the striatum
                                    The SWO has a cortical origin, from where it propagates to the striatum activating MSNs
                                    (Kasanetz et al., 2002; Ketzef et al., 2017; Reig and Silberberg, 2016; Sáez et al., 2018;
                                    Wilson and Kawaguchi, 1996) and interneurons (Reig and Silberberg, 2014). In order to clarify
                                    how cortical activity is related with the DS, we studied the correlations of the Up states between

Alegre-Cortés, Sáez, et al. eLife 2021;10:e60580. DOI: https://doi.org/10.7554/eLife.60580                                           9 of 29
Research article Neuroscience Figure 4. Number of peaks and depolarized/hyperpolarized ratio of the SWO in dorsal striatum. (A) Detection of peaks (black arrows) in the Up state in a DLS-MSN (red) and a DLS-MSN (blue) (see Materials and methods). (B) Representative examples of SWO in different cortical regions recorded. (C) Figure 4 continued on next page Alegre-Cortés, Sáez, et al. eLife 2021;10:e60580. DOI: https://doi.org/10.7554/eLife.60580 10 of 29
Research article                                                                                                              Neuroscience

Figure 4 continued
Number of peaks per Up state in the different cortical regions (left). Non-labeled comparisons are not significant. (D) Extraction of depolarized/
hyperpolarized events by computational approach (see Materials and methods). Top: Detection of the events using a threshold in the first derivative of
the Vm. Scale bar represents 0.1 dmV/dt. Bottom: Representation of the detected depolarized (green) and hyperpolarized (orange) events from whole-
cell recording of a DLS-MSN (middle). (E) Average of the depolarized/hyperpolarized ratio aligned to the SWO cycle of DMS- and DLS-MSNs.
Comparison of positive (p
Research article                                                                                                              Neuroscience

                                       Next, we used the IMF carrying the slow component of the SWO (Figure 5A–B, orange line) to
                                    analyze the probability of occurrence of an Up state recorded in an MSN, following the occurrence
                                    of a cortical Up state (Figure 5F). Consistent with the correlation results, the probability that an Up
                                    state in FrA is followed by an Up state in DLS was significantly higher than in DMS. Similarly, Up
                                    states in V1 had higher probability to be followed by an Up state in DMS than in DLS. In summary,
                                    the activity from FrA and sensory-motor cortical regions (M1 and S1) is strongly related with DLS-
                                    MSNs, while the activity in V1 does with DMS-MSNs.
                                       These results predicted that, following the known propagation of the SWO across the cortex,
                                    with a predominant rostro-caudal direction (Massimini et al., 2004; Ruiz-Mejias et al., 2011), a
                                    sequential activation could be expected along the DS. In order to test this hypothesis, we first com-
                                    pared the order of transitions to an Up state recorded in both poles of the cortex by pairs of LFPs.
                                    We found an Up state in FrA preceding an Up state in V1 in the 71% of times (p value
Research article Neuroscience
53.24 ± 32.16 ms. In the rest of the cases (28.62 ± 8.77%), in which DMS-MSN preceded the DLS-
MSN, the delay was similar (average delay DLS-DMS = 51.91 ± 29.80 ms).
In conclusion, our results regarding the propagation of the cortical Up states to DS, confirm a
stronger functional coupling of FrA to DLS and V1 to DMS. This generates a sequential activation of
the DS, in which in most of the cases, DLS precedes DMS by tens of milliseconds.
Direct and indirect MSNs have distinct properties in DLS and DMS
In a final step to deconstruct DS circuitry, we studied the activity of MSNs corresponding to the
direct or indirect pathway. To understand corticostriatal dynamics it is essential to apprehend how
both pathways integrate the upstream cortical activity. To answer our question, we analyzed the
whole-cell recoding of the DS that were optogenetically identified as direct and indirect MSNs
through the optopatcher (Figure 7A, see Materials and methods). First, we analyzed whether the
features that were previously used to describe the Up states (Figure 1D) allowed us to differentiate
between the MSNs belonging to each pathway in DLS and DMS. Our results show differences in the
integration of the spontaneous activity between direct and indirect pathways only in DLS. We found
three features of the Up states that were significant different when comparing direct and indirect
MSNs in DLS: maximum and minimum membrane potential value of the Up state and the average
Figure 7. Differences between direct and indirect pathway MSNs in dorsal striatum. (A) Example showing an in vivo identification of an MSN using the
optopatcher. Responses in D2-ChR2-YFP mice (top trace, ChR2+, green) to light pulses, inducing depolarization in the MSN. Negative cells (bottom
trace, ChR2-, black) did not respond to light pulses. Blue squares indicate the intensity of the light pulse stimulation, from 20 to 100%. (B) RFE to
optimize the classification of dMSNs and iMSNs in DLS (red) or DMS (blue). A SVM with a linear kernel was selected as classification algorithm. (C)
Significant differences in three SWO features were found in DLS (red) between direct (dark) and indirect (light) pathways, but not in DMS (blue). p
Values obtained using the Wilcoxon Rank-sum test.
The online version of this article includes the following figure supplement(s) for figure 7:
Figure supplement 1. Beta, Theta, and Gamma bands in membrane voltage of direct and indirect pathways in the DLS and DMS.
Alegre-Cortés, Sáez, et al. eLife 2021;10:e60580. DOI: https://doi.org/10.7554/eLife.60580 13 of 29Research article Neuroscience
value of the Up state (Figure 7C). Then, we asked whether DLS- and DMS-MSNs could be subdi-
vided in two additional populations corresponding with the direct or indirect MSNs in both striatal
regions. The result did not yield separation, classification accuracy was 50% for DMS-MSNs and 64%
for DLS-MSNs (Figure 7B). High-frequency oscillations were also similar between pathways in both
striatal regions (Figure 7—figure supplement 1).
Finally, we studied whether the differences in the electrophysiological properties between DLS-
and DMS-MSNs, described before (Table 1), were dependent on one of the two pathways. Resis-
tance values, during Down states, were significantly higher for indirect DLS-MSNs compared to indi-
rect DMS-MSNs, while no differences were found between direct DLS- and DMS-MSNs (Table 1).
In summary, our results show that DLS- and DMS-MSNs cannot be subdivided by the direct and
indirect pathways. However, their differences in resistance and integration of the spontaneous activ-
ity demonstrate that direct and indirect MSNs have distinct properties in the DLS and DMS.
Discussion
Circuits are limited but not defined by their anatomy; different axonal projections, cell types and syn-
aptic dynamics delimit their spontaneous and evoked activity patterns. In this study, we have
described two functional circuits in the anatomically homogenous DS, covering the medial and lat-
eral regions and separated by a sharp functional boundary. We discriminated DLS and DMS circuits
based on different properties of their spontaneous activity recorded in MSNs by means of the in
vivo whole-cell patch-clamp technique. The use of an anesthetized preparation was convenient for a
number of reasons; first, it granted the mechanical stability that allowed the recording of our dataset
that includes whole-cell patch clamp recordings in multiple cortical and striatal areas, specially the
double patch-clamp recordings in the striatum. In addition, during anesthesia, as well as sleep and
resting awake periods, the brain activity is in the SWO regime (Poulet and Crochet, 2018). This ste-
reotyped brain state is highly characterized extra- and intracellularly (Sanchez-Vives et al., 2017),
and consists on slow traveling waves of cortical origin that will propagate to multiple cortical and
subcortical areas, including the striatum. This approach allows the study of the functional constrains
in the striatum that will modulate this spontaneous activity and are still present during awake or
evoked states (Getting, 1989; Luczak et al., 2015), when striatal activity is more desynchronized
(Mahon et al., 2006). Thus, the SWO is an adequate brain state to understand the functional organi-
zation of the DS.
To analyze the oscillatory activity, we used NA-MEMD algorithm (Rehman and Mandic, 2010)
together with Hilbert transform (Huang et al., 1998). This algorithm is suited to decompose nonlin-
ear nonstationary signals (Alegre-Cortés et al., 2017; Alegre-Cortés et al., 2016; Hu and Liang,
2014; Mandic et al., 2013). Given the well-known nonlinear properties of neural oscillations
(Averbeck et al., 2006; Cole et al., 2017; Laurent, 1996; Shamir and Sompolinsky, 2004), the use
of NA-MEMD leads to an increased detail of description when compared with traditional techniques
(Alegre-Cortés et al., 2017; Hu and Liang, 2014). In our knowledge is the first time that it is used
to analyze membrane oscillations of single neurons.
In humans, the dynamics of the SWO have demonstrated to be highly reproducible within and
across subjects, providing information about the general state of the cerebral cortex and suggesting
its applicability as a method to unravel functional circuits (Massimini et al., 2004). The analysis of
the SWO has been used to detect neurophysiological alterations in humans and in a mouse models
of neurological disorders such as; Alzheimer’s disease (Busche et al., 2015), Down syndrome (Ruiz-
Mejias et al., 2016), or epilepsy (Amiri et al., 2019), among others. Here, we analyzed the electro-
physiological properties of MSNs, their evoked visual responses and the slow and the fast compo-
nents of their oscillatory activity, and we found that the Up states of the SWO are useful method to
identify brain circuits. Therefore, we are extending the previous concept and proposing a methodol-
ogy to study the brain functional connectivity.
DLS and DMS are two different functional circuits in mouse
We have shown that DS is divided in two different circuits, demonstrating the presence of a sharp
functional transition from one circuit to another in the central region of the DS. This sharp transition
is unexpected given the anatomical organization of corticostriatal projections, due to the profusion
of axon terminals which provide overlapping inputs from multiple cortical areas to several regions of
Alegre-Cortés, Sáez, et al. eLife 2021;10:e60580. DOI: https://doi.org/10.7554/eLife.60580 14 of 29Research article Neuroscience
the DS (Alloway et al., 2006; Hintiryan et al., 2016; Hoffer et al., 2003; Hoover et al., 2003).
Hence, an essential question arises: why do we find a sharp boundary instead of a gradient transition
between DLS- and DMS-MSNs? Our results show that the number of peaks during Up states is a crit-
ical feature to discriminate between DLS- and DMS-MSNs (Figure 1E), being higher in DLS-MSNs
(Figure 1D, feature 11). In order to understand this result, we recorded layer V neurons in FrA, M1,
S1, and V1, showing a larger number of peaks during Up states in FrA, M1, and S1 than in V1
(Figure 4C). This suggests that, in agreement with previous anatomical studies (Alloway et al.,
2006; Hoffer and Alloway, 2001; Hooks et al., 2018), somatosensory-motor and premotor cortical
regions exert sharper modulation onto the DLS-MSNs than onto DMS-MSNs, which is more anatomi-
cally connected with visual, associative, and limbic prefrontal cortical areas (Hintiryan et al., 2016;
Hunnicutt et al., 2016). We also observed a higher number of peaks between M1-S1 with respect
to FrA (Figure 4C). These results suggest that the dynamics of the excitatory/inhibitory inputs during
the Up states change between cortical areas and subsequently influence the striatum, opening an
interesting question regarding the circuit mechanism underlying the observed cortical Up states
differences.
Together with the cortical glutamatergic inputs, several additional factors may contribute to gen-
erate a functional boundary. Our classification reached ~ 90% of accuracy between DLS- and DMS-
MSNs when the Up to Down state transition slopes were added (Figure 1E). Moreover, the Down to
Up transition and transition ratio were both significantly different between DLS- and DMS-MSNs as
well (Figure 1D). Therefore, Up states slopes are key elements to discriminate between dorsal stria-
tal circuits too. In order to better understand the undergoing dynamics that could explain the differ-
ences in the slopes, we measured the time course of depolarized and hyperpolarized events of the
MSNs during the SWO (Figure 4D) and compared them using the DH ratio (Figure 4E). Our results
show more positive and negative ratio to the DMS-MSNs during the upward and downward Up
states transitions slopes respectively, suggesting a different EI balance in the DLS compared to
DMS. Cortical SWO propagates to both types of MSNs but also to FS and ChI (Reig and Silberberg,
2014). FS interneurons provide strong feedforward inhibition to MSNs (Gittis et al., 2010;
Szydlowski et al., 2013; Tepper et al., 2008). Previous reports demonstrated the presence of a FS
gradient (Gerfen et al., 1985; Kita et al., 1990; Monteiro et al., 2018) or diverse types of PV inter-
neurons with different electrophysiological properties along DS (Monteiro et al., 2018; Muñoz-
Manchado et al., 2018). In addition, in cortical slices with spontaneous SWO both upward and
downward transition slopes are controlled by GABAA and GABAB receptor activation (Perez-
Zabalza et al., 2020; Sanchez-Vives et al., 2010). Based on these evidences, and beyond the gluta-
matergic inputs, we hypothesize that PV interneurons may greatly influence the Up states slopes of
DLS-MSNs making them different from DMS ones.
In addition, other mechanisms can also contribute to the generation of a functional boundary; for
instance, a similar scenario exists for ChIs, which present a functional gradient with higher activity in
the medial regions of the striatum (Abudukeyoumu et al., 2019; Matamales et al., 2016). ChIs
could modulate differently the SWO in DLS- and DMS-MSNs by disynaptic inhibition (English et al.,
2012). Under anesthesia, dopaminergic neurons of the Substantia Nigra discharge spontaneous
action potentials, in tonic or burst firing mode (Aristieta et al., 2016; Brown et al., 2009). This
dopaminergic activity could induce different effects in the SWO in DLS- and DMS-MSNs, either
directly mediated by distinct dopaminergic projections (Brown et al., 2009) or indirectly by their
varied impact in ChIs activity along the mediolateral axis (Chuhma et al., 2018). Finally, it has been
recently shown that SOM corticostriatal interneurons modulate the MSNs activity from motor cortical
areas (Melzer et al., 2017; Rock et al., 2016). This type of interneuron could regulate the Up states
transitions slopes directly, inhibiting the MSNs in their distal dendrites. Future work will have to
determine whether FS, ChI, SOM or maybe other types of interneurons and neuromodulators con-
tribute to the generation of the sharp functional boundary between DLS and DMS.
DLS and DMS are not defined by their sensory responses
Previous studies demonstrated that MSNs in the DS respond to sensory stimulation (Ketzef et al.,
2017; Pidoux et al., 2011; Reig and Silberberg, 2014; Sippy et al., 2015). MSNs in the lateral and
medial regions of the DS are activated by whisker stimulation, with bigger and sharper responses in
the lateral region, which receives greater density of axons from S1. On the other hand, visual
responses seem restricted to more medial territories, consistent with their corticostriatal projections
Alegre-Cortés, Sáez, et al. eLife 2021;10:e60580. DOI: https://doi.org/10.7554/eLife.60580 15 of 29Research article Neuroscience
(Reig and Silberberg, 2014). Because the detected functional border is located in between these
two striatal regions, we explored whether the previously described differences in the response to
visual stimulation in DMS and DLS (Reig and Silberberg, 2014) was also present in the MSNs
recorded in our DCS striatal coordinate, and therefore could let us to discriminate between DLS-
and DMS-MSNs along the whole medio-lateral axis. Tactile-whisker stimulation was discarded
because MSNs from lateral and medial regions respond to this sensory modality, with no differences
in onset delay (Reig and Silberberg, 2014). Therefore, we tested whether neurons recorded in the
functional border between DLS and DMS and classified as DLS- or DMS-MSNs responded to visual
stimulation. We found that the 47% of MSNs recorded in the DCS coordinate responded to visual
stimulation and the 17% were also labeled as DLS-MSNs by our classifier (Figure 3E). Then, we com-
pared visual responses between MSNs recorded in the DCS and DMS coordinates. We found that
they differ in their responses, including their onset delay (Figure 3F–I): MSNs in the DMS coordinate
responded 9 ms earlier than the ones in the DCS coordinate. This strongly suggests that cortical
axons sending visual information to the striatum have diverse cortical origin. A previous anatomical
study Hintiryan et al., 2016 demonstrated that the striatal region in which our DCS coordinate was
located receives axons from the anteromedial (AM) and anterolateral (AL) areas of the visual cortex,
while the DMS one does from V1, AM, and AL. In the hierarchy of visual areas, V1 sends abundant
feedforward projections to AM and AL (Garrett et al., 2014), which could underlie the observed dif-
ferences in onset delays. Thus, bringing together our results and the previous anatomical descrip-
tion, we hypothesize that, while the most lateral territories of the DLS are not involved in visual
processing, there is a disparity of axons from several visual areas sending different information along
the DS, which does not overlap with the internal organization of the DS in DLS and DMS. The func-
tional specialization of V1, AM, and AL cortical areas compromise different properties of the visual
information (Marshel et al., 2012), most probably, transmitting their particular attributes to the
DLS- and DMS-MSNs that they contact. Future works are required to fully understand the spectra of
sensory responses along the mediolateral axis of the DS. For instance, it remains as an open ques-
tion a detailed understanding of how the specific properties of somatosensory or visual stimuli, are
encoded along the latero-medial axis of the striatum.
In conclusion, the functional circuitry of the striatum cannot be described based on their
responses to sensory stimulation. The DS is divided in two regions as a result of the large diversity of
corticostriatal and probably other afferent projections, together with differences at the level of their
microcircuits. On the other hand, while sensory inputs may not determine the overall dynamics of
DLS or DMS circuitry, they govern the sensory responses of the MSNs in the specific striatal coordi-
nates on which they project.
Propagation of the cortical Up states to the striatum
SWO propagates along the cortical network (Sanchez-Vives and McCormick, 2000) and is transmit-
ted to the striatum (Reig and Silberberg, 2014; Wilson and Kawaguchi, 1996) as well as to other
subcortical nuclei (Ros et al., 2009; Steriade et al., 1993). Decortication or disruption of the cortical
SWO impairs the striatal ones (Kasanetz et al., 2002; Wilson, 1993) and on the other hand, striatal
slices are absent of rhythmic spontaneous activity (Planert et al., 2013).
As occurs in human slow-wave sleep (Massimini et al., 2004), anesthetized mice exhibit a pre-
dominant pattern of SWO propagation from rostral to caudal brain poles (Ruiz-Mejias et al., 2011).
Here, we show how the correlation and the probability of transition of an Up state from FrA is higher
to the DLS, while an Up state recorded in V1 has higher probability to propagate to the DMS
(Figure 5D–F). These results suggest a sequential activation of DMS and DLS, similar to the one
between both poles of the cortex during the SWO. As discussed before, this result describes the
corticostriatal propagation of the SWO, which is different of the modulation of MSNs activity during
the Up states. In order to test this hypothesis, we simultaneously recorded pairs of MSNs in DLS and
DMS, in our knowledge this is the first time that double in vivo patch-clamp recordings are shown in
the striatum. We found a similar probability of an Up state to appear in DLS before DMS and to
appear in FrA before V1 (Figure 6). This description of the overall dynamics of corticostriatal trans-
mission is based on functional, rather than anatomical connectivity, supporting a stronger coupling
of caudal, sensory related cortical regions to DMS, whereas premotor and sensory-motor frontal
regions are more tightly connected to DLS. Consistent with this, the sequential activation of both DS
regions during a two-forced-decision-task has been recently reported, in which DMS was first
Alegre-Cortés, Sáez, et al. eLife 2021;10:e60580. DOI: https://doi.org/10.7554/eLife.60580 16 of 29Research article Neuroscience
activated during the sensory stimulation period, followed by an increase in DLS activity coinciding
with decision making and motor preparation/execution (Peters et al., 2019).
Finally, the number of peaks during Up states, the first feature selected to classify between DLS-
and DMS-MSNs, were prominent in the DLS-MSNs (Figure 1D) as well as in S1 and M1 (Figure 4B–
C). These results together with the anatomical descriptions (Alloway et al., 2006; Hoffer et al.,
2003; Hooks et al., 2018) and a recent in vivo synaptic transmission experiments (Charpier et al.,
2020), strongly suggest that the activity inside the Up state of the DLS-MSNs is controlling by sen-
sory-motor areas. In addition, FrA send copious projections to the DLS (Hintiryan et al., 2016;
Hunnicutt et al., 2016) and we found that correlations and probability of propagation of Up states
to DLS were higher for FrA than S1 and M1 (Figure 5D–F).
Considering this results together, we suggest that, when a slow wave starts in the rostral part of
the cortex, FrA projections trigger the Up state in DLS, but rarely DMS. Then, once the wave reaches
somatosensory-motor areas, they will modulate the activity of DLS-MSNs, which are already in an Up
state. In agreement, it was shown that the blockage of synaptic transmission in S1 by TTX application
during bilateral whisker stimulation blocked whisker responses but not the Up states in DLS-MSNs
(Reig and Silberberg, 2016), demonstrating that their Up states were not triggered by S1. There-
fore, we hypothesize that during awake states, FrA could act as a gain modulator of DLS that will
facilitate its response to somatosensory-motor inputs.
High-frequency oscillations
High-frequency oscillations are usually associated with wakefulness. However, they also occur during
the SWO in natural sleep, under anesthesia (Steriade et al., 1996) and in isolated cortical slices
(Compte et al., 2008). Especially relevant regarding the cortico-basal ganglia-thalamic loop are
beta oscillations, which have been linked with the control of voluntary movements. Differences in
Beta oscillations between caudate and putamen were reported in healthy monkeys at the end of a
learned motor task (Feingold et al., 2015). Exaggerated Beta oscillations occur in Parkinson’s Dis-
ease and in rats under dopamine depletion (Brown, 2003; Mallet et al., 2008; Sharott et al.,
2017). Our results did not show differences between DLS- and DMS-MSNs for theta and gamma
bands (Figure 2—figure supplement 1), however a difference in beta energy was detected (Fig-
ure 2). Possible candidates to explain the observed higher beta energy in DMS-MSNs are ChI. This
type of interneurons are more active in the DMS (Matamales et al., 2016) and can facilitate gluta-
mate release from presynaptic terminals to the MSNs (Abudukeyoumu et al., 2019). Thus, they
might promote the fast glutamatergic transmission observed in DMS.
Our work adds further detail to the description of beta oscillation in healthy mice thanks to the
use of NA-MEMD together with Hilbert transform (Figure 2—figure supplement 2), providing a
new substrate for the study of aberrant beta oscillations in Parkinson disease. This result may indi-
cate that the aberrant oscillations in Parkinson disease may be produced by the misbalance of nor-
mal striatal dynamics, as previously suggested (McCarthy et al., 2011).
We also analyzed the fast oscillatory activity to classify DLS- and DMS-MSNs, however this infor-
mation was not useful for that purpose. Unlike other faster oscillatory bands, the ~ 1 Hz oscillation,
which constitutes the main component of the SWO brain state, is described as highly reproducible
within and across subjects. Based in this property, it was suggested as a method to study neuronal
changes and connectivity in humans (Massimini et al., 2004). Our negative result using the fast oscil-
latory activity reinforces the idea that the ~ 1 Hz component of the SWO is a particular useful model
to study functional connectivity.
Integration of the spontaneous activity in the direct and indirect MSNs
along the DS
Cortical inputs innervate the DS targeting both the direct and indirect pathway MSNs (Doig et al.,
2010; Kress et al., 2013; Wall et al., 2013). Both types of MSNs are co-activated during action initi-
ation (Cui et al., 2013) and respond to tactile and visual stimulation (Reig and Silberberg, 2014).
However, a large number of studies described differences between direct and indirect MSNs in the
DLS: dMSNs have higher density of cortical and thalamic afferent synapses (Huerta-Ocampo et al.,
2014), bigger response to whisker stimulation (Ketzef et al., 2017; Reig and Silberberg, 2014;
Sippy et al., 2015) and based on in vivo SWO, it has been estimated that dMSNs receive stronger
Alegre-Cortés, Sáez, et al. eLife 2021;10:e60580. DOI: https://doi.org/10.7554/eLife.60580 17 of 29Research article Neuroscience
synaptic input than iMSNs (Filipović et al., 2019), among other differences. Here, we have
described changes in the activity integration between pathways in the DLS-MSNs (Figure 7C), which
are absent in the DMS-MSNs. Despite these differences, our results show that both DLS and DMS
are unified circuits that involve both pathways.
Previous in vitro (Planert et al., 2010) and in vivo (Ketzef et al., 2017; Reig and Silberberg,
2014) studies in the DLS showed that iMSNs have higher input resistance than dMSNs. While
observed a similar trend, the main difference in the input resistance was detected between DLS-
MSNs and DMS-MSNs, with bigger values in DLS. Moreover, this result was weighted by the iMSNs
located in the DLS, which displayed the highest values of resistance and were statistically different
than iMSNs in the DMS (Table 1). Interestingly, this variation between iMSNs located in both striatal
regions occurred during Down states, when MSNs are mainly silent, suggesting that changes in resis-
tance are independent of the glutamatergic inputs. It is known that dopamine alters the input resis-
tance of MSNs in vivo (Ketzef et al., 2017). Therefore, distinct dopaminergic innervation of the
DLS- and DMS-MSNs (Chuhma et al., 2018) could underlie our differences in resistance between
striatal regions.
Conclusion
Human caudate and putamen have been compared to the rodent DLS and DMS, respectively
(Balleine and O’Doherty, 2010), based in their corticostriatal connectivity and behavioral functions.
Yet, a study of the circuitry that supported this division was necessary. Here, we have shown how
DLS and DMS are two non-overlapping circuits isolated by a sharp functional boundary. This work
provides further understanding of the corticostriatal organization and reveals the biological sub-
strate to divide the DS in two different circuits. We have shown how DLS- and DMS-MSNs display
independent spontaneous regimes during SWO brain state, that can only be explained by a combi-
nation of particular corticostriatal functional connectivity and microcircuit properties. Visual evoked
responses in particular demonstrated that the differences between DLS and DMS circuits cannot be
reduced to their interaction with sensory cortices. In conclusion, our results provide the required
understanding to support that this functional segregation is analogous to the anatomical and func-
tional division of the primate striatum in caudate and putamen. Considering the relevance of the
mouse striatum as a model for multiple human diseases, our results indicate that research will have
to consider the idiosyncrasy of the two regions of the DS.
Materials and methods
Key resources table
Reagent type
(species) or Source or Additional
resource Designation reference Identifiers information
Genetic reagent BAC-Cre Drd2-44 or GENSAT RRID:MMRRC_ Males and
(M. musculus) STOCK 017263-UCD females used
Tg(Drd2-cre)
ER44Gsat/Mmcd
Genetic reagent Ai32 or Ai32(RCL- The Jackson Stock No: 012569 Males and
(M. musculus) ChR2(H134R)/EYFP) Laboratory females used
or B6;129S-
Gt(ROSA)
26Sortm32(CAG-
COP4*H134R/
EYFP)Hze/J
Genetic reagent C57BL/6J or Charles River Strain Code: 027 Males and
(M. musculus) C57BL/6NCrl Laboratories females used
Other Cy3 conjugated Jackson Cat#: 016-160-08 1:1000
streptavidin ImmunoResearch Lot. #125000
Laboratories
Chemical Ketamine, Alvet Escartı́ S.L. Ref. # 078100377 100 mg/ml
compound, Ketamidor
drug
Continued on next page
Alegre-Cortés, Sáez, et al. eLife 2021;10:e60580. DOI: https://doi.org/10.7554/eLife.60580 18 of 29Research article Neuroscience
Continued
Reagent type
(species) or Source or Additional
resource Designation reference Identifiers information
Chemical Medetomidine, Alvet Escartı́ S.L. Ref. # 005100740 10 ml
compound, Sedine
drug
Chemical Sodium Alvet Escartı́ S.L. Ref. # 015P5502 200 mg/ml, 100 ml
compound, Pentobarbital,
drug Dolethal
Software, Spike2 Cambridge Electronic n/a Version 9
agorithm Design Limited (CED)
Software, Matlab Mathworks n/a Version 2018
algorithm
Software, Support Vector Cortes and Vapnik, 1995 n/a https://www.
algorithm Machine (SVM) doi: https://doi.org/ scipy.org/
10.1007/BF00994018
Software, NA-MEMD Rehman and Mandic, 2010 n/a http://www.commsp.
algorithm doi: https://doi.org/ ee.ic.ac.uk/~mandic/
10.1098/rspa.2009.0502 research/emd.htm
Ethical permit
All the experimental procedures were conformed to the directive 2010/63/EU of the European Par-
liament and the RD 53/2013 Spanish regulation on the protection of animals use for scientific pur-
poses, approved by the government of the Autonomous Community of Valencia, under the
supervision of the Consejo Superior de Investigaciones Cientı´ficas and the Miguel Hernandez Univer-
sity Committee for Animal use in Laboratory.
Animal model
D2-Cre (ER44 line, GENSAT) mouse line was crossed with the Channelrhodopsin (ChR2)-YFP
reporter mouse line (Ai32, the Jackson laboratory) to induce expression of ChR2 in indirect MSNs
and was used to perform optogenetic differentiation of direct (dMSN) and indirect (iMSNs) MSNs
(Ketzef et al., 2017), while performing electrophysiological recordings in the striatum (n = 36 mice).
C57BL6 mice were used to perform the rest of the electrophysiological recordings of cortical neu-
rons (n = 9).
Electrophysiological recordings
Adult mice of both sexes (47 animals, 20 males, and 27 females), between 12 and 44 weeks of age
were used to perform the experiments (Supplementary file 1B). Anesthesia was induced by intra-
peritoneal injection of ketamine (75 mg/kg) and medetomidine (1 mg/kg) diluted in 0.9% NaCl. A
maintaining dose of ketamine (30 mg/kg i.m.) was administrated every 2 hr, after changes in the fre-
quency of spontaneous activity recorded by cortical LFP or reflex responses to paw pinches. Trache-
otomy was performed to increase mechanical stability during recordings by decreasing breathing
related movements. Mice were placed in a stereotaxic device and air enriched with oxygen was
delivered through a thin tube placed 1 cm from the tracheal cannula. Core temperature was moni-
tored and maintained at 36.5 ± 0.5˚C using a feedback-controlled heating pad (FHC Inc). Cranioto-
mies were drilled (S210, Camo) at seven sites for patch-clamp and extracellular recordings (from
Bregma): AP 0 mm, L 2.5 mm (DMS); AP 0 mm, L 4 mm (DLS); AP 0 mm, L 3,25 mm (DCS); AP 2.7
mm, L 1 mm (FrA); AP 1.5 mm, L 2.0 mm (M1); AP 1.5 mm, L 3.25 mm (S1); AP 3.5 mm from
Bregma, L 2.5 mm (V1) (following Paxinos and Franklin, 2001). When additional paired recordings
were performed, the craniotomies were drilled at the following coordinates (from Bregma): AP 0
mm, L 1 mm (DMS); AP 0 mm, L 4 mm (DLS). Animals were sacrificed after recordings by injecting
an overdose of sodium pentobarbital (200 mg/kg I.P.).
Alegre-Cortés, Sáez, et al. eLife 2021;10:e60580. DOI: https://doi.org/10.7554/eLife.60580 19 of 29You can also read