MEDIUM TERM BUDGET POLICY STATEMENT - PREVIEW FISCAL SLIPPAGE VS. FISCAL CONSOLIDATION - SEPTEMBER 2017 - Nedbank CIB
←
→
Page content transcription
If your browser does not render page correctly, please read the page content below

MEDIUM TERM BUDGET POLICY STATEMENT – PREVIEW

                      FISCAL SLIPPAGE VS. FISCAL CONSOLIDATION
                                                  SEPTEMBER 2017

Reezwana Sumad
ReezwanaS@Nedbank.co.za

                                              1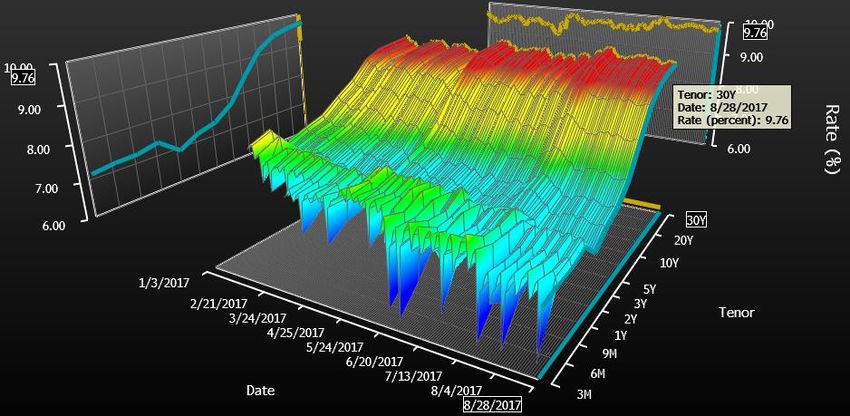
Contents
EXECUTIVE SUMMARY Economic outlook
Revenue
Expenditure and Debt
Government Financing and issuance
Credit ratings implications
Consolidation measures
We are currently in a low-growth trap and this will likely weigh significantly on the revenue outlook over the medium-term. Unless confidence levels are boosted, SA is
likely to achieve fractional or low single-digit growth rates over the next three to five years. We anticipate a 50bps miss in the 2017/18 growth forecast, which may result
in a lower-than-projected 6.3% nominal GDP growth rate and a R44 billion revenue shortfall (which would likely emanate from the PIT and VAT categories). The V-
shaped recovery in revenue growth projections by National Treasury (NT) is unlikely to materialise given lower gross earnings, higher unemployment, subdued growth,
subdued corporate profits, and a still fragile household sector.
Total FYTD expenditures have surged by 8.4% yoy. July expenditures were up almost 14% yoy and 34% mom. This means that revenue collection is slipping further
away from the 2016/17 run rate of 28.7% (currently 26.9%), while expenditures have now overtaken the prior year’s run rate of 32.8% (currently 32.9%).
We believe that the Minister of Finance, Malusi Gigaba, is tasked with the most difficult budget of recent times – with the expenditure ceiling needing to be calibrated on
a lower potential growth rate, it could mean the end of Treasury’s commitment to fiscal consolidation which would likely yield a downgrade (and a shock to already-low
confidence levels).
The government’s financing strategy is focused on mitigating the risks arising from an increase in redemptions over the medium-term. For this reason, NT has engaged
in switch auctions. However, curve steepening has made this more expensive. NT is paying at least 55bps more for its issuance of long-dated bonds compared to eight
months ago.
NT is rolling over its near-term maturity risk out to between 2026 and 2048 by engaging in switch auctions which will result in a sharp increase in debt service costs in
the outer years. Oddly enough, this stands in stark contrast to what Pravin Gordhan indicated in February 2017, “By acting now to stabilise debt, government is ensuring
that future generations will not be paying taxes for today’s expenses 20 or 30 years from now.” The increase in debt stock, the issuance of longer-dated bonds that
attract higher interest payments, and the exchange of short- for longer-dated instruments, should put further upward pressure on debt-service costs.
We believe Minister Gigaba and the Treasury team will be walking a tightrope in trying to maintain its promises of narrowing the deficit such that a primary budget
surplus is achieved in 2018/19. We think that the pressure of ensuring limited fiscal slippage is greater than the pressure of ensuring fiscal consolidation at this stage.
This is due to there being a greater likelihood of a further deterioration (wider deficit) than an improvement in the fiscal metrics in the current environment in our opinion.
2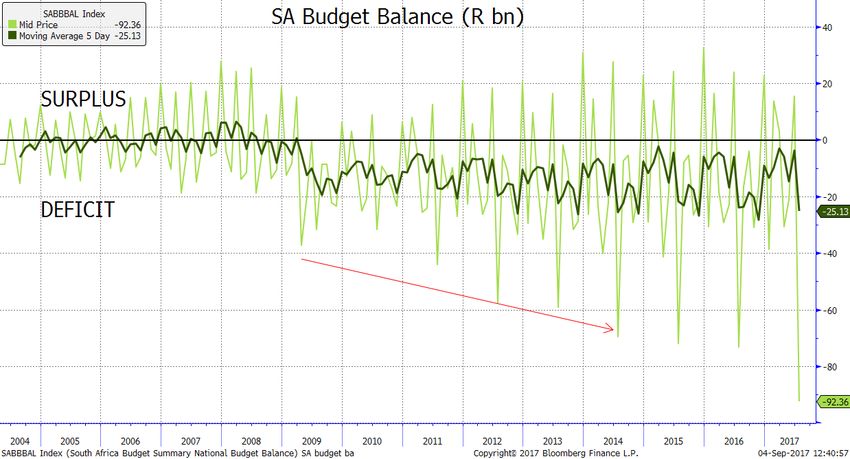
ECONOMIC OUTLOOK
ROLLING FORWARD BUSINESS CYCLE LOWS
Two years ago, the MTBPS assumed a low in the business cycle which was expected to pass. Fast forward to 2017, and SA seems to be stuck in a low-growth trap,
precisely the dilemma which NT tried to avoid last year as then Finance Minister Pravin Gordhan highlighted “Much depends on joint action to restore confidence and
mobilise private investment to avoid a low-growth trap”. It seems like this statement can be rolled forward every year, until the government takes heed of this advice and
the actual implementation of the NDP starts to happen with greater vigour. The concerns in the 2016 MTBPS will likely remain the concerns in this year’s MTBPS, but
with greater urgency for change, particularly as we have experienced the very recession and downgrades that were thought to have been avoided last year. As we head
closer to the 2019 national elections, the need for better service delivery and greater job creation will take precedence over growth-enhancing policy reform. However,
we could be proven wrong if fiscal policy does not become politicised.
The premise that we have ‘kicked the can down the road’ in terms of the business cycle low and recent recession bodes negatively for potential growth, essentially
lowering the entire profile out to 2020. What this also means is that the hurdle rate has risen – lower projected growth will translate to lower revenue collection, unless
the Finance Minister shows greater creativity and flexibility in attracting revenues and is able to reduce wasteful expenditure materially. This will mean that we have a
constrained resource pool chasing a ballooning expenditure budget, which will likely require greater debt issuance, rising debt levels, rising debt repayment costs which
will require better growth and revenue collection to finance the rising expenditure. This is a virtuous cycle, unless the current low-growth trap is escaped and confidence
is restored, thereby channelling better revenues.
5 Real GDP forecasts - evolution 2012 Budget
4.5 2012 MTBPS
2013 Budget
4
Source: National Treasury, Nedbank CIB calculations 2013 MTBPS
3.5
2014 Budget
3 2014 MTBPS
2.5 2015 Budget
%
2 2015 MTBPS
2016 Budget
1.5
2016 MTBPS
1
2017 Budget
0.5 2017 MTBPS (f)
Low? Low? Low?
0 Actual
2012/13 2013/14 2014/15 2015/16 2016/17 2017/18 2018/19 2019/20
3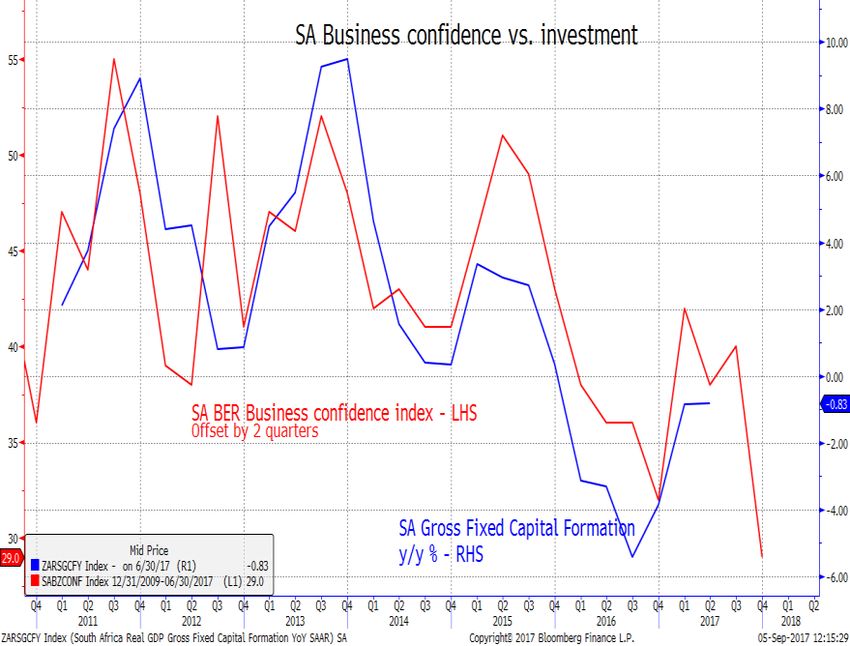
ECONOMIC OUTLOOK
SA FINDS ITSELF TRAPPED IN A LOW GROWTH TRAP
The CEO Initiative was presented in the February Budget as one of the collaboration efforts of Government to support growth and yield transformation within the private sector. Indeed, prior
to the Cabinet reshuffle in March, there were ‘green shoots’ appearing from this collaboration, with some improvement in business confidence and a narrower contraction in investment
spending. This was highlighted by Gordhan, “The green shoots of an economic recovery are reflected in new investment plans.” It was also lauded as the mechanism which resulted in an
aversion of a sovereign credit rating downgrade in 2016. However, communication seems to have broken down post the reshuffle and this coincided with sub-investment grade downgrades
by two credit rating agencies. This now seems to have done irreversible near-term damage to business confidence in SA, with private sector investment remaining weak instead of
recovering as expected earlier.
Nedbank projects growth rates of 0.6%, 1.3% and 1.9% over the next three calendar years. This is in contrast to 1.3%, 2.0% and 2.2% expected by the National Treasury. We
expect to see the NT rationalise their forecasts lower over the forecast period, closer to our expectation. Given recent Stats SA GDP data which reflected a recession at the end of
FY2016/17, we believe the GDP forecast for the four fiscal years from 2016/17 onwards will be revised lower to 0.6%, 0.8%, 1.6% and 1.9% (from 1.2%, 1.3%, 2.1% and 2.3%).
The February Budget noted that a few conditions should support the recovery locally, that being stronger global growth (yes – IMF and World Bank have increased their global growth
forecasts), favourable weather conditions (yes – currently forecasting bumper agricultural crop harvests), reliable electricity supply (yes – but mainly because electricity consumption has
declined 0.6% yoy), less volatile labour relations (yes – fewer number of days lost to strikes compared to 2014), recovering business and consumer confidence (no – these have deteriorated
markedly), and stabilising commodity prices (yes – SA terms of trade (TOT) is 19% higher for the YTD). The above checklist is worrying – even though all exogenous conditions are
conducive to better growth, SA’s growth outlook has deteriorated because of the confidence recession we currently find ourselves in.
We are currently in a low-growth trap and this will likely weigh significantly on the revenue outlook over the medium-term. Unless confidence levels are boosted, SA is likely to
achieve fractional or low single-digit growth rates over the next three to five years. This will likely mean that we (again) defer fiscal consolidation, as NT’s main focus will be to avoid
fiscal slippage. This scenario will bring about further credit rating downgrades if NT fails to arrest the fiscal slippage soon.
Source: Bloomberg,
Nedbank CIB
4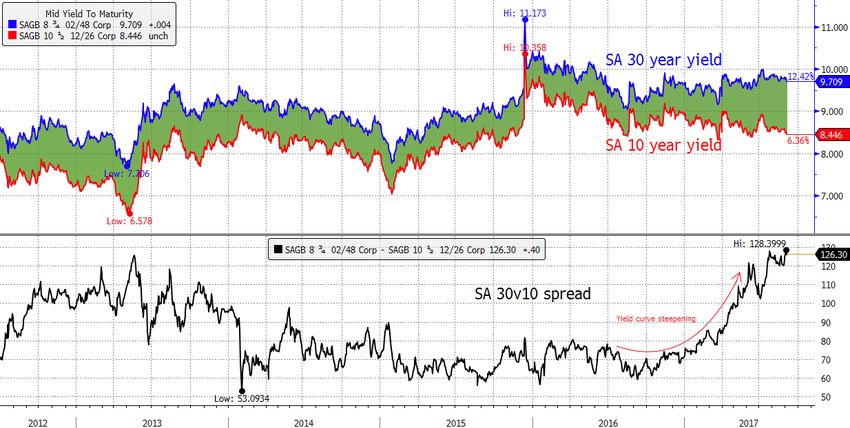
FISCAL POLICY
REVENUE
Credit rating agencies have scrutinized the government’s commitment to fiscal
consolidation, and while a leadership change at the National Treasury throws in some
uncertainty to this commitment, the new leadership has communicated its commitment to
maintaining the fiscal framework set out by Pravin Gordhan, while still making way for
‘radical economic transformation’ initiatives. How Minister Gigaba will designate a limited
pool of revenues (which will probably disappoint again this year) to a growing list of
expenses is yet to be seen. We venture a few calculated guesses ahead of the MTBPS.
What does not take much guessing is the fact that more needs to be done to spur
confidence, spending, investment, growth and revenues. Revenue collection for the
current FYTD is under pressure as tax collection is undershooting the projected
February growth forecast of 10.6% fyoy. To say that this projection is optimistic is an
understatement in our view, particularly as the NT’s track record of forecasting revenues
has been dismal because of the following non-exhaustive list of reasons: the average
growth rate of gross tax revenue for the last four years has been 8.9%; in a year in which
real GDP growth of 2.3% materialised, tax revenue growth was indeed 10.6%, but in the
current fiscal year real GDP growth is expected at 0.8%; in the last four out of five fiscal
years, there have been revenue shortfalls of about (a cumulative) R60 billion with more
than half of this total coming from the last fiscal year; business confidence is at the lowest Source: Bloomberg, Nedbank CIB
since 2009 and consumer confidence is negative, both of which imply subdued revenue
collection across the top 3 revenue pools – PIT, VAT and CIT.
Real GDP growth Gross tax revenue (Rbn) Main budget expenditure (Rbn) Tax Buoyancy
Forecasted Actual Difference Forecasted Actual Difference Forecasted Actual Difference Nominal GDP growth Tax revenue growthBuoyancy
2012/13 3 2.1 -0.9 826.4 813.8 -12.6 969.4 965.5 -3.9 8 9.6 1.2
2013/14 3 2.3 -0.7 898 900 2 1055.1 1047.8 -7.3 9.1 10.6 1.2
2014/15 2.9 1.8 -1.1 993.6 986.3 -7.3 1142.6 1131.9 -10.7 6.6 9.6 1.5
2015/16 2 0.6 -1.4 1081.3 1070 -11.3 1222.3 1244.6 22.3 5.8 8.5 1.5
2016/17 1.2 0.6 -0.6 1174.8 1144.1 -30.7 1318.3 1303.8 -14.5 7 6.9 1.0
2017/18f 1.3 0.8 -0.5 1265.5 1409.2 7.5 10.6 1.4
2018/19f 2.1 1.6 -0.5 1384.4 1522.2 8.2 9.4 1.1
2019/20f 2.3 1.9 -0.4 1507.5 1652.2 8.1 8.9 1.1
Red: Nedba nk CIB expecta ti on f=2017 Budget Revi ew foreca s t Source: Na ti ona l Trea s ury
5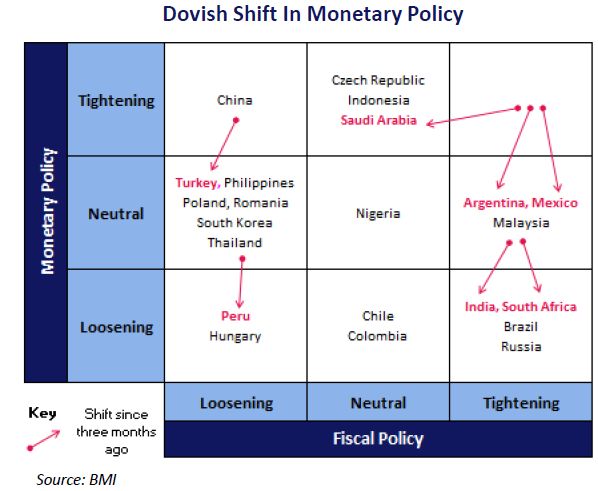
REVENUE
REVENUE SHORTFALL A FOREGONE CONCLUSION IN THE CURRENT LOW-GROWTH ENVIRONMENT
The current growth rate in tax revenue is a meagre 6.7% FYTD yoy. CIT PIT VAT
Assuming this growth rate is maintained for the full fiscal year Forecasted Actual Difference Forecasted Actual Difference Forecasted Actual Difference
would imply a R44 billion shortfall in revenue collection (relative to 2012/13 167.8 159.3 -8.5 286 275.8 -10.2 209.7 215 5.3
February’s Budget estimates). Assuming an 8.9% growth rate, this 2013/14 169.8 177.3 7.5 306.2 309.8 3.6 243 237.7 -5.3
would imply a R20 billion revenue shortfall in the current fiscal year 2014/15 198.9 184.9 -14 335.9 352.9 17 267.2 261.3 -5.9
relative to February projections. This amounts to a shortfall of 2015/16 202.03 191.2 -10.83 393.9 388.1 -5.8 283.8 281.1 -2.7
between 0.5% and 0.8% of GDP. If expenditure is not cut by a 2016/17 198.3 204.4 6.1 441 424.5 -16.5 301.3 289.2 -12.1
similar margin, the budget deficit will rise by the projected 2017/18f 218.7 482 312.7
shortfall. The FYTD budget deficit is currently R27 billion larger than 2018/19f 233 527.9 337.7
the same period last year and R30 billion larger than the average deficit
2019/20f 251.7 581.9 364.7
f=2017 Budget Revi ew foreca s t Source: Na ti ona l Trea s ury
in the last five years. That alone translates into a wider budget deficit
(as a % of GDP) of 57bps. Revenue collection is well below the run rate
achieved in the last fiscal year, weighed by slower PIT and CIT MTBPS Scenarios Worst-case Baseline Optimistic
collection. VAT collection, by contrast, is marginally ahead of the Economic Outlook
2016/17 run rate but is still growing below the forecasted 8.1% rate.
GDP growth 2017/18 0.4 0.8 1.3
While VAT is expected to underwhelm expectations over the medium-
term (unless we see a VAT rate hike), the blow may be cushioned by
GDP Growth 2018/19 1 1.6 2
the fact that households would have received a windfall in the form of GDP growth 2019/20 1.1 1.9 2.2
looser monetary policy and lower prices this year. We expect much of
the estimated revenue shortfall of between R20 to R44 billion will 2017/18:
probably emanate from the largest revenue streams – the PIT and Debt metrics (gross)
VAT categories.
Debt/GDP 2017/18 53.2 52.8 52.3
Given the latest GDP data from Stats SA, real GDP growth in 2016/17
Shortfall R bn:
would likely be revised to 0.6% compared to the initial expectation of
1.2% and the revised estimate in the February budget of 1%. This would
Gross tax revenue 53 44 20
?
imply that last year, a 60bps miss in the growth forecast yielded a R31 PIT 18 15.3 5
billion miss in revenue collection – this was mainly due to lower CIT 8 6.7 4
personal income taxes and VAT collection. The smallest GDP miss VAT 17.7 13.6 7
since 2009 (barring 2011/12) yielded the largest revenue shortfall since
Other: Trade 9 8 4
2009, in a year characterised by a recession. We anticipate a 50bps
miss in the 2017/18 growth forecast, which may result in a lower-
Main Budget Deficit (%
than-projected 6.3% nominal GDP growth rate and a R44 billion of GDP) -4.30% -4.00% -3.50%
revenue shortfall.
Source: National Treasury, Nedbank CIB calculations
6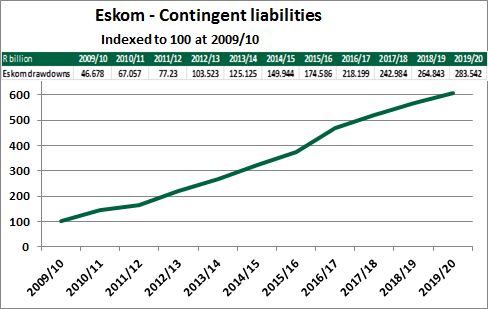
REVENUE
V-SHAPED RECOVERY IN REVENUE GROWTH UNLIKELY
Source: National Treasury, Nedbank CIB calculations
VAT and CIT collection had been the biggest underperformers in the last five years. Job losses and an investment recession typically feature during the lows of the business cycle, which
means PIT, CIT and VAT will likely underperform relative to forecasts. If we project a (conservative) R30 billion shortfall in gross revenue collection this year, nominal tax revenue growth
falls to 8% and tax buoyancy will be marginally lower at 1.3. Stepping up the revenue disappointment to R60 billion yields a buoyancy of 0.85, however we believe that there is a small
chance of such a significant slippage actually materialising. Nonetheless, the V-shaped recovery in revenue growth projections by NT is unlikely to materialise given lower gross
earnings, higher unemployment, subdued growth, subdued corporate profits, and a still fragile household sector.
The MTBPS will likely guard against significant fiscal slippage by (hopefully) reducing expenditure on non-core goods and services (more on this later). However, we believe that political
pressure to prioritise radical policies will mount, hence we may see an allocation to these in the February 2018 budget speech even though Pravin Gordhan said in February 2017 “Over
the long term, unless South Africa returns to a path of rising per capita incomes, it is doubtful that sufficient resources will be available to fund all the policy objectives set out in the NDP. In
such a scenario, government would have to adjust its agenda, and determine which policies to implement, downsize or delay.” Therefore, should radical economic policies take
precedence over (or detract from) growth and revenue-generating policies, SA could be setting itself up for failure as the ability to service burgeoning debt levels will be
eroded.
What must be noted is that no real revenue-raising changes occur in the middle of a fiscal year. This means that unless we see improved confidence levels, we are unlikely to achieve
revenue targets that we feel have in themselves been overly optimistic to start off with. Hence a revenue undershoot looks like a foregone conclusion. The key question now is the
magnitude of the disappointment. The Finance Minister will need to reduce revenue projections at the MTBPS, and if this is not countered with expenditure cuts, then the budget
deficit forecast will also rise along with debt issuance.
Source: National Treasury, Nedbank CIB calculations
7HOW BUOYANT IS THE TAX BUOYANCY RATE?
LOWER GROSS EARNINGS COULD HAMPER TAX REVENUES
Tax buoyancy was sharply lower in 2016/17 – compared to an initial projection of 1.2,
NT reported that buoyancy fell to 0.88 in the last fiscal year (down from 1.47 in
2015/16). This will be revised higher if our expectation of a lower nominal GDP growth
rate materialises. This means that for every 1% of nominal GDP growth, tax growth
was 0.88% (7.9% nominal GDP growth vs 6.9% tax revenue growth). This was due to
lower wage settlements, subdued household consumption, the appreciation of
the rand exchange rate, and falling imports. Even though tax buoyancy is
expected to rise to 1.1 in 2019/20, we believe that there is a high and rising risk
of disappointment. Bear in mind that the long run average buoyancy ratio is close to
1.09. Also note that if the GDP forecasts are lowered without a subsequent downward
revision to revenue estimates (highly unlikely as both go hand in hand), the buoyancy
rate would rise.
According to Stats SA QLFS there were 48,000 fewer people employed in the formal
non-agricultural sector in 1Q17 compared to 4Q16. Similarly, gross earnings declined
from R607.3 billion in 4Q16, to R587.9 billion in 1Q17 – this was the first time since
2009 that gross earnings had contracted. Inevitably, this means lower tax revenue if
this trend were to persist into 2017/18.
Source: Datastream, Nedbank CIB calculations
Source: National Treasury, Nedbank CIB calculations
8EXPENDITURE AND DEBT
JULY 2017 DEFICIT WAS THE BIGGEST ON RECORD DUE TO RUNAWAY EXPENDITURES
South Africa has seen austere budgets passed in the last few years. These were passed to narrow the burgeoning debt levels. Has this worked? The simple answer is no, because
both the gross and net debt to GDP levels have risen instead. In 2014 and 2015, the NT projected a peak in the gross debt to GDP in 2017/18. However, in the 2016 MTBPS and the
February 2017 budget (when an additional forecast year was added), this peak has now moved to 2018/19 – again kicking the can down the road. At the MTBPS in October, NT will
again add another forecast year (2020/21) and may project a higher debt to GDP ratio because of the lower GDP expected and the underwhelming revenue collection (which may
necessitate greater debt accumulation). As then Finance Minister Pravin Gordhan accepted quite candidly in the February Budget speech “Owing to revenue under collection
and declining tax buoyancy, government will have to borrow more”.
The reasons for the fiscal slippage varies – in the last fiscal year, the NT reported a R30bn shortfall in projected revenues, which emanated mainly from lower imports, VAT and PIT
collection. In the previous year, the actual contingency reserve had to be used to fund the freeze in tertiary education fee increases.
Expenditure growth for 2017/18 was forecast at 7.8% fyoy in February. Total FYTD expenditures have surged by 8.4% yoy in the current FYTD. The July expenditures were up almost
14% yoy and 34% mom. This means that revenue collection is slipping further away from the 2016/17 run rate of 28.7% (currently 26.9%), while expenditures have now overtaken the
prior year’s run rate of 32.8% (currently 32.9%). The surge in expenditures was being incurred by the Cooperative Governance and Traditional Affairs department (Minister Des Van
Rooyen) – this was the single-biggest expenditure item in July. Until now, we have been optimistic about expenditure growth remaining palatable. The July print erodes all of the
previous ‘belt-tightening’. There is also the possibility of increased SOE bail-outs being required and the upcoming public sector salary negotiations which may necessitate a higher
eventual spend.
Given the sharp deviation from the monthly (and cumulative) deficit trend in July, we calculated the average monthly budget balances over the last five fiscal years and projected a
cumulative budget balance trend until this fiscal year-end using these average monthly balances. Note that in the current year’s data thus far, average surplus months yielded below-
average surpluses, while deficit months yielded wider deficits (to project the red line however, we assumed deficits and surpluses in line with the seasonal averages). This shows the
possible extent of slippage if revenue collection disappoints and if there are no expenditure reductions this year.
Source: National Treasury, Nedbank CIB
calculations
9DEBT SUSTAINABILITY
CONSOLIDATED REVENUE GROWTH UNABLE TO KEEP UP WITH BALLOONING DEBT LEVELS
In the last fiscal year, consolidated revenues actually declined in real terms (-0.11% revenue, +4.2% expenditures) while real gross debt growth was 4.6% and net loan debt rose 4.9%.
The slippage is expected to persist. According to estimates from the February budget, real growth of gross and net debt is expected at 5.2% and 5.5% respectively this year, while real
revenue and expenditure growth is forecast at 3.5% and 2.7% respectively. This assumes that revenue and expenditure targets are met, and debt accumulation is in line with the
February forecast. This is unlikely to occur
As discussed above, we expect some fiscal slippage in nominal terms, which will likely result in higher real debt and expenditure growth, and lower real revenue growth. Whether
measured in nominal or real terms, it means that sluggish revenue growth is unable to even offset consolidated expenditure growth, much less service ballooning debt
levels. Debt levels are therefore highly unsustainable because the growth in debt service costs far exceeds revenue growth, ie revenue is not rising fast enough to keep up with debt
repayments.
The government’s gross debt to GDP ratio is expected to rise to 52.4% in the next two fiscal years, after the forecasted 50.7% in the last fiscal year. The IMF, however, boasts a less-
optimistic outlook of government debt, with a forecast of the debt/GDP ratio of 56% by 2019/20 and 71% by 2022 if growth remains permanently below 1%. The cost of debt will likely
increase sharply in coming years. This is especially true if the political risk premium does not abate and serves to indicate that political developments will have a direct bearing on long
term debt sustainability.
R bn 2015/16a 2016/17e Nominal 2017/18f Nominal
fyoy % fyoy %
49 Net debt to GDP forecasts - evolution
chg chg 2012 Budget
10.84 10.72 47
Gross debt 2019 2238 2478 2012 MTBPS
Net debt 1805 2006 11.14 2226 10.97 2013 Budget
45
13.58 11.00 2013 MTBPS
Debt-service costs 128.8 146.3 162.4
6.14 9.02 2014 Budget
Consolidated Revenue 1222 1297 1414 43
2014 MTBPS
%
Consolidated Expenditure 1308 1445 10.47 1563 8.17
41 2015 Budget
Average CPI (Nedbank) 5.2% 6.25% 5.5%
2015 MTBPS
a = actual 39 2016 Budget
e = NT estimate
f = NT forecast Source: National Treasury, Nedbank CIB 2016 MTBPS
Source: Nedbank, National Treasury, Bloomberg 37
2017 Budget
Actual
35
2012/13 2013/14 2014/15 2015/16 2016/17 2017/18 2018/19 2019/20
10THE POLITICS OF FISCAL CONSOLIDATION
AS WE NEAR NATIONAL ELECTIONS, FISCAL CONSOLIDATION WILL PROVE INCREASINGLY DIFFICULT
NT has greater flexibility over expenditures rather than revenues. However, expenditure reductions tend to be politically unfavourable and will hamper economic activity (if cash is ejected
from growth-enhancing activities). Moody’s believes that fiscal consolidation will not be prioritised and that there will be continued erosion of fiscal strength due to rising public debt and
contingent liabilities. We are forced to concur, given the evidence of fiscal slippage in the last fiscal year and the lack of any growth- or confidence-enhancing policy reform this year. This,
combined with the bail-out of SAA recently, points to the possibility of further fiscal slippage among SOEs, which may warrant further bail-outs. This means that state resources are being
allocated to ‘cash cows’ (loss-making state enterprises).
For fiscal consolidation to work in its entirety, we believe that a country needs complete political commitment in order to propel austerity. This means that the Finance Minister requires full
support from the Cabinet and the NEC, including President Jacob Zuma. We believe that this has not been the case since the start of fiscal consolidation. We believe that fiscal
consolidation has, at best, taken a piece-meal approach in the last four years which has seen SA’s gross debt to GDP rise from 43.7% in 2013/14 to the projected 52.9% by
2018/19 and revenue under-collection of (a cumulative) R60 billion in the same period. Furthermore, Moody’s recently stated in its August credit opinion, “Low growth and financially
challenging state-owned enterprises increase the risk of fiscal deterioration. Public debt and total contingent liabilities have doubled in terms of GDP since 2008/09, exceeding 50% and
20% of GDP at the end of 2016, respectively. Cost of borrowing has risen, with South Africa's interest payments relative to revenues now marginally exceeding the median of Baa-rated
peers.”
The expenditure ceiling
The current path of fiscal consolidation is highly dependent on the expenditure target
being met. The expenditure ceiling policy was implemented in 2012 and was premised on
54 Gross debt to GDP forecasts - evolution
2012 Budget
a growth forecast of 3.5%. Hence only a 3.5% potential growth rate (or a close-enough
52 2012 MTBPS
growth rate) would sustain the expenditure ceiling. When the expenditure ceiling was
adopted, the growth projection was between 3% and 4.25%. However growth has failed 2013 Budget
50
miserably on that front, as actual growth of between 1.75% and 2.25% was achieved. 2013 MTBPS
South Africa is currently in a recessionary environment in which even our long-term 2014 Budget
48
potential growth rate has been revised to well below that level (1.1-1.3% according to the 2014 MTBPS
%
SARB). This may mean that the expenditure ceiling is unrealistic or unobtainable, unless 2015 Budget
46
we see significant expenditure cuts (which are politically unfavourable, particularly as we
2015 MTBPS
near an election in 2019). Also, significant expenditure cuts tend to reinforce lower
44 2016 Budget
growth. This is why we believe that Minister Malusi Gigaba, is tasked with the most Source: National Treasury, Nedbank CIB
difficult budget yet in recent times – with the expenditure ceiling needing to be 2016 MTBPS
42
calibrated on a lower potential growth rate, it could mean the end to the Treasury’s 2017 Budget
commitment to fiscal consolidation which would likely yield a downgrade (and a Actual
40
shock to already-low confidence levels). 2012/13 2013/14 2014/15 2015/16 2016/17 2017/18 2018/19 2019/20
In its recent Article 5 report, the IMF indicated that “Indeed, staff’s assessment is that
fiscal space is limited, consistent with the rising debt, sizable contingent liabilities, the
relatively high cost of government borrowing, and significant uncertainties regarding the
future path of economic growth and interest rates (see below). Abiding by the approved
budget ceilings is necessary to preserve investor confidence.”
11CONTINGENT LIABILITIES
THE THREAT OF ‘TOO BIG TO FAIL’ SOE’S
Eskom, IPPs and the RAF make up the majority of government’s contingent liabilities. In the 2016/17 fiscal year,
Eskom had the single biggest exposure to (and guarantee by) the government. Guarantees to Eskom amounted to
R350 billion, or 73% of total SOE guarantees (and 8% of GDP). Of this, Eskom has drawn down on R218 billion, or
70% of all SOE draw downs. The guarantee amount granted to Eskom has been extended to March 2023, from
March 2017. This will be used to complete Eskom’s capital expenditure programme by 2023. The NT expects Eskom
to draw down R22 billion a year over the medium-term. This is the reason why it has become paramount that the
government take steps in resolving the governance issues and financial problems of Eskom, because it has
become essentially ‘too big to fail’ for the government and for the economy. The February budget noted that
guarantees to some state-owned companies remain a major risk to the fiscus. However, this assumes that Eskom
will have unfettered access to the local capital markets with a guarantee wrap. However the opposite has transpired
and investor activism against maladministration at Eskom has summarily curtailed liquidity support for Eskom’s local
fundraising. This increases the likelihood of direct budgetary support or a turn to the international debt/loan markets,
where a sovereign guarantee is less constructive if not impossible to issue under the PFMA (outside of bilateral loan
financing).
While SAA remains one of the smallest exposures amongst the SOEs (4%), the recent bail-out stands out like a sore Return on equity of SOEs and government
thumb for its intent rather than its destabilising threat. SAA has already exhausted the R19.1 billion drawdown made bond yield
10
available by NT. Bear in mind that this facility was increased from R14.4 billion in 2015. Nonetheless, the airline is
still loss-making and technically insolvent and hence requires further bail-outs by the government (the cash cow
mentioned earlier) – this will likely persist until the airline’s financial problems are resolved or until the NT decides
that it will turn the taps off on SAA. The NT provided R2.2 billion in an emergency bail-out in June. This may be 5
expelled from the R6 billion contingency reserve in the MTBPS. The SAA bail-out may signal to other SOEs in
%
financial difficulty that the government remains tolerant of bail-outs without any reform terms attached to them. This
may be the start of a series of bail-outs if no SOE reform is implemented and if Treasury does not take a hard 0
enough stance against failing SOEs. 2012 2013 2014 2015 2016 2017
However the key question for now is where NT will source a further R10 billion required by SAA to avert further
defaults. The NT has previously stated that any support for SOEs will be made in a deficit-neutral manner. There has
-5
been conjecture that non-core assets of the state and non-core assets of SOEs may be sold off to provide for the Return on equity of SOEs
bail-out of SAA. This is based on the previous experience of Eskom in 2015, in which the NT sold its R28.7 billion South African government bond (R186)
stake in Vodacom Group Ltd to provide funds to Eskom. Minister Gigaba will provide further detail on these plans in
the MTBPS. There are a few possibilities and we have rounded them down to three: We believe that the non-core
assets (re: Telkom or a portion thereof may indeed be disposed off to free up cash for SAA, and that there may likely Source: National Treasury, Nedbank CIB
be drawdowns in the contingency reserves. In an extreme case, the expenditure ceiling may be raised, however this
would signal the end of NT’s commitment to fiscal consolidation and would almost immediately earn us a credit rating See Jones Gondo’s Monthly DCM review of 1 August 2017 for
downgrade. NT also has the option of “directed lending or equity injections” from other state-owned financial more detail on SOEs
https://www.nedbank.co.za/content/dam/nedbank-
institutions. Ultimately – we do not think NT has enough time to execute an asset disposal to the general market, but
crp/reports/Credit/DCM_Credit_Review_170801.pdf
we know their general approach is typically to turn to the PIC, and others, to take out their stake and minimize the
12
execution risk.GOVERNMENT FINANCING AND ISSUANCE
STEEPER YIELD CURVE ADDS TO TREASURY’S COST OF FUNDING
In February, NT forecasted a R220 billion gross borrowing requirement and R149 billion net borrowing requirement
(including foreign loans and change in cash and other balances) for the current fiscal year. The NT’s issuance profile
has lengthened – the average maturity of all government bonds in issue is currently around 15.5 years, from a low of
7.8 years before the financial crisis. The financing strategy is focused on mitigating risks arising from an
increase in redemptions over the medium-term. For this reason, NT has engaged in switch auctions. It seems
like National Treasury can breathe a little easier following three successful switch auctions totalling R39.4 billion this
year (203/204/207/208), with R41.8 billion worth of back-end bonds purchased. While on the surface of it this may
look to reduce the NT’s projected R162.4 billion debt service cost for 2017/18, bear in mind that NT has already
exceeded its R21 billion estimated short-term debt issuance for this year and (four months into the current fiscal year)
has already issued 43% of its projected long term issuance of R142 billion. However, this is still below the 1H2016/17
issuance of 53%, and may mean that debt issuance is stepped up in the latter part of the fiscal year. Given that some
fiscal slippage is expected, this may necessitate greater issuance.
Throwing another ‘spanner in the works’ are the implications of the cabinet reshuffle and on-going political noise.
Even though the 10-year bond yield has reached pre-Nene-Gate levels, the yield curve has steepened sharply – long-
end yields have risen while short-end yields have compressed. The curve from 186s out to 2048s (30v10) has
steepened by 55bps for the YTD, while the R203 against the R2048 has gone from 170bps to 897bps. The R204
Source: SARB, Nedbank CIB
against the R2048 has steepened by 113bps for the YTD. This means that NT is paying at least 55bps more for
its issuance of long-dated bonds compared to eight months ago.
Given recent credit rating downgrades, the indicative cost of issuance has risen. This can be seen in the NT’s interest
costs which are already R9 billion higher than the comparative period in the last fiscal year (and expected to rise by at
least a further R6 billion to total R162.4 billion this year). This means that, in essence, the government is issuing
more debt every year only to service existing debt in issue (accumulating more debt to pay annual interest
expense). This is an unsustainable debt spiral.
Source: Bloomberg
13 Source: BMI ResearchGOVERNMENT FINANCING AND ISSUANCE
LARGE FOREIGN HOLDINGS OF DOMESTIC DEBT IS A KEY CONCERN
Higher yields on SAGBs would inevitably mean higher
borrowing costs for the government. Given the fairly high
levels of foreign participation in the local bond market (at
48.8% of fixed-rate bonds as at June 2017), SA’s
vulnerability to global and emerging market risk sentiment
cannot be ignored. Any turn in foreign sentiment would yield
large outflows from the bond market, and consequently
higher yields.
Source: National Treasury,
Nedbank CIB NT is rolling over its near-term maturity risk out to between
2026 and 2048 by engaging in switch auctions. This should
result in a sharp increase in debt service costs in the outer
years. Oddly enough, this stands in stark contrast to what
Gordhan indicated in February, “By acting now to stabilise
debt, government is ensuring that future generations will not
be paying taxes for today’s expenses 20 or 30 years from
now.” The increase in debt stock, the issuance of
longer-dated bonds that attract higher interest
payments, and the exchange of short- for longer-dated
instruments, should put further upward pressure on
debt-service costs.
Source: Bloomberg, Nedbank CIB
Source: National Treasury,
14 Nedbank CIBCREDIT RATINGS IMPLICATIONS
FURTHER DOWNGRADES BY 1H18 LIKELY
Debt service costs are the fastest-growing expenditure subcomponent and consume 13 cents of every rand of government revenue. This represents a key rating flag as this measure is
used by Standard & Poor’s in its fiscal assessments (along with debt/GDP). Interest expenditures have roughly averaged 12% of total revenues over the past five years. This is
expected to deteriorate to 12.9% of revenues over the next two fiscal years. 15% represents the upside cap for the current fiscal assessment score by Standard & Poor’s for SA (which
is already assessed as ‘weak’). Deterioration in this ratio would further weaken the fiscal assessment over the medium-term.
Moody’s has already expressed concern over this metric in its August credit opinion, “Cost of borrowing has risen, with South Africa's interest payments relative to revenues now
marginally exceeding the median of Baa-rated peers”. Moody’s notes that more than a third of all sovereign defaults occurred as a result of persistent fiscal imbalances which built
up unsustainably high debt burdens and a deterioration in debt affordability. Consequently, countries were not able to service the debt or reduce the debt, which earned them
downgrades. This is the same scenario SA finds itself in, in that we are unable to reduce ballooning debt levels and we have to keep up with debt issuance just to continue
servicing outstanding debt.
Stacked against its peers, SA’s twin balance (budget balance plus current account balance) is amongst the worst performers, and is forecast (by the IMF) to fall to the second-worst
performing EM country by 2022 (after India). If this projection of fiscal slippage does in fact materialise, the probability of further credit rating downgrades would rise rapidly.
Overall, a downgrade and exclusion from the WGBI seems as though it is a foregone conclusion in the market. However, global conditions have changed enough that we
may be cushioned from any blow from a downgrade in the near-term. In our opinion, the concern thereafter is the domestic problems which should start surfacing when
liquidity starts to dry up as global monetary policy tightening accelerates.
25
EM Twin balances
Fiscal balance (% of GDP) + Current account balance (% of GDP)
20
IMF Forecasts start from 2016
15
Brazil
10 China
Source: IMF, Nedbank CIB
Colombia
5 Hungary
% of GDP
India
0 Indonesia
Mexico
Russia
-5
South Africa
Turkey
-10
-15
-20
2000 2001 2002 2003 2004 2005 2006 2007 2008 2009 2010 2011 2012 2013 2014 2015 2016 2017 2018 2019 2020 2021 2022
15POSSIBLE MEASURES TO ARREST THE FREE-FALL OF THE FISCUS
W HILE THE NT WALKS A TIGHTROPE AT THIS MTBPS, IT IS LIKELY TO SET OUT SOME MEASURES BEING CONSIDERED FOR THE 2018 BUDGET
On the revenue side:
Signal higher taxes and no bracket creep again (R17 billion raised in 2017/18)
Indirect/sin taxes (R2 billion)
14% VAT on fuel (R18.2 billion a year estimated collection by NT) or
1% rise in the VAT rate (yields R15 billion in additional revenue)
Health promotion levy (including sugar tax; at least R135 million according to NT)
Reduce contingency reserve – currently at R6 billion, R10 billion and R20 billion over the next three fiscal years
(may be lowered by a cumulative R11 billion)
Removal of the medical aid tax credit (R20 billion)
On the expenditure side:
Value-added tax rate
Further expenditure ceiling reductions as announced in February (R26 billion) 30.0 SA has room to manoeuvre VAT
Deferral of the NHI fund implementation
Reduction of unauthorised, irregular, fruitless and wasteful expenditure (R46 billion in the last fiscal year 25.0
according to the Auditor General)
Procurement reforms (R30 billion if all government contracts are reviewed – Gigaba)
20.0
Tackling corruption (R27 billion according to Minister Ebrahim Patel)
Reduction of the public sector wage bill (R1.5 billion)
SOE reform (R3 billion)
15.0
Rescinded provisional allocations (R11.5 billion)
Conditional grant reductions (R2 billion) 10.0
We believe Minister Gigaba and the Treasury team will be walking a tightrope in trying to maintain the 5.0
promises of narrowing the deficit such that a primary budget surplus is achieved in 2018/19 (here again
this was pushed out from 2016/17). We think that the pressure of ensuring limited fiscal slippage is
greater than the pressure of ensuring fiscal consolidation at this stage. This is because there is a greater
–
Ghana
Russia
Turkey
Rwanda
Kenya
Chile
Spain
Canada
Brazil
China
Australia
South Africa
Sweden
UK
Germany
likelihood of a further deterioration (wider deficit) than an improvement in the fiscal metrics in the
current environment in our opinion.
Source: National Treasury, Nedbank CIB
16THANK YOU
Disclaimer
The information furnished in this publication, which information may include opinions, estimates, indicative rates, terms, price quotations and projections, reflects the judgment of the author(s) and the prevailing market conditions
as at the date of this report, which judgment and conditions are subject to change without notice, modification or amendment. This publication does not necessarily reflect the opinion of Nedbank Limited (“Nedbank”) or its ultimate
holding companies or any direct or indirect subsidiary undertakings of such holding companies (its “Affiliates”). Information presented in this publication was obtained or derived from public sources that Nedbank believes are
reliable but no representation or warranty, express or implied, is made as to its accuracy or completeness. Neither Nedbank nor its Affiliates (or their respective directors, employees, representatives and agents) accepts any
responsibility or liability (whether in delict, contract or otherwise) for loss arising from the use of or reliance placed upon the material presented in this publication, except that this exclusion of liability does not apply to the extent
that liability arises under specific statutes or regulations applicable to Nedbank or its Affiliates.
This publication has been forwarded to you solely for information purposes only. The information contained in this publication is confidential and is not intended to be, nor should it be construed as, "advice" as contemplated in the
South African Financial Advisory and Intermediary Services Act, 2002 (as amended) or otherwise, or a direct or indirect invitation or inducement to any person to engage in investment activity relating to any securities or any
derivative instrument or any other rights pertaining thereto of any company mentioned herein.
Any prices or levels contained herein are preliminary and indicative only and do not represent bids or offers. These indications are provided solely for your information and consideration. The information contained in this publication
may include results of analyses from a quantitative model which represent potential future events that may or may not be realized, and is not a complete analysis of every material fact representing any product.
You should seek independent advice (including tax, accounting, legal, regulatory and financial advice) in relation to the information contained herein. This publication is intended for use by professional investors only. It may not be
considered as advice, a recommendation or an offer to enter into or conclude any transactions. The information contained in this publication is confidential and is not intended to be, nor should it be construed as, a direct or indirect
invitation or inducement to any person to engage in investment activity relating to any securities or any derivative instrument or any other rights pertaining thereto (“financial instruments”). Any additional information relative to any
financial instruments and/or financial products reviewed in this publication is available upon request.
This publication has been issued in the United Kingdom only to persons of a kind described in Article 19 (5), 38, 47 and 49 of the Financial Services and Markets Act 2000 (Financial Promotion) Order 2005 (all such persons being
referred to as “relevant persons”). Any investment or investment activity to which this document relates is only available to relevant persons and will be engaged in only with relevant persons.
Directors, officers and/or employees of Nedbank or its Affiliates may at any time, to the extent permitted by law, own or have a position in the financial instruments of any company or related company referred to herein, and may
add to or dispose of any such position or act as a principal in any transaction in such financial instruments. Nedbank and/or its Affiliates may make a market in these instruments for its customers and for its own account. Accordingly,
Nedbank and/or its Affiliates may have a position in any such instrument at any time. Directors, employees or officers of Nedbank and/or its Affiliates may also be directors of companies mentioned in this publication. Nedbank
and/or its Affiliates may from time to time provide or solicit investment banking, underwriting or other financial services to, for or from any company referred to herein. Nedbank and/or its Affiliates may to the extent permitted by
law, act upon or use information or opinions presented herein, or research or analysis on which they are based prior to the material being published.
The distribution of this document in certain jurisdictions may be prohibited or restricted by rules, regulations and/or laws of such jurisdictions and persons into whose possessions this presentation comes should inform themselves
about, and observe, any such restrictions. Any failure to comply with such prohibitions or restrictions may constitute a violation of the laws of such other jurisdictions.
Internet communications are not guaranteed to be secure or virus-free. Nedbank and its Affiliates do not accept responsibility for any loss arising from unauthorised access to, or interference with any internet communications by any
third party.
All trademarks, service marks and logos used in this publication are trademarks or service marks or registered trademarks or service marks of Nedbank or its Affiliates
17You can also read