Meeting Auckland's Growth Challenge: The Innovation City - Discussion Document - Infrastructure New ...
←
→
Page content transcription
If your browser does not render page correctly, please read the page content below

Meeting Auckland’s
Growth Challenge:
The Innovation City
Discussion Document

 OCTOBER 2017
Contents
Executive Summary                                            2
Auckland’s Growth Challenge                                  6
A New Approach: Integrated Urban Development at Scale        8
Costing a Satellite: Infrastructure                         14
Land Values                                                 30
Paerata City: Employment and Construction                   36
Funding Tools                                               44
Delivering Paerata City                                     52
The Innovation City                                         60
Appendix 1: Assumptions Used to Inform Transport Networks   62
Executive
Summary
                                                                       The Approach
                                                                       We test the costs and feasibility of delivering an additional 30,000
                                                                       homes and jobs, over and above current plans, built around rapid
                                                                       transit on undeveloped land. Homes closer to jobs will reduce
                                                                       regional travel. Transit oriented development will facilitate access
                                                                       to high capacity services. Raw land provides the opportunity to
                                                                       capture value to fund public infrastructure and build quickly.

Auckland is confronted with a                                          We examine five locations around Auckland with sufficient land
three-sided growth challenge.                                          to support a city of 100,000 residents. We compare the costs of
                                                                       servicing these areas with infrastructure and examine whether
There are not enough homes, there                                      housing can be delivered affordably.
is growing traffic congestion and
                                                                       We find Dairy Flat-Silverdale to be the most expensive location
solving either problem is becoming                                     to grow. High land costs, water challenges and the prospect of

increasingly unaffordable.                                             extremely expensive transport upgrades suggest this area is not
                                                                       capable of accommodating planned growth, let alone an additional
                                                                       city. Growth and investment in the north should be deprioritised.
Rapid population growth is exacerbating pressures, but it is not the
root cause of Auckland’s growth challenge.                             Kumeu south is more suitable. Recent motorway investments can
                                                                       support more growth, but public transport is inadequate. The
The allocations of housing and employment growth in the Unitary        new busway will be under immense pressure by the 2040s. A rail
Plan are misaligned with Auckland’s infrastructure services. The       upgrade is expensive and will not provide sufficient speed and
Independent Panel on the Unitary Plan assumed infrastructure           convenience. High and rising land prices reduce the capacity for
could be provided to meet growth. Transport modelling shows            value capture.
that it cannot. Growth is everywhere and nowhere and lumpy
infrastructure investment cannot keep up.                              In unzoned Clevedon, land is cheap, but the area is off the
                                                                       infrastructure radar. High and uncertain transport costs and
This discussion document proposes a different approach.                stormwater and flooding susceptibility discount the Clevedon
                                                                       valley.

                                                                                                                            infrastructure.org.nz
   2
Growth Should be
Targeted in the South
The south represents Auckland’s                   When development contributions are              Land can be accessed at its raw value
opportunity to grow the city affordably and       added to a conventional development             and used to deliver affordable growth for
efficiently.                                      today, the cost of servicing raw land rises     homeowners and infrastructure providers.
                                                  above $100,000 per dwelling. This is not        Integrated urban development at scale
Land around the rail line through Paerata         only high and likely impacting housing          combined with emerging legislation will
is the most cost-effective location to add        supply, it does not reflect the large           enable an Urban Development Agency to
30,000 homes. Karaka is competitive at            variations in the cost of servicing different   buy land, collaborate with land owners and
higher levels. Paerata is up to $150 million      greenfield locations.                           realise land value.
cheaper to service with water, fibre and
energy infrastructure than other greenfield       Paerata’s land is still cheap, but rising       Building at scale will facilitate a much-
locations. On a per dwelling basis, this cost     quickly. If bought at today’s prices, an        needed shift to prefabricated housing.
is relatively minor (around $22,000), but         average section of raw land would cost          Prefab is faster and cheaper than
at the regional level has a major impact on       $17,000. Three years ago, it cost $10,000.      conventional building and requires less
infrastructure providers.                         Land in Dairy Flat is over twice the price,     skilled labour. Procuring housing in large
                                                  rising faster and sections are smaller          tranches will give the supply industry the
Paerata’s proximity to rail and SH1 lowers        so land aggregation more difficult. If          confidence to invest in factory production
the substantial risks and uncertainties           authorities can move before the market in       of housing.
around future transport needs. We estimate        Paerata, land value can be captured and
regional road and water investment as             used to offset infrastructure costs.            Assuming a shift to prefab and access
low as $700 million could be sufficient to                                                        to raw land, the average cost to deliver a
add 30,000 dwellings to current Paerata           If authorities pursue a conventional            completed home in the satellite, including
plans. This is less than the estimated $1         approach, unserviced sections valued            land, development, infrastructure and
billion of development contributions the          at less than $20,000 today could be             dwelling construction would be $450,000
city would generate. All other locations we       expected to rise to over $360,000 post-         (including a 15 per cent allowance for GST).
examine would likely cost more to service         development. Property owners would              This is the risk free cost of delivering a
than the Auckland Council would receive           have to invest $100,000 in residential          home in Paerata city.
in funding. Growth can pay for itself, if it is   development to realise this gain, leaving an
well planned.                                     almost $250,000 difference between the          Median home prices in Auckland today are
                                                  total cost of development and the resale        $825,000. After providing a margin for risk,
The cost of local infrastructure and              value of a section. Over a development of       the wide apparent difference between the
development for the satellite is greater.         30,000 homes, it translates to $7 billion of    cost of delivering a home in Paerata and
Almost $3 billion would be required to            increased value.                                current prices suggests integrated urban
cover fees and to service Paerata city with                                                       development at scale is cost effective.
local roads, parks and water services. This       Part of this figure represents the cost
is twice the estimated cost of all regional       of risk and reflects successful urban
infrastructure and adds $77,000 on average        development. Part of it reflects public
to every dwelling.                                activities across zoning and infrastructure
                                                  which are undervalued by a flawed
                                                  approach to growth management.

MEETING AUCKLAND’S GROWTH CHALLENGE:
THE INNOVATION CITY
OCTOBER 2017                                                                                                                                  3
A New Approach to
                                                Growth in Auckland
In addition to enabling land value to be        The southern rail line between Pukekohe         Auckland must start using growth
captured, development in Paerata offers a       and the Auckland CBD needs investment.          to catalyse the investments the city
number of strategic advantages. It is close     Strategic prioritisation of Paerata as a        wants, not letting growth determine the
to industrial land at Drury and proximate to    growth city would generate sufficient land      investments it has to make.
key employment centres at Manukau and           value uplift to fund a $2 billion duplication
Auckland airport, as well as the productive     of the North Island Main Trunk Line.            Central government must play its part.
Waikato and Bay of Plenty growth regions.                                                       Disproportionately high risk in relation
Water, power and aggregate supplies come        Four rail lines between Papakura and            to reward sits with the Auckland Council
from the south and, most importantly,           Westfield, including grade separation           and developers, while too little remains
Paerata is located on the railway line. Scale   from general traffic, would allow non-stop      with central government and the original
development in this location provides           services from Paerata to the CBD. Rail          land owners. A satellite city at Paerata will
a unique opportunity to leverage the            freight services could be separated from        return $3-4 billion in GST alone, but less
capacity of rail as the alternative transport   commuter services, removing constraints         than $100 million in rates.
mode for Auckland.                              on KiwiRail activities. Traffic congestion
                                                and risk taking at level crossings would        Planning for growth at scale around rapid
Paerata’s strategic location and Auckland’s     reduce. Tens of thousands of homes would        transit allows more efficient use of land
urgent need for affordable housing close        be within 30 minutes of central Auckland.       and is cheaper than retrofitting established
to employment indicates there is an                                                             urban areas. It will deliver benefits in the
opportunity to go further.                      Growth could be extended north into             form of more affordable housing for the
                                                Karaka to combine with a strategic link         people who live in Paerata and in the form
                                                across the Pahurehure inlet. The new            of lower congestion and infrastructure
                                                corridor would duplicate SH1 and provide        charges for wider residents.
                                                direct access to SH20, the airport and
                                                Manukau. Light rail from the airport could      But it is the ability to identify and isolate
                                                connect with rail at Paerata, providing         land at its raw price which provides the
                                                competitive rapid transit options to            greatest opportunity. Auckland’s existing
                                                major employment centres at the airport,        growth paradigm transfers the value of
                                                Manukau, Mt Wellington, Penrose,                public investment to land values without
                                                Newmarket and the city.                         a concomitant requirement to deliver
                                                                                                housing at pace. More infrastructure
                                                Integrated development could                    investment is required to deliver fewer
                                                accommodate a new city to the south of not      houses and weak supply reinforces high
                                                just one hundred thousand residents but         prices.
                                                four or five hundred thousand residents.
                                                                                                The integrated planning and infrastructure
                                                Wholesale changes to the Unitary Plan are       approach of the satellite model enables
                                                not required. The Rural Urban Boundary          infrastructure providers to share the
                                                has provision for local expansion to            benefit they create. Investment can be
                                                make way for growth. Coordinated                funded and affordable homes can be
                                                public investment aligned with planning         delivered.
                                                processes and combined with affordable
                                                housing can shape urban form, without
                                                dictating it.

                                                                                                                               infrastructure.org.nz
   4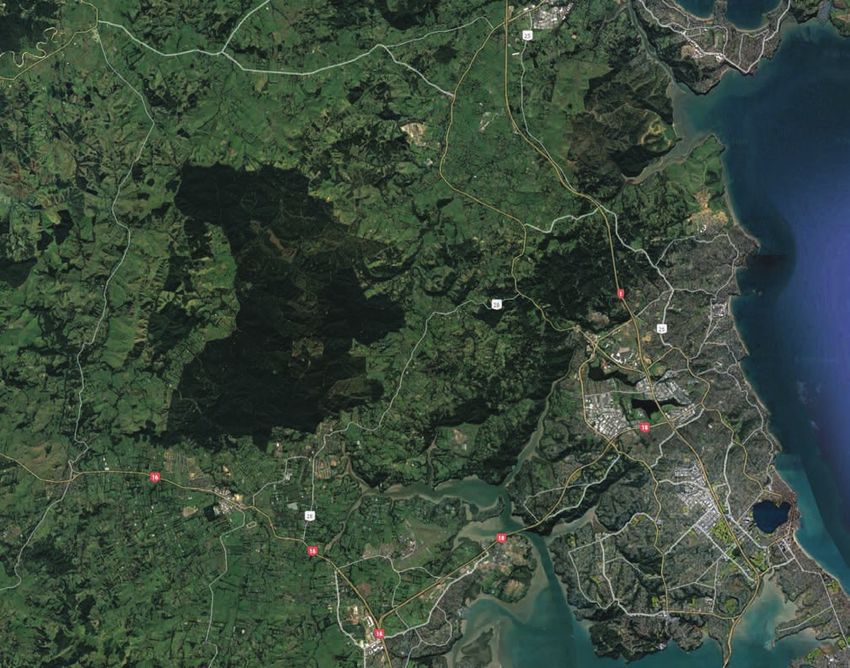
The Time                                       Investing                                     The
is Now                                         in the Future                                 Innovation City
There is no time to waste. Auckland has        Planning for growth and masterplanning        Leveraging public investments in research,
40,000 households living with family, in       for quality opens the door for even bigger    education and health in a digitally enabled
garages and on the street. The number is       possibilities.                                city will drive investment in high-skilled,
growing by 20 a day.                                                                         high-income employment. Paerata can
                                               Technology is changing every aspect           become the centre of a new southern
Property investors know the system is          of cities. Connected networks, the            city of 500,000 or more with technology,
not working. They know the city will grow      internet of things and automation are the     innovation and prosperity at its heart.
and they know there is money to be made        infrastructure of tomorrow. Incremental
betting on future zoning. Speculation is       development does not support the trends       The Innovation City will deliver better jobs,
driving up the cost of land every week and     and opportunities we know are coming to       better networks, stronger communities and
reducing the ability to leverage land values   urban environments.                           desirable urban living.
to deliver affordable housing.
                                               A brand new satellite city can be digitally
                                               enabled from the roads on the ground
                                               to the tallest buildings. People can
                                               communicate with vehicles, vehicles with
                                               networks, networks with operators and
                                               operators with people.

                                               Incorporating new opportunities in design,
                                               engineering and sustainability, a new city
                                               can be made more efficient and more
                                               resilient. Streets can be configured to
                                               support autonomous vehicles. Low impact
                                               design can maximise existing land and
                                               water features to reduce impacts on the
                                               environment. Enhanced corridors and
                                               planned provision for services can protect
                                               Auckland’s essential services.

MEETING AUCKLAND’S GROWTH CHALLENGE:
THE INNOVATION CITY
OCTOBER 2017                                                                                                                           5
Auckland’s
Growth Challenge
Auckland has a
three-dimensional growth problem:

     1     Not enough homes
           are being built;
                                     In 2016, Infrastructure New Zealand (then the New Zealand Council

     2
                                     for Infrastructure Development) investigated the second of the
           Serious congestion        three big challenges. The report Transport Solutions for a Growing
                                     City found that how the region was responding to growth was
           is getting worse;         more significant than the scale of growth in relation to network
                                     performance.

     3
                                     Auckland’s population growth rate has been high in recent times,
           Funding growth is         but has remained constant overall since the early 1990s (Figure 1).

           increasingly difficult.   These levels are not out of step with faster growing cities globally,
                                     many of whom demonstrate lesser transport deterioration.1

                                     1   The Auckland region’s growth rate of 1.9 per cent per annum since 1996 is well below South East
                                         Queensland’s 2.4 per cent average growth between 2003 and 2013, for example, and Brisbane
                                         performs much more strongly in terms of congestion, see http://www.qgso.qld.gov.au/products/
                                         reports/pop-growth-highlights-trends-reg-qld/pop-growth-highlights-trends-reg-qld-2015.pdf
                                         and Austroads, Congestion and Reliability Review, December 2016.

                                                                                                                 infrastructure.org.nz
 6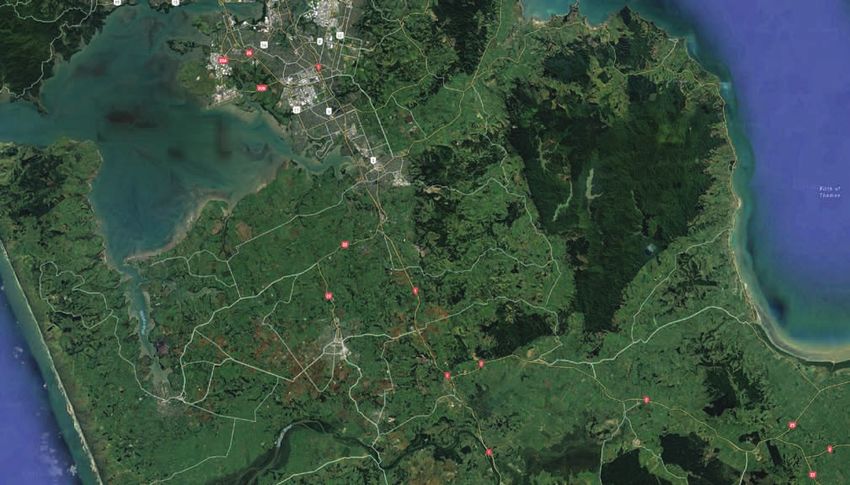
Figure 1: Auckland regional population vs Greater Brisbane2
     2,500,000

     2,000,000

      1,500,000

     1,000,000

       500,000

              0
                1985                   1900             1995                 2000          2005                   2010                   2015                     2020

                                              Auckland Regional Population               Greater Brisbane Census Population

Transport Solutions found that the                        Comprehensive analysis by the collective           A new approach to growth is required
allocations of growth assumed through the                 of New Zealand’s leading transport bodies,         which delivers more homes:
Unitary Plan are misaligned with transport                via the Auckland Transport Alignment
infrastructure. It is this misalignment                   Project (ATAP), has shown that no                  1.     Rapidly,
which is exacerbating transport pressures                 investment programme can meet the
and increasing the need for additional                    growth allocations broadly set out in the          2. Affordably, and
investment. Specifically:                                 Unitary Plan. Only by suppressing demand
                                                          can congestion can be improved, but even           3. In a way which does not exacerbate
•    Densification is permitted in a                      this requires some $6 billion of urgent                   transport pressures.
     number of areas with poor transport                  investment beyond what is currently
     connectivity, increasing demand                      funded.
     for private vehicle trips and fuelling
     congestion.                                          The Independent Hearings Panel on
                                                          The Auckland Unitary Plan assumed
•    Redevelopment is impeded in a number                 infrastructure could be delivered to
     of areas receiving large rapid transit               areas it identified for growth. Transport
     investment, making public transport                  modelling has since shown this
     less attractive as an alternative.                   assumption to be misplaced. Government
                                                          assistance to Watercare through the
•    Greenfield housing growth is spread                  Housing Infrastructure Fund and Crown
     across the region but employment                     Infrastructure Partners indicates the
     is concentrated in the centre and                    problem is not limited to transport.
     south, necessitating long journeys on
     constrained corridors.                                                                                  2 Statistics New Zealand. Australian Bureau of Statistics.

MEETING AUCKLAND’S GROWTH CHALLENGE:
THE INNOVATION CITY
OCTOBER 2017                                                                                                                                                          7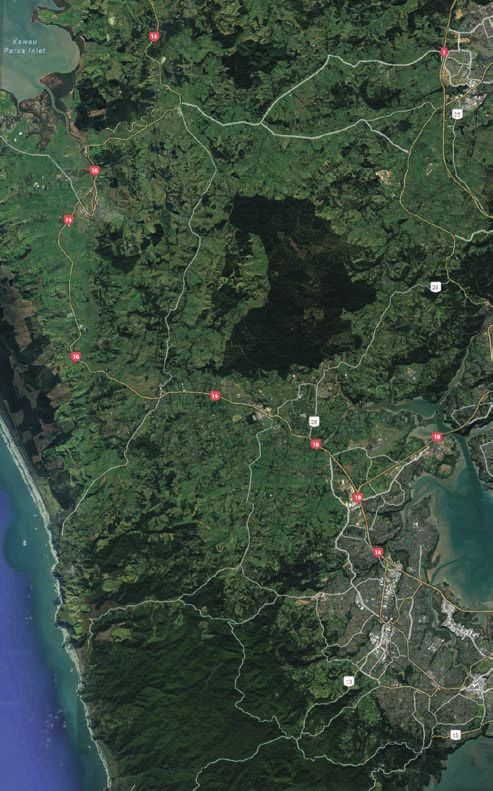
A New
Approach:
Integrated Urban
Development
at Scale
The Housing
Challenge is Large, Not
Insurmountable
Auckland can deliver the homes and infrastructure it needs.           Delivering 14,000 homes per annum over the next decade will be
Population growth is currently at record levels, but should not       challenging, but not impossible. With a population of under 1 million
be expected to remain this high. Figure 1 displays a much more        the Texas city of Austin issued almost 12,000 building permits in
consistent growth profile over the long term than has been evident    2013.3 Brisbane and Perth, with populations 30-40 per cent greater
in the last decade. If Auckland continues along this long term        than Auckland, both consistently issued around 20,000 residential
growth trajectory, rather than the extreme levels seen recently,      building permits per annum over the early 21st century.4 Each city
which is more likely, the regional population will be approximately   has managed to keep housing significantly more affordable than
2.3 million in 2040.                                                  Auckland.

A 2040 population of 2.3 million is 700,000 residents greater than
today’s population – an average growth rate of 30,000 people
per annum over the next 23 years. At existing levels of around 3
persons per dwelling, Auckland under this scenario requires 10,000
new homes each year.

In addition, Auckland must deliver a further 40,000 new homes to
address the backlog identified by both the Auckland Council and
the Auckland Independent Hearings Panel on the Unitary Plan.
Clearing this backlog within a decade will require 4,000 additional
                                                                      3 http://www.civicdashboards.com/city/austin-tx-16000US4805000/#
homes per annum over that period.                                     4 http://blog.corelogic.com.au/2014/09/july-2014-building-approvals-data/

                                                                                                                                                  infrastructure.org.nz
   8
Congestion Integrated
Can be Reduced Development at Scale
Auckland’s population of around 1.6 million is not large by global Infrastructure New Zealand wanted to investigate a short and
standards. Comparative congestion metrics suggest that the city’s medium term response to Auckland’s urgent housing, transport and
travel time delay is consistent with much larger cities, including affordability challenges. Specifically, we wanted to test a scenario
Manchester, New York and Melbourne. It is significantly worse
5
which:
than higher performing cities, even those facing rapid growth.
1. Delivered a large number of homes rapidly, and
Auckland’s own congestion monitoring shows that performance
can be improved. Between 2006 and 2013, travel time delay and 2. Delivered them in a way and location which supported regional
variability on Auckland’s strategic network improved. Lower connectivity, and
population and economic growth through the Global Financial
Crisis was one contributor, but so was effective investment. The 3. Delivered them affordably for both infrastructure providers and
combination of both, specifically, supportive land use change new home owners.
(in this case via slower housing and employment growth) and
measured policy delivered benefits. Aligning new housing and The combination of these factors led us to the concept of
employment activity with a fit-for-purpose investment programme integrated development at scale. Scale is required because
will reduce pressure on transport networks. a large volume of housing is required and because larger
building contracts can support innovation, standardisation and
prefabrication. These factors are needed to increase productivity
Growth Can and deliver homes in a tight labour market at an affordable price.8
be Affordable Integrating transport with development is necessary to optimise
transport assets and limit regional travel demand. Timing and
sequencing transport investment with development reduces
Integrating growth with infrastructure so that new homes and jobs the lag between infrastructure delivery and capacity utilisation.
arise where services have capacity will reduce costs. The major Masterplanning employment, housing and transport reduces
opportunity to grow affordably, however, is by channelling land pressure on regional movements. Collocating growth with rapid
value improvement from zoning and services to infrastructure transit (transit oriented design) makes public transport more
funding. competitive for regional movements which must occur.
Land outside a zoned and infrastructure enabled location has been Integrated development is also needed to solve the affordability
shown to be around one-tenth that which is development ready.6 challenge. Zoning, infrastructure and services unlock land value.
Conventional planning and development approaches do not tie Tying zoning to service provision so that land value increases are
value improvement from zoning or infrastructure to the provision allocated to infrastructure providers is necessary to fund growth
of these services. Nor does service provision require development infrastructure.
on any fixed timeframe. This disaggregated approach to planning,
infrastructure and development has seen Auckland land values rise
from around 40 per cent of the value of a home to over 60 per cent
at the same time as property values have doubled.7
Capturing land value is not easy under existing practice, but
emerging Urban Development Agency legislation does provide an 5 TomTom
6 Productivity Commission, Housing Affordability Inquiry: Final report, 2012.
avenue. Establishment of a public body with some combination of 7 Productivity Commission, Using Land for Housing, September 2016.
8 Productivity Commission, Housing Affordability Inquiry: Final report, 2012; Productivity
land acquisition, planning, rating and infrastructure authority would Partnership, Construction Productivity in Canterbury, http://www.mbie.govt.nz/publications-
research/research/construction-sector-productivity/canterbury-rebuild-construction-
make value capture much more viable. productivity-in-canterbury.pdf
MEETING AUCKLAND’S GROWTH CHALLENGE:
THE INNOVATION CITY
OCTOBER 2017 9Brown or Greenfields? Identifying
An early question confronting us was whether integrated transport and development at
Innovation
scale should be tested in a brown or greenfields environment. We opted for greenfields
for three reasons. First, it is difficult outside of the advanced Tamaki project to find land
City Locations
holdings of a size which can support scale redevelopment in Auckland.
The first step in planning integrated
Second, brownfields redevelopment is more politically and technologically challenging. development at scale was to identify an
Addressing local concerns and operating within an established urban environment is appropriate location. Our objective was to
complex and meeting expectations is likely to slow housing development and increase narrow feasible locations down to a small
complexity. number of priority sites which we could
then investigate and compare. We followed
Third, the higher cost of land in brownfield environments reduces the ability to leverage a two-step process which, first, pinpointed
land value to fund transport and deliver more affordable housing. all those areas with physical capacity for
a new city and, second, narrowed options
to those locations with the best transport
potential.
The Option Tested: We performed a desktop survey of all
a Satellite City for 100,000 locations within 50km of the Auckland
CBD with at least 2000ha of flat or
rolling agricultural land. We excluded
Following our evaluation, we concluded that testing a single major urban development in environmentally sensitive areas, elite soils
a greenfield location would best satisfy the need for more homes, quickly, affordably and and land which is undulating and therefore
consistently with transport services. more expensive to develop. We did not take
into consideration ownership, infrastructure
By focusing growth in a single, albeit large, undeveloped site, Auckland could sequence, feasibility or market attractiveness through
target and align development and infrastructure. Raw land values could most easily be this phase.
leveraged to align infrastructure costs with benefits and enable housing to be delivered
at uninflated costs. The absence of major established communities would facilitate rapid This process highlighted 14 separate
delivery of both infrastructure and development and would be most feasible from a political locations around the region, including
and social perspective. five in the north, two in the west, two in
the east and five in the south.9 Two of the
We decided we would investigate a development of roughly 100,000 residents. This is southern locations were situated outside
approximate to the 40,000 homes that Auckland needs to house its population. We opted the Auckland region. We also included in
for a slightly lower figure of 30,000 homes, to more neatly fit a third share each of high, our analysis land around Wellsford which,
medium and low density housing. To facilitate shorter journeys and lessen the impact of at 65 km, is located beyond our 50km limit,
commuting, we decided we would also seek an outcome with one job per household – but is also an existing Auckland centre and
30,000 jobs. We use the terms “city of 100,000” and “city of 30,000 homes and 30,000 therefore of potential interest.
jobs” interchangeably, noting a slightly larger number of homes would likely be required to
house 100,000 residents. The 14 locations are identified below.
Orange circles denote locations we
For a development of this size, we concluded we would require a greenfield site of discarded. Blue denotes areas we took
at least 2000 hectares. A city of 100,000 inside 2000ha would be comparably dense forward for further investigation.
by Australasian standards (approximately two times more persons per hectare than
metropolitan Auckland today and twice as dense as existing growth plans for Dairy Flat- 9 We chose to divide the southern area between Pukekohe
and urban Auckland up into three distinct locations (Clarks
Silverdale), but would support existing council policy to limit urban expansion. Beach, Karaka and Paerata). We decided to exclude the area
east of Drury which, although large enough, is already being
readied for development and is so close to the urban area
as to make independent development difficult. It should be
The first phase of our study involved the identification of developable land around noted that, unlike other parts of Auckland, there are limited
geographical features separating the entire area north of
Auckland capable of accommodating a city of this size. Waiuku-Pukekohe-Bombay.
infrastructure.org.nz
10Map 1 and 2: Large developable land holdings in Auckland: North and West
Wellsford
Matakana
Helensville
Warkworth
Kumeu
South
Waitoki
Dairy Flat
Map 3: Large developable land holdings in Auckland: South and East
Clevedon
Coast
Clevedon
Karaka
Clarks
Beach Paerata
Elite soils (excluded)
Aka Aka Pokeno
MEETING AUCKLAND’S GROWTH CHALLENGE:
THE INNOVATION CITY
OCTOBER 2017 11Phase 1 suggested there was much more North South
developable land around Auckland capable
of accommodating major growth than Analysis of the north quickly indicated Auckland’s south provides the greatest
we had initially expected. It was evident, that more distant locations around availability of land. Virtually the entire
furthermore, that land sufficient to Wellsford, Matakana, Warkworth and area north of (and excluding) Pukekohe’s
accommodate a major new city existed in Waitoki presented no clear advantages elite soils is developable – some 20,000
each of the north, south, east and west of to a development at Dairy Flat-Silverdale, hectares. In addition, there are other
the region. This raised the possibility of a which was closer to the Auckland CBD significant land holdings in the deeper
sample study in each “corner” of Auckland, and to transport infrastructure. We did south. Located further from central
enabling a potentially valuable comparison note, however, that lower land values Auckland and less accessible, Clarks
of different infrastructure and development in these areas could potentially offset Beach, Aka Aka and Pokeno were rejected
challenges by sub-region. Our initial higher investment needs. We decided in favour of options closer to the CBD.
preference to sample between one and to investigate Wellsford, Matakana,
three priority locations was expanded to Warkworth and Waitoki only if Dairy Flat The obvious locations to locate a satellite
include one site north, south, east and west emerged as the preferred location in city in the south are Paerata and Karaka.
of the Auckland urban area. Phase 3. Paerata is located close to rail and
motorway infrastructure and is already
Phase 2 involved a high level assessment West planned for growth (some is already
of the comparative feasibility of providing under development). However, with a
transport services to the 14 locations Fewer options were present in the west, connection across the narrow Pahurehure
identified in Phase 1. with only an area along the rail line south inlet, Karaka would become significantly
of Kumeu and land around Helensville closer to Auckland. Karaka also possesses
large enough to accommodate a city of the benefit of not being zoned for future
the study’s size. The proximity of the area growth and therefore should be lower cost.
around Taupaki to the city and rail made it
a clear priority. Including both Paerata and Karaka in
the study provided the opportunity to
East investigate land values across zoned and
unzoned land. Lower cost land increases
Like the west, the east contained relatively the potential to capture land value for
few development options, with both investment in infrastructure. We elected to
identified sites part of the larger Clevedon take forward both Karaka and Paerata.
valley. Although there is likely some
amenity value gained if development is
focused around the Clevedon coast, we
did not consider this benefit to outweigh
the added cost of providing transport and
other services some 5-10km further from
the Auckland metropolitan area.
infrastructure.org.nz
12Map 4: Preferred sites for investigation and Unitary Plan zonings: Dairy Flat-Silverdale and South Kumeu
Dairy Flat-
Silverdale
South
Kumeu
Map 5: Preferred sites for investigation and Unitary Plan zonings: Clevedon, Karaka and Paerata
Clevedon
Karaka
Paerata
MEETING AUCKLAND’S GROWTH CHALLENGE:
THE INNOVATION CITY
OCTOBER 2017 13Costing a
Satellite:
Infrastructure
To find out which part of
Auckland provides the most cost-
effective location for a major
new development, we wanted to
understand the relative costs of
growth in each area.
We contacted key infrastructure providers and asked them to
estimate the capital cost on their service of an additional 100,000
residents in each of the five locations. We asked providers
Water, Energy and
to assume that the Unitary Plan provisions remain otherwise
unchanged and that growth was additional to existing plans.
Telecommunications
The numbers in this section should not be interpreted as being
Requirements
the total cost of providing for 100,000 people, but of 100,000 more
over and above existing plans. All information in this section is We approached key utility providers and asked them to provide
indicative and reflective of average past experience, rather than a high level estimate of what assets and investment would be
the specific requirements of projects themselves. Risks regarding required to service a city comprising 30,000 homes and 30,000
consenting, funding and sequencing have not been part of the jobs in each of the five locations. The total costs are set out in
assessment. Table 1.
infrastructure.org.nz
14Table 1: Infrastructure costs in different parts of Auckland10
Dairy Flat-
Agency Service Kumeu south Clevedon Paerata Karaka
Silverdale
Watercare Wastewater $185m $160m $230m $170m $150m
Water supply $115m $65m $1m $0 $75m
Electricity
Transpower $46m $51m $30m $18m $25m
transmission
Vector Electricity
$210m $242m $237m $225m* $225m*
Counties Power distribution
Vector Gas $61m $61m $61m $61m $61m
Chorus Fibre $185m $185m $185m $185m $185m
Total $802m $764m $744m $659m $721m
Several key findings are evident in the Each of these providers is regulated Finally, the combination of the above
information provided. Firstly, there and none has a mechanism to allocate three findings reveals a potential conflict.
is a significant cost difference from additional costs to the development. The large cost carried by an individual
development in different parts of Auckland. Increased costs are spread over all infrastructure company from a strategic
Up to $150 million can be saved across customers. For Vector, a partially privatised growth decision is not shared by a home
water and energy services simply by entity, higher costs are absorbed by owner or developer. It may thus be in
growing closer to where existing and shareholders. For Transpower, a national the infrastructure provider’s interest to
planned assets are located. provider, higher costs are spread across resist, defer or deprioritise spending on a
all of New Zealand. Increased costs are development, when the cost difference to
Secondly, infrastructure providers are not only converted into higher charges with a developer is very minor. Any mechanism
all affected by growth decisions equally. the approval of the regulator. Less profit which allows and encourages the developer
Chorus is not as exposed to capacity or deferred investment elsewhere are the to meet these higher costs could have
constraints (at least at the scale tested) result. a major impact on an infrastructure
as other providers. Impacts on Watercare, provider’s ability to meet demand and a
Vector and Transpower can be significant. Third, while the impact on infrastructure developer’s access to critical services.
For Watercare in particular, growth providers can be significant, these costs
decisions can result in the deferral or appear relatively insignificant in proportion The Paerata area was found to be the
bringing forward of investment decisions in to home prices. Spreading the total costs most cost effective location from a water,
the hundreds of millions of dollars. In light in each area across 30,000 households energy and telecommunications delivery
of Watercare’s ownership by the Auckland results in a maximum spend of $27,000 perspective. The second cheapest location
Council and consequent debt limitations, per dwelling in Dairy Flat-Silverdale and a is Karaka, followed by Clevedon, indicating
the location of growth is of critical minimum of $22,000 in Paerata. that new growth in the south is generally
importance. more cost effective than in other locations,
before transport costs are considered.
10 Information provided by relevant providers, except where indicated by *. Counties Power have
not investigated additional growth scenarios but expects costs to be equivalent to Vector. Vector
mid-range estimates used. Mobile services not included. Provision is fully private and costs vary
according to brown or greenfield, but not location.
MEETING AUCKLAND’S GROWTH CHALLENGE:
THE INNOVATION CITY
OCTOBER 2017 15Transport
The engagement of Auckland Transport and New Zealand Transport assessment of each location includes a direct, location
Transport Agency officials in ongoing future growth area work specific transport cost and a wider regional risk assessment. This
restricted our ability to use the same approach for transport as is to recognise that growth of 100,000 people in any location will
with other network services. Infrastructure New Zealand developed carry significant regional travel implications and these have the
transport networks for the purposes of comparison in each of the potential to be very costly. We highlight the risk of these costs
five locations. Networks are based wherever possible on those and provide indicative costs for improvements. All estimates are
developed through the Supporting Growth initiative – Auckland’s informed by ATAP modelling 2016 and assume Supporting Growth
future urban area transport planning process – and have evolved in package delivery.11
discussions with participants in growth processes.
We identified the following networks and costs in each of the five
The clear limitations of this approach mean that there is significant locations:
uncertainty around transport costs. Consequently, we include
in this section a risk assessment by location. Our priority was to Dairy Flat-Silverdale
ensure networks were broadly comparable.
The Auckland Independent Hearings Panel on the Unitary Plan
In the Dairy Flat-Silverdale and Paerata locations, Supporting identified approximately 4000ha of future urban area land in
Growth networks have largely determined the shape and form of Silverdale and Dairy Flat. This land is earmarked for just under
our comparative networks. In both locations, our major assumption 30,000 homes so is comparable from a residential perspective
is that the city could co-locate with and beside existing planned to our satellite proposal, but across twice the land area. Our
development. We assume road corridors remain the same, but assumption for a satellite in the north is that an additional 100,000
increase their capacity. residents can be accommodated broadly within the already
planned growth area.
In currently unplanned locations (principally Kumeu South,
Clevedon and Karaka), we had to develop new network plans. We The presence of rapid transit, a motorway and extensive arterial
then tested these assumptions with transport planning experts network met the key requirements of our transport assumptions.
to refine them and ensure they were broadly comparable with the We decided as a starting point to transfer across the exact
professionally developed networks. Silverdale-Dairy Flat network from the Supporting Future Growth
study, with one modification. We assumed regional arterial network
Our starting assumption was that each location must be demand would be doubled, increasing the average cost from $20
served with rapid transit, an expressway linked to the strategic million per km to $35m per km. The Supporting Growth network
road network and be serviced by regional arterials (situated and high level costs are included below.12
approximately 2km apart). Existing road corridors were used where
possible (though in practice this may not always be desirable) and There are approximately 55km of arterials planned for the northern
local roads were not included in this phase. The assumptions we growth area. Using the mid-range estimate from Table 2, arterials
used to develop networks in each of the locations are included in are anticipated to cost $1128 million. The cost of adding a lane to
Appendix 1 at the end of this document. these roads is, using the assumptions set out in Appendix 1, $15
million additional per km, or $800 million in total.
• Our baseline transport cost of an
additional 30,000 homes and jobs in
the north is $800 million.
11 ATAP, Evaluation report, 2016.
infrastructure.org.nz
16Regional transport feasibility of Dairy Flat-Silverdale
We assess the overall risk that the above transport plan for a
Silverdale-Dairy Flat satellite will require substantial additional
regional investment as high.
Table 2: Supporting Growth high and low estimates for greenfield A complicating factor for transport assumptions to, from and
growth in Dairy Flat-Silverdale.12 through the Silverdale-Dairy Flat growth area is that ATAP analysis
clearly shows growth in the north is difficult to service. Under all
North $2,743 $3,535 ATAP scenarios modelled in 2016, except the indicative package,
demand for travel to and from the north was severely constrained.
Improvements to SH1 $345 $457 Only with the application of pricing combined with an additional
harbour crossing, improved mass transit and motorway widening
Alternative was access to the north adequately supported.
$220 $299
Strategic Links
Rapid Transit & Public These additions, however, are not included in the Supporting
$1,167 $1,535
Transport Improvement
Growth programme. In total they add some $10 billion to the cost
Arterial Roads North $263 $339 of major transport infrastructure in the north and represent almost
one-third of all Auckland’s transport capital investment assumed
Supporting Growth – Delivering Transport Networks
by ATAP. It is true that these services will serve residents in the 13
Arterial Roads South $749 $905
existing metropolitan area and further north, but the addition of the
NORTH – SILVERDALE, WAINUI EAST AND DAIRY FLAT
30,000 dwellings in the Supporting Growth programme appears
To Warkworth to trigger the need for exponentially higher transport expenditure.
Projects
It must be assumed that the addition of another 30,000 homes
NEW OR IMPROVED PUBLIC
assumed through
TRANSPORT this study would make this investment
CORRIDOR
Orewa unavoidable
1. (and
Rapid Transit Network
Albany to Grand Drive
in fact
extending from bring it forward).
2. A high frequency bus route connecting
Orewa and Silverdale with the Rapid
• We consider in our regional risk
Transit Network
NEW OR IMPROVED
Wainui East 1
2
appraisal
ROAD CORRIDOR a $10 billion additional
9
Silverdale
investment programme to service a
3. Penlink and new east west connection
to Dairy Flat
2
10 satellite in the north.
4. New north south connection between
Albany and Orewa
Red Beach 5. Upgraded Dairy Flat Highway
6. Upgraded East Coast Road
8 The operation of the SH1 corridor as a wider infrastructure corridor
7. New and upgraded east west
connections, including Wilks,
Silverdale Kahikatea Flat, Pine Valley and
West
potentially carries costs for other assets. All rail options in a 2016
Awanohi Roads
7
8. Curly Avenue extension east west
Aurecon study of mass transit options assumed trains use the
connection
14
9. New connection to Grand Drive
6
busway alignment for at least a part of the journey. This may
10. Increased capacity on State Highway 1
create an issue for any services running under the busway, most
CYCLING AND WALKING
7 3
notably a high voltage transmission cable carrying electricity to the
• Implement cycle network
7
north. Accessing the cable will be more difficult if rail replaces the
LEGEND
busway as rail services cannot be rerouted. Removal, reconsenting
July 2016 Future Urban Zone
(Potential Business)
4
andJulyreconstruction
2016 Future Urban Zoneof the cable is expensive, likely costing in the
5 (Potential Residential & Other Urban Uses)
3
hundreds
Live Zoned of millions of dollars.
Special Purpose
Future Urban Zone added as a result of
Council decisions on the Unitary Plan
10
• We highlight the potential impact on
Existing Urban Area
New park and ride
7 6 other services from changes to the
Indicative Potential New Centre
State Highway
Dairy Flat busway, but do not include them in
New public transport corridor
Improved road corridor
our estimates.
New road corridor
1
10
12 Transport estimates are based on a number of general assumptions. No geotechnical assessment,
surveys or full engineering assessment was undertaken for this stage of the Business Case.
To Albany To Albany
13 ATAP, Evaluation report.
14 Aurecon, Rapid Transit Study: Summary, July 2016.
Projects within the programme will be prioritised for delivery over the next 30 years, subject to funding approvals. Projects will require statutory approvals and will be subject to
Subject to consideration by Auckland Transport and NZ Transport Agency Boards.
Resource Management Act and Land Transport Management Act public participation processes. Land use is subject to further investigation, as well as resolution of appeals and
Live zoning and Future Urban Zone from Unitary Plan decisions are yet to be made operative under the RMA. Indicative land use subject to further investigation.
statutory process arising from the Unitary Plan process.
MEETING AUCKLAND’S GROWTH CHALLENGE:
THE INNOVATION CITY
OCTOBER 2017 17Map 6: Infrastructure NZ indicative transport plan for South Kumeu
Kumeu
Massey
Kumeu South • Using the price assumptions set out
in Appendix 1, road infrastructure in
The area along the rail line south of Kumeu has not been identified Kumeu South is estimated to cost
as an area for future growth in the Unitary Plan. Supporting Growth $320 million.
network improvements have been identified for adjacent growth
areas around Whenuapai, Red Hills and Kumeu. We developed A new busway to the north west is planned to run to the north of
a hypothetical transport network for Kumeu South building off the hypothetical Kumeu South city. One option could be that the
these planned improvements and using the assumptions laid out in busway heads south to provide the rapid transit solution to the
Appendix 1. area, but we have assumed growth at this scale will necessitate
extension of electrified rail from Swanson. KiwiRail estimates the
Orange lines illustrate the existing intention of authorities to cost of double-tracking, electrification and tunnel (or diversionary)
support growth in Westgate, Kumeu and Huapai. Blue lines works between Swanson and Kumeu at around $200 million. Rail
represent Infrastructure NZ hypothetical transport infrastructure stations through this study are assumed to cost $30 million and a
necessary to support an additional city of 100,000 people, located slightly higher figure of $50 million is assumed for the transport
broadly along the rail line. Blue solid lines represent arterial roads hub.
and the dotted line an upgraded western rail line. The blue square
represents an interchange and the blue dots rail stations. • Including enabling works, two new
rail stations, an integrated busway-
In total, around 15km of regional arterials and an interchange with the rail hub, we estimate the cost of
new motorway are assumed. Arterials are more tightly located under rapid transit for Kumeu South at
this option than in other areas, but the area serviced slightly smaller. $340 million.
We retain the same estimates as that used in Supporting Growth of
around $20 million per km. An interchange is costed at $20 million.
infrastructure.org.nz
18Regional transport feasibility of Kumeu South
We assess the overall risk that the above transport plan for a
Kumeu South satellite will require substantial additional regional
investment as high.
Total transport network spending to service a city in the north
west is comparatively low. This is due to the large amount of
infrastructure either present or planned. An additional strength of
Kumeu, and the wider north west, is that future modelling by ATAP
indicates SH16 does have broadly sufficient capacity to 2046 if
road pricing is introduced.
The weakness of the Kumeu South option is uncertainty around
public transport. The ability to integrate rail with a busway at the
junction of a realigned SH 16 adds resilience and flexibility, but it is
not clear whether the busway will have capacity. ATAP modelling,
under all scenarios including the indicative package, highlighted
severe public transport capacity constraints by 2046 between the
north west and CBD. Significant investment appears necessary to
support existing, let alone additional, growth in the north-west.
Expansion of rail may assist with capacity constraints, but it is still
not clear how viable rail is as a solution. Rail services from Swanson
to the CBD currently take 55 minutes. Rail from South Kumeu
would take approximately 70 minutes. Triple tracking the western
line, which would not be sufficient to provide non-stop services to
central Auckland, is estimated at around $2-3 billion.15 Providing
a fourth track to enable non-stop services and to radically cut
commuting time will cost materially more.
A major further uncertainty concerns level crossings. There are
17 road crossings between Swanson and the CBD and a further
eight (six of which are private) between Swanson and Kumeu. With
increased train frequencies following the opening of the City Rail
Link (CRL), these crossing will have a growing impact on traffic
congestion. Worsening congestion will incentivise risk taking at
level crossings, leading to safety issues. Grade separating road and
rail carries a large cost and is disruptive.
• We consider a cost of $3 billion to
four-track rail to a Kumeu South
satellite.
15 http://www.stuff.co.nz/auckland/local-news/northland/78592378/kiwirail-delivers-a-reality-check-
at-grow-northland-rail-meeting-in-whangarei
MEETING AUCKLAND’S GROWTH CHALLENGE:
THE INNOVATION CITY
OCTOBER 2017 19Map 7: Infrastructure NZ indicative transport plan for Clevedon
Clevedon
Manurewa
Clevedon • Our estimate for the Clevedon
satellite road network is $1 billion.
Clevedon is not identified for future growth and has no motorway
nor rapid transit access. The lack of existing corridors requires Rapid transit is assumed to be provided via a busway along the
greater assumptions about the location and form of trunk expressway. The option costed runs from the current Clevedon
infrastructure. Infrastructure New Zealand has provided an village to Mill Rd and includes a busway along the new Mill Rd
indicative outline of one potential network using the requirements corridor to central Manukau. In total it is approximately 18km in
for strategic road and rapid transit connectivity outlined in length and costed at $50 million per km.
Appendix 1.
• Assuming an 18 km grade separated
The orange lines indicate planned investments expected to support busway service with three stations,
growth in the south-east. The Infrastructure New Zealand indicative public transport to the area would
network to support a city of 100,000 is illustrated in blue. The cost $960 million.
three blue dots represent busway stations and the blue square an
interchange.
An expressway connecting the planned upgrade of Mill Rd to
Clevedon is 10km in length and provides two lanes in each direction.
It includes an interchange at Mill Rd. A further 23km of regional
arterials are included. Using the estimates in Appendix 1, we cost
the expressway at $50 million per km, arterials at $20 million per km
and an interchange at $20 million.
infrastructure.org.nz
20Regional transport feasibility of Clevedon Rapid transit services are equally uncertain. We have assumed a
busway connecting to Manukau, but it is likely that more would
We assess the overall risk that the above transport plan for a be required. A rail trip from Manukau to the CBD takes 38 minutes
Clevedon satellite will require substantial additional regional today and passes through the eastern line, missing key employment
investment as high. nodes in Penrose and Newmarket. Journey times from a Clevedon
satellite to the central city, including transfers would exceed 1 hour,
Clevedon is a large land area generally unimpeded by existing potentially by a significant margin.
activities. There are multiple options for transport within the area,
including strategic links to the north and south. However, the One advantage of introducing dynamic road pricing is that, if
connection of those links to the wider transport network is highly motorway speeds can be guaranteed, busway lanes would become
uncertain. unnecessary. Clevedon could potentially link directly to the CBD via
bus.
It is unlikely that the Mill Rd upgrade as presently envisaged would
be capable of supporting travel demand to and from the satellite. • We note that public transport options
The conversion of Mill Rd to a full motorway interchanging around to Clevedon may be inadequate,
Manukau may be required. As well as being expensive, such a but we do not estimate the costs of
project would be difficult to consent and a number of homes would additions.
be affected.
A more substantive risk with Clevedon is that it may trigger the
need for major road investment. The satellite would be heavily
dependent upon SHI, which is under extreme pressure by the
2040s under all modelled scenarios. Travel demand pressure would
increase into and through Flat Bush and the eastern suburbs. An
eastern motorway linking the CBD, Pakuranga and Clevedon may
be required for a Clevedon satellite to proceed. This solution was
costed at around $10 billion by ATAP.
• We note the risk that Clevedon
development creates a need for a
major motorway solution, but do not
include it in our analysis.
For the purposes of comparison, we assume an additional lane in
each direction is provided along the Mill Rd-Redoubt Rd corridor
between Popes Rd and Manukau. This much capacity intersecting
at the junction of SH1 and SH20 suggests a full motorway and
interchange would be required. Including the costs of consenting
and property purchase, this solution would be costly.
• We consider a $1 billion motorway
upgrade linking the SH1 and SH20
interchange with Clevedon.
MEETING AUCKLAND’S GROWTH CHALLENGE:
THE INNOVATION CITY
OCTOBER 2017 21Map 8: Infrastructure NZ indicative transport plan for Paerata
Karaka
Drury
Runciman
Ramarama
Paerata
Paerata Orange lines and dots indicate investments which are planned to
support expected growth between Paerata and Drury. The blue
The land to Auckland’s south contains a very large amount of line and dot indicate Infrastructure NZ additions to support an
raw developable land. Infrastructure New Zealand identified land additional 100,000 residents.
closest to rail south-west of Drury for the hypothetical city. This
area includes a mix of live-zoned, future urban and land which is not There are approximately 13km of regional arterials servicing Paerata
zoned for development under the Unitary Plan. A comprehensive in the Supporting Growth network. This excludes the strategic Mill
transport plan has been developed through the Supporting Growth Rd to Pukekohe corridor and SH22 between Drury and Paerata. The
programme. cost of adding a lane to this network is $200 million.
We adopted a similar approach to a hypothetical Paerata city SH22 is earmarked for safety improvements which include some
transport network as with Dairy Flat-Silverdale. We assumed four-laning of the predominantly two-lane corridor. We assume
existing planned corridors would proceed, but that densities would that half of the 12km corridor will be converted to four lanes under
increase. Higher densities increase total demand, so we assume existing plans and that a Paerata satellite will necessitate four-
arterials in the Paerata area would include an additional lane in each laning of the remaining 6km. The cost of this work is $90 million.
direction. The planned investments and potential additions are
outlined in Map 8.
infrastructure.org.nz
22The only new road corridor we identify runs adjacent to the rail line. Regional transport feasibility of Paerata
We include this because the Paerata road network is less dense
than in other planned areas in the north and north-west. This road We assess the overall risk that the above transport plan for
is 6km long and, assuming two lanes in each direction, would cost a Paerata satellite will require substantial additional regional
around $200 million. investment as medium.
• Total road upgrades assumed for Situating a city between Paerata and Drury would likely require
Paerata cost $500 million. comparatively little investment not already featured in official plans.
The location is close to SH1 and a new strategic connection linking
The Supporting Growth programme provides for major public to Mill Rd. Papakura is 51 minutes from Britomart, meaning rail
transport improvements between Papakura and Pukekohe. Rail services in the area will provide direct services to the CBD in around
electrification and three more stations (two of which are located 1 hour. Full end-to-end travel by rail from the area to the CBD will be
in the Paerata area and the third at Drury) are planned. The only competitive with private vehicles at busy times, assuming stops at
entirely new public transport addition we include to support growth all stations.
of Paerata city is a rail station on currently unzoned land.
Growth at Paerata would add to pressures which are already
• The cost of public transport significant along SH1. However, the new strategic connection to Mill
improvements for a Paerata satellite Rd, the ability to access SH20 and the weighting of employment
is $30 million. south of Penrose mitigate the significance of this impact.
In comparison to the increased demand placed on the western line
by Kumeu South, the southern rail line is more readily upgradable.
There are only four road crossings between Papakura and the CBD.
In addition, there are well-developed plans to triple-track sections
of the line.
We asked KiwiRail whether triple-tracking could enable non-stop rail
services between a hypothetical Paerata city and the CBD. KiwiRail
advised the four-tracking would be required. This would come with
the added benefit of separating rail freight and commuter services.
KiwiRail estimates the cost of four-tracking between Papakura and
Westfield at around $1.5 billion (including work like a third trunk line
Westfield to Wiri which may proceed sooner). Four lanes exist north
of Westfield, though along separate lines. Non-stop services would
need to integrate with normal services beyond Westfield.
• Including grade separation
between Pukekohe and the CBD,
we sensitivity test an additional $2
billion rail cost from development at
Paerata.
MEETING AUCKLAND’S GROWTH CHALLENGE:
THE INNOVATION CITY
OCTOBER 2017 23You can also read