MEMORIAL UNIVERSITY WASTE AUDIT 2011-12 - St. John's Campus Toby Rowe, Sustainability Coordinator Memorial University Sustainability Office
←
→
Page content transcription
If your browser does not render page correctly, please read the page content below
MEMORIAL UNIVERSITY WASTE AUDIT 2011-12
                       St. John’s Campus
            Toby Rowe, Sustainability Coordinator
           Memorial University Sustainability Office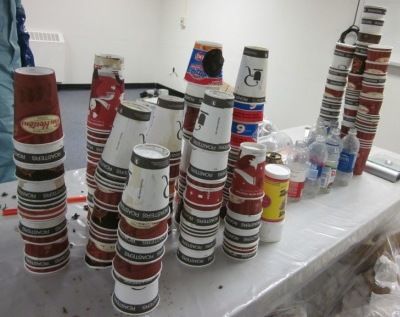
This research project was funded under the The Harris Centre – MMSB
Waste Management Applied Research Fund. The intellectual property
vests with the author(s). For more information about this Research Fund
to obtain hard copies of this report, please contact the Harris Centre.
Waste Audit 2011-12
                                                St. John’s Campus

Final Report
to Harris Centre MMSB
Waste Management
Applied Research Fund
June 2012

Submitted by:
Toby Rowe
Sustainability Coordinator
Memorial University Sustainability Office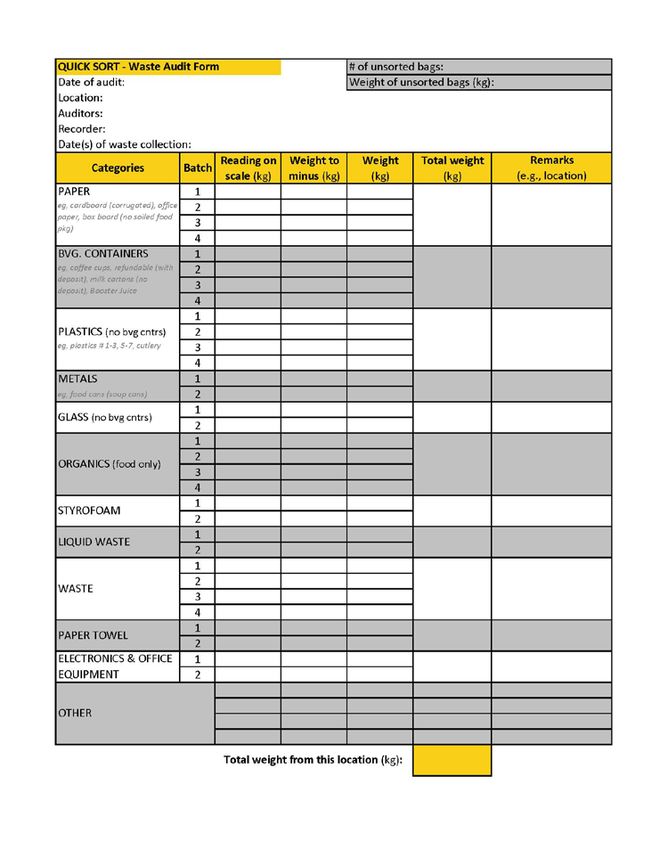
Waste Audit Team

       Sustainability Office staff: Nancy Burt, Toby Rowe
       Academic Advisor (Department of Geography): Dr. Ratana Chuenpagdee
       Administrator (Department of Geography): Pamela Murphy
       Audit Coordinators (students): Jennifer Broadbridge, Kevin Ma
       Audit Assistants (students): Sebastian Bilodeau, Kaan Eroglu, Andrew Flood, Adrienne Glover,
       Chad Hanlon, Aaron Lemkow, Chao Wang, Guang Yang

Acknowledgements

Special thanks to the Harris Centre MMSB Waste Management Applied Research Fund for providing
funding for the project and the Departments of Geography and Facilities Management for their support.

Thank you to the following Facilities Management staff for working through the process with us:
       Kent Budden, Donna Lawes, Rick Lawes, Jim McCrindle, Fred Tucker and a long list of
       custodians - Custodial Services
       Rodger Ludlow, Blair Morris, Robert Walsh, Randy White - Building Services and Grounds
       Rodney Shea, Geoff Sparkes - Central Stores

Thank you to the following for assisting with and/or providing advice to the project:
       Barbara Battcock, Donald Wood - Department of Health and Safety
       Jennifer Broadbridge, Emma Posluns and Bobbi Smith - students of Geography 6250
       Joe Carroll - QEII Library
       Theresa Doyle and Rhonda Valone - Registrar’s Office
       Kerry Hiscock - Earth Sciences building
       Philip Hunt - Chartwells-Compass Group Canada
       Shelley Pardy - City of St. John’s
       Dwayne Taverner and other staff - Housing, Food and Conference Services
       Harriett Taylor - Department of Geography
       Rosemary Thorne - Information Access and Privacy Protection Office
       Rhonda Tucker - Enterprise Risk Management
       Various staff and directors, Memorial University Students’ Union

Contact Information

Toby Rowe, Sustainability Coordinator
Sustainability Office
Department of Facilities Management
sustain@mun.ca
(709) 864-2637
www.mun.ca/sustain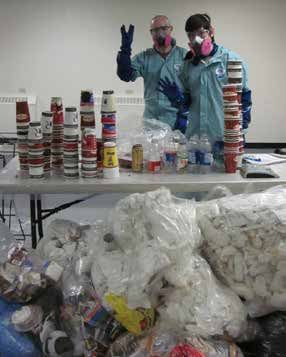
Memorial University Waste Audit 2011-12

Table of Contents

Summary .............................................................................................................................................................. 2
Introduction to the Report ..................................................................................................................................... 3
Method Overview ................................................................................................................................................. 4
Results ................................................................................................................................................................. 6
   Explanation of Audit Results ............................................................................................................................ 6
       Areas within Audit Locations ........................................................................................................................ 7
       Audit Categories ........................................................................................................................................... 8
   Results by Location .......................................................................................................................................... 9
       University Centre .......................................................................................................................................... 9
       Main Dining Hall (R. Gushue Hall) ............................................................................................................. 12
       Campus Childcare Centre .......................................................................................................................... 13
       Campus Childcare Centre (cont’d) ............................................................................................................. 14
       Arts and Administration .............................................................................................................................. 15
       Education ................................................................................................................................................... 16
       Engineering and Applied Science .............................................................................................................. 17
       Queen Elizabeth II Library .......................................................................................................................... 19
       Facilities Management ............................................................................................................................... 20
       Music .......................................................................................................................................................... 21
       Science ....................................................................................................................................................... 22
       Chemistry-Physics ...................................................................................................................................... 25
       Business Administration ............................................................................................................................. 26
       Burton’s Pond Apartments ......................................................................................................................... 27
   Overall Trends ................................................................................................................................................ 28
       Paper .......................................................................................................................................................... 28
       Paper Towel ............................................................................................................................................... 29
       Refundable Beverage Containers .............................................................................................................. 29
       Food Waste ................................................................................................................................................ 30
       Potential for Diversion into Current Recycling Stream ............................................................................... 31
Appendix A: Materials and Equipment, Method and Data Sheets for Audit Event ............................................. 32
Appendix B: Project Promotion .......................................................................................................................... 38

                                                                                                                                                                         1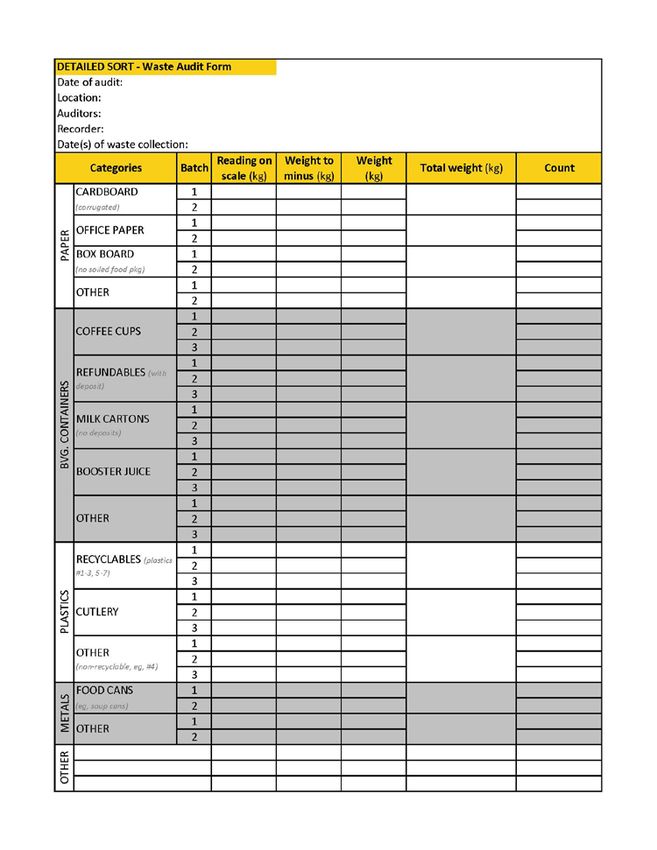
Memorial University Waste Audit 2011-12

Summary

From March 1, 2011 to March 30, 2012, the Sustainability Office, in partnership with the Department of
Geography, conducted waste audits of garbage from 13 locations on the St. John’s campus of Memorial
University. These audits were generally one-time events, providing a snapshot of the composition of garbage
collected from a given area. The composition of the garbage was determined through manual sorting into waste
categories and weighing these categories. This report presents the results by location (sub-divided into areas
where applicable) in waste categories by percentage of total weight.

Results for the audit revealed some general trends regarding what is being thrown in the garbage and
opportunities for waste diversion.

In office areas of nine of the buildings audited, more than 15 per cent of the garbage by weight was recyclable
paper. With increased awareness of the mandatory paper recycling program, this paper should be an easy target
for waste diversion.

Food waste made up over 20 per cent of the garbage in 10 locations. Two areas, the Main Dining Hall and the
Campus Childcare Centre, have been identified as good potential locations to reduce waste through composting
with over 40 per cent of garbage composed of food waste.

In public areas with bathrooms, paper towel made up more than 20 per cent of the garbage by weight in nine
buildings.

In high use areas that generate a lot of garbage, such as the library and the University Centre, and in Burton’s
Pond Apartments, there is a potential to increase refundable beverage container recycling.

Further data and information are required in order to estimate and interpret the potential for waste diversion on
the St. John’s campus and to make more recommendations on how waste management could be improved.

                                                                                                                        2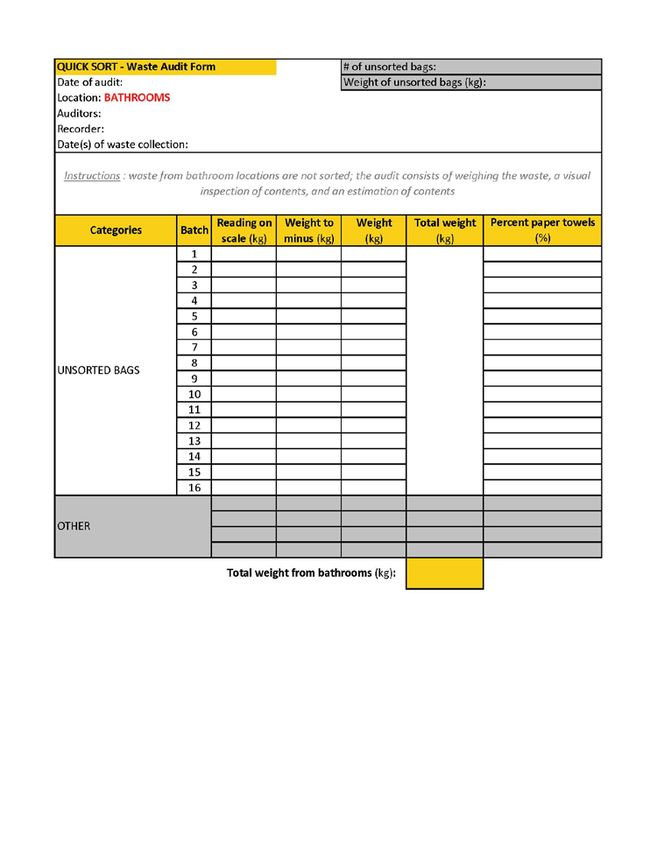
Memorial University Waste Audit 2011-12

Introduction to the Report

This is a report of results for the 13 locations that were audited during the project period with recommendations for further
work required in order to meet the objectives stated in the project proposal.

The objectives at the outset of the project were:
       To identify and quantify the composition and point of generation of garbage at the university
       To identify any additional opportunities for waste reduction and diversion which may exist at Memorial
       To determine how much of the waste being disposed as garbage consists of materials for which recycling
       programs currently exist at the university and thereby determine what programs need to be improved and/or better
       promoted
       To determine how much food waste is being disposed of in order to collect data required for a feasibility study on
       composting
       To determine the how much of waste being disposed of as garbage could be recycled if new recycling initiatives
       were put in place, and
       To create recommendations based on the waste audit data to improve the current system of waste management on
       campus and improve diversion rates.

Not all of the objectives were completed by the end of the funding period due to time constraints of the project (1 year
project length as required by the funder and audit schedule dictated by the school year) and due to the inability to obtain
data and information from other sources as required. As information is received, the objectives will be completed and
further recommendations will be developed.

While designing the audit method, audit reports from several universities were reviewed. Challenges related to doing such
a project in a university setting were generally not addressed in these reports. These potential barriers were not considered
when setting out the objectives of this audit, and made the management of the project and the collection of consistent data
challenging. Details and advice about the planning and administration of this audit that would be useful to other
institutions, to other Memorial campuses or for continuing audits of the St. John’s campus are available from the
Sustainability Office.

                                                                                                                                3
Memorial University Waste Audit 2011-12
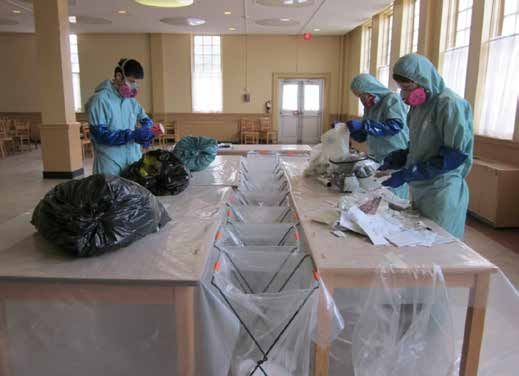
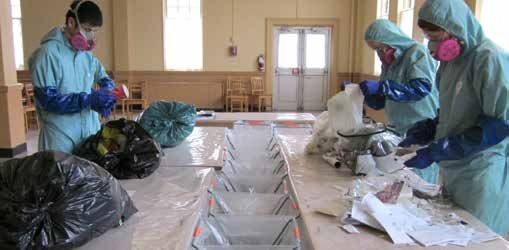
Method Overview
Phase 1: Planning the Audit Project
There were many components in planning this project including reviewing other audits, hiring student assistants,
developing the method and data sheets, obtaining the required materials and equipment, and communicating with various
departments and offices of the university. The following provides information on the main areas of planning; further
details are available from the Sustainability Office.
Facilities Management Consultations
The director of Facilities Management and the manager of Custodial Services were consulted early in the planning of the
audit to determine the level of support that could be provided. After being notified of the audit by the manager, all
custodial supervisors were contacted by the Sustainability Office to explain the purpose of the audit and to consult with
them on the process of garbage collection for each location being audited. Central Stores was consulted to determine what
equipment and materials could be ordered and what would need to be sourced externally.
Health and Safety
The Department of Health and Safety was consulted prior to the start of the audit and several times during the project. As
required by the Office of Research, the Department of Health and Safety was consulted to determine if the project
required a biohazard certificate (none required). Also, the department established the following safety requirements for
the audit:
Personal protective equipment for auditors as listed in the materials and equipment in Appendix A
Respiratory protection – fit tested respirators with cartridges to protect against particulate matter
Packaging of waste – plastic bottles and metal cans in plastic bags, glass waste in cardboard boxes with plastic
liners, chemicals in plastic pails, sharps container on site, unknown substances contact Dept. of Health and Safety,
food stuffs to be placed in plastic garbage bags
Vaccinations – tetanus shots for anyone that has not had a tetanus shot in 10 years
Decontamination – have custodial staff properly clean area before leaving
The audit coordinator and Sustainability Office staff were trained in first aid so that at least one person present at each
audit event had first aid training. (All auditors were required Safety to undergo Respirator Fit Training prior to taking part
in the project. The Department of Health and Safety required that all auditors undergo Respirator Fit Training prior to
taking part in the project.)
Contact information was obtained for the appropriate staff of Health and Safety in case chemical or biological waste was
found during the audit.
Privacy
Memorial’s Information Access and Privacy Protection Office was consulted to ensure personal privacy was not
compromised during the audit. The City of St. John’s and other universities that have conducted audits of student
residences were contacted to determine how they dealt with privacy concerns during audits. Concerning office waste,
privacy was not a great concern since there is recycling for office paper and anything confidential should be shredded.
Privacy was a concern for the audit of Burton’s Pond Apartments as the residents dispose of their personal garbage in the
dumpsters. Residents were notified of the audit through e-mail communication from the Department of Housing, Food
and Conference Services and posters in each building. All auditors signed a confidentiality form.
Risk Management
Memorial’s Enterprise Risk Management (ERM) was notified of the project prior to its start. The only requirement was
that volunteers helping with any audit event sign a waiver provided by ERM. This was only required for the launch of the
audit in March 2011 prior to student employees assisting with the audit.
4Memorial University Waste Audit 2011-12
Staffing and Support
In total, two Sustainability Office staff and 10 student research assistants (hired through the Department of Geography)
worked part-time on the audit from March 2011 to April 2012. The Sustainability Office coordinated the project including
recruiting staff, scheduling audit events and audit assistants, booking rooms, consulting with custodial and health and
safety staff, and ensuring supplies were purchased. The Department of Geography administered the funding and provided
academic oversight. The audit method was developed in part by students taking a graduate level geography course taught
by Dr. Ratana Chuenpagdee.
Two graduate students were audit coordinators at different times during the project. The audit coordinator worked with
the Sustainability Office to design the audit method and data forms, coordinated audit events, designated roles for the
audit assistants, and recorded and analyzed data. Five other students (undergraduate and graduate) worked solely on the
audit events: setting up, sorting the waste and cleaning up. Two graduate students worked on the audit events and
reviewed the data.
Phase 2: Planning an Audit for a Specific Location
Buildings on campus are divided into zones where garbage collection is the responsibility of different custodial
supervisors. As explained in the results section, the management and schedule of garbage collection varied by custodial
supervisor making it difficult to have one consistent process for each location.
For each audit location, several weeks prior to the desired audit date the custodial supervisor (and other staff as needed)
was contacted by the Sustainability Office:
- to determine a possible site in the building to sort the garbage and how to book that site (site requirements: no
carpet, moveable desks if in a classroom, windows that open),
- to discuss the garbage collection schedule for the building and the best typical day to collect garbage, and
- to determine if any specific issues might affect the audit.
Once a site was booked for a given date, audit assistants were notified and tables were ordered through Facilities
Management.
About one week prior to the audit, the following audit logistics were confirmed with the custodial supervisor:
- the schedule of garbage collection
- the placement of designated coloured bags in garbage containers in specific areas at the appropriate time prior to
the audit day
- the sites where garbage would be stored and sorted, and
- the name and contact number of the custodian scheduled to work during the audit.
Two days before the audit, all details were re-confirmed.
Phase 3: Conducting the Audit
The materials and equipment list, the audit method and data sheets are provided in Appendix A. For an average-size
building, five to six auditors were present plus the audit coordinator.
On the day of the audit, the custodial supervisor was contacted to confirm that the garbage had been collected as planned
from the designated areas.
5Memorial University Waste Audit 2011-12
Results
Explanation of Audit Results
The audits took place from March 2011 to March 2012 for 13 locations on the St. John’s campus (Table 1).
Table 1. Buildings audited during waste audit project.
Location Date Description of Waste Audited
Waste audit launch and testing method: food court only for short
8-Mar-11
period. Data not included in this report
University Centre Food court and public areas (no bathrooms) for 24 hour period,
5-Apr-11
some staff offices, student society offices
17-Jan-12 Food court and other public areas for 24 hour period
Main Dining Hall 29-Mar-11 Mar. 29 breakfast and lunch
(R. Gushue Hall) 30-Mar-11 Mar. 29 supper
5-Jul-11 Entire building for 24 hour period
Childcare Centre
7-Jul-11 Entire building for 24 hour period
Arts and
27-Sep-11 Public areas and classrooms for 24 hour period, some offices
Administration
Education 4-Oct-11 Public areas and classrooms for 24 hour period, offices
Engineering and 19-Oct-11 Public areas and classrooms for 24 hour period, offices
Applied Science 2-Nov-11 Engineering Café for 24 hour period
QEII Library 9-Nov-11 Public areas for 24 hour period and offices
Facilities Lunchrooms and public areas for 24 hour period, offices
22-Nov-11
Management
Music 22-Nov-11 Public areas and classrooms for 24 hour period, offices
Public areas, classrooms and teaching labs, Science Cafe for 24
Science 12-Jan-12
hour period, offices and research labs
Public areas, classrooms and teaching labs for 24 hour period,
Chemistry-Physics 25-Jan-12
offices and research labs
Business Public areas and classrooms for 24 hour period; office data not
15-Mar-12
Administration included due to scheduling problem
Burton’s Pond 26-Mar-12 Garbage bags taken from four dumpsters located outside of
Apartments 30-Mar-12 buildings
6Memorial University Waste Audit 2011-12
Explanation of Audit Results (cont’d)
The results are presented by location in order of date audited. The results show a snapshot of the composition of the
garbage in a particular location on a given day. Through consultation with custodial staff, typical days were selected
whenever possible. For example, garbage was not collected after a special event when there would be an abundance of
garbage related to the event. Unless otherwise noted in the results by location, the each location was audited one time and
all the garbage collected was sorted and weighed.
The results are provided in waste categories by percentage of total weight audited for each area audited in the location.
Not all charts (figures) are explained or referred to in the text as the charts are generally self-explanatory. A comparison of
locations by weight is not presented since different collection periods and dates affected the amount of garbage collected
for each audit.
For each location, information (“special considerations”) is provided that should be considered in interpreting the results.
Some locations will require further research and collection of data to focus on specific aspects of waste management. For
example, for the main dining hall, once data is received on the number of meals served each year, the total amount of food
waste could be estimated on an annual basis which would aid in the development of a composting program.
This audit did not include garbage placed directly in dumpsters (with the exception of Burton’s Pond apartments), large
items that would not be put in a garbage container in an office or public area, garbage collected from outdoor areas, or
construction waste put in temporary dumpsters on site or brought directly to the landfill.
Building occupants and users were not notified of the audit unless noted in the results. Custodial supervisors and
custodians were aware of the audit since they helped with the collection of garbage.
Areas within Audit Locations
For most locations, garbage was collected from three general areas: public areas/classrooms, bathrooms, and offices. If
there was a deviation from this, it is stated in the results section for the location. Public areas/classrooms and offices were
audited separate from each other due to different frequency of garbage collection and different primary user groups to
target for education and awareness programs. Bathroom garbage was collected in clear bags so that it could be assessed
visually and described without manually sorting. For some locations, food service areas were audited separately.
Public areas/classrooms are areas that have garbage collected daily and have a high rate of use by students in most
buildings. For some locations, daily collection also includes teaching laboratories, student or employee lunchrooms and
large general offices. These areas were audited for a 24-hour period.
Bathroom garbage is collected daily. Bathroom garbage was described only in terms of percentage of paper towel and
other waste. From the visual assessments, bathroom waste was considered to be on average 80 per cent paper towels and
20 per cent other waste.
Office garbage is generally collected weekly, however there are various collection schedules in different buildings making
it difficult to collect garbage from all offices of a given building for a defined period. Research laboratories were included
in the office garbage since they had weekly garbage collection.
For the results presented in this report, bathroom and food service areas are combined with public/classrooms unless
otherwise noted since those areas are collected daily. If there is any deviation from the areas and collection schedule as
described above, it is noted in the results for a given location.
7Memorial University Waste Audit 2011-12
Audit Categories
As seen on the Waste Audit Form - Detailed Sort (Appendix A), garbage was sorted into several categories. These
categories were selected by considering the following: what materials are currently recycled on the St. John’s campus,
what materials could be recycled based on the City of St. John’s curbside recycling program, what materials are accepted
for recycling at the Robin Hood Bay Waste Management Site, what materials are compostable, and categories of waste
that could be reduced through behavior.
For the final results, some of the categories were combined. The final results include the categories described in Table 2.
Table 2. Description of audit categories as presented in results.
Category Name in Final Results Description Categories Included
Recyclable paper All paper accepted through paper Office paper, box board, other
recycling program on campus
Cardboard All cardboard accepted through Cardboard
cardboard recycling program on
campus
Refundable beverage containers Refundable beverage containers that Refundable beverage containers
are currently recycled on campus
Non-refundable beverage containers Beverage containers that are not Coffee cups, milk cartons, Booster
recyclable or not being recycled on Juice, other beverage containers (eg.
campus paper and Styrofoam cups)
Recyclable plastic Plastics that are currently recycled by Plastic containers #1-7
City of St. John’s curbside program,
but not currently recycled on campus
Non-recyclable plastic Plastics that are not accepted by City Cutlery, other (plastic bags, plastic
of St. John’s curbside recycling wrap, etc.)
program including plastic wrap and
bags
Metals All metals including metal that is Food cans, other
currently recycled on campus
Organics All food waste (includes meat and Organics
vegetable products, cooked or raw)
Paper Towel Commercial-type paper towels Paper towel and 80% of bathroom
provided in most bathrooms, waste (unless otherwise stated)
lunchrooms/kitchens on campus
Waste Any waste that is not part of any of the Waste, Styrofoam, glass (other than
other audit categories including refundable beverage containers),
packaging contaminated by food liquid waste
waste combined with the Styrofoam,
glass and liquid waste categories
Electronics and Office Items included cables, batteries, pens, Electronics and Office
CD’s, printer cartridges, etc.
8Memorial University Waste Audit 2011-12
Results by Location
University Centre
Description of location: The University Centre contains public areas including a food court, administrative offices and a
medical clinic, retail and meeting spaces, student union and student society offices, and the Breezeway Bar. It has high
use by students.
Audit period: The centre was audited three times. The first audit was in March 2011 for the launch of the waste audit
during Sustainability Week. It was used to promote the project and refine the sorting method so the results are not
presented here. A second audit was conducted in April 2011, prior to the end of classes, and before new recycling bins
were installed. A third audit was conducted in January 2012 after new recycling bins (September 2011) and signage
(November 2011) had been installed. The office audit is for a portion of the offices in the building for a period of
approximately one week.
Special considerations:
- Although classes were still in session during the April 2011 audit, a custodian estimated that the volume of
garbage was about 40% less than during peak student use.
- For the April 2011 audit (Figure 1), paper towels were not considered as a separate category; they were included
with the waste category. Also, bathroom garbage was not collected due to miscommunication. In January 2012
(Figure 2), bathroom garbage was collected. Bathroom garbage has been removed from Figure 2 to compare the
results from the food court and public areas for April 2011and January 2012.
- Due to large amount of garbage collected for the January 2012 audit of public areas (Figure 3), only one third of
the waste was sorted.
- Food vendors and the Breezeway Bar were not included in the audits since their garbage is not collected by
custodians.
- Audits were done before and after installation of recycling bins and signage. From these results, the installation of
new containers and signage seems to have little or no effect on the amount of recyclable materials in the garbage
(comparison of Figure 1 and 2).
Figure 1. Composition of garbage collected from food court and public areas (not including bathrooms) for 24
hours in the University Centre on April 5, 2011.
2.0% 0.4%
2.9%
Recyclable paper
8.2% 1.7%
Cardboard
Refundable bvg.
38.7% 7.5% Non-refundable bvg.
1.1%
Recyclable plastic
Non-recyclable plastic
Metals
Organics
37.3%
Waste
9Memorial University Waste Audit 2011-12
University Centre (cont’d)
Figure 2. Composition of garbage collected from food court and public areas (not including bathrooms) for 24
hours in University Centre on Jan. 17, 2012.
Recyclable paper
1.1%
10.8% Cardboard
3.5%
Refundable bvg.
28.0%
Non-refundable bvg.
7.2%
2.3% Recyclable plastic
Non-recyclable plastic
5.5% 10.6%
Metals
Organics
0.3% Paper towel
30.5%
Waste
Figure 3. Composition of garbage collected from food court and public areas (including bathrooms) for 24 hours
in University Centre on Jan. 17, 2012.
0.9% Recyclable paper
2.8%
8.6% Cardboard
Refundable bvg.
26.3% 5.7% 1.8%
Non-refundable bvg.
Recyclable plastic
8.4%
Non-recyclable plastic
0.2%
Metals
20.9%
Organics
24.2%
Paper towel
Waste
10Memorial University Waste Audit 2011-12
University Centre (cont’d)
Figure 4. Composition of garbage collected from offices in University Centre on Jan. 17, 2012.
4.0% Recyclable paper
Cardboard
Refundable bvg.
22.2%
17.8% Non-refundable bvg.
Recyclable plastic
2.1%
8.4% 2.7% Non-recyclable plastic
5.3% Metals
Organics
21.7% 3.3% Paper towel
11.9%
Waste
0.6% Electronics & office
11Memorial University Waste Audit 2011-12
Main Dining Hall (R. Gushue Hall)
Description of location: The Dining Hall is used primarily by students living in residence (Paton College) and some
residents of Burton’s Pond Apartments. The set-up of the dining hall is all-you-can-eat, buffet style, with some areas
where food is served to the customers. The dining hall is trayless meaning that users must carry their food and drinks
without the help of a tray. This is an initiative to encourage less food wastage.
Audit period: Results are based on 24 hour period in the dining hall including breakfast, lunch and supper.
Communications with staff confirmed that the number of diners at each meal was a typical number.
Audit areas: The audit included anything placed in garbage containers in the dining hall, and food and other waste that
were left on customers’ plates once they had finished eating. Normally, the food waste left on plates is put into a
garburator, however for the purpose of this audit; the food waste was collected in containers. It did not include food waste
left over from the preparation of food (the food service provider collected this data) or food containers disposed of in the
kitchen.
Special considerations:
- Kitchen staff were aware of the audit since they were required to collect food waste from plates; students and
other diners were not aware of the audit.
- The paper towel category includes napkins which are 100% recycled content and could possibly be composted.
- Additional data has been requested from the food service provider on how much food waste is collected in the
kitchen and number of meals served annually.
- Although the food containers disposed of in the kitchen were not included (kitchen waste was disposed of
separately), this information should be available from food service provider based on types and amounts of
products purchased. These containers could potentially be recycled if a program were put in place.
- There have been discussions about the potential of starting a composting program on the St. John’s campus. This
audit was completed to help estimate the amount of food waste and other compostable materials disposed of at the
dining hall. This data will help determine what capacity would be needed for a composting program, and how
much diversion could occur from the dining hall’s garbage.
- The dining hall is a good candidate for on-site composting and expanded recycling programs due to the presence
of a kitchen where meals are prepared daily, the availability of areas to wash recyclable containers, and the
importance of educating students about these initiatives.
Figure 5. Composition of garbage collected for 24 hours from Main Dining Hall on March 29, 2012.
0.7% 0.1% 0.4%
4.3%
0.2%
6.4%
Recyclable paper
Non-refundable bvg.
Non-recyclable plastic
Metals
Organics
Paper towel
88.0% Waste
12Memorial University Waste Audit 2011-12
Campus Childcare Centre
Description of location: The Childcare Centre provided over 160 full time equivalent spaces for children aged 2 to 12 at
the time of the audit. Each day, two snacks and lunch are provided to the children. Most food is prepared in the kitchen at
the centre. Some food arrives at the centre partially prepared (for example, peeled carrots). Staff members have a staff
room where they can eat lunch. The centre is at full capacity year-round.
Audit period: The centre was audited for two 24 hour periods. The results for the two days were combined to provide an
average 24 hour period.
Audit areas: The audit was divided into two areas:
- kitchen
- children’s centres, offices and staff room (includes bathrooms)
Special considerations:
- Staff of the Childcare Centre were notified of the audit in advance so that they could separate food waste.
- There was a weekly food shipment received on the first day of the audit creating a large amount of cardboard on
that day. Although cardboard is recycled at Memorial, communications with a custodian revealed that at the time
of the audit, cardboard was not being recycled from the Childcare Centre.
- Much of the paper that was in the garbage had been used for arts and crafts and was therefore categorized as
waste instead of recyclable paper due to the presence of paint, glue, shiny paper, etc.
- Much of the paper used at the centre for arts and crafts is office paper already used on one side that has been
discarded by other offices on campus.
- Since all of the areas were collected for a known period (24 hour), the results could be combined to provide
results for the whole building (Figure 8).
- The centre is a good candidate for on-site composting and expanded recycling programs due to the presence of a
kitchen where meals are prepared daily, the availability of areas to wash recyclable containers, and the importance
of educating children about these initiatives
- In Figures 7 and 8, the paper towel category included diapers which contributed to the high weight.
Figure 6. Composition of garbage collected from kitchen area of Childcare Centre on July 5 and 7, 2011. Results
collected for two-24 hour periods were averaged to reflect a 24 hour period.
3.2% 0.5%
Recyclable paper
Cardboard
28.3%
Non-refundable bvg.
Recyclable plastic
Non-recyclable plastic
59.2% Metals
3.7%
1.1% Organics
2.0% Paper towel
1.9%
13Memorial University Waste Audit 2011-12
Campus Childcare Centre (cont’d)
Figure 7. Composition of garbage collected from children’s centres, offices and staff room of Childcare Centre on
July 5 and 7, 2011. Results collected for two-24 hour periods were averaged to reflect a 24 hour period.
3.5%
0.1% 1.7% Recyclable paper
5.6% 5.9%
3.6% Cardboard
Refundable bvg.
Non-refundable bvg.
11.0%
Recyclable plastic
41.0% 0.5% Non-recyclable plastic
Metals
27.2% Organics
Paper towel
Waste
Figure 8. Composition of garbage collected from entire Childcare Centre on July 5 and 7, 2011. Results collected
for two-24 hour periods were averaged to reflect a 24 hour period.
3.2%
1.9% Recyclable paper
5.6%
8.4% 2.0% Cardboard
Non-refundable bvg.
5.9%
31.1% 1.0% Recyclable plastic
Non-recyclable plastic
Metals
Organics
40.8% Paper towel
Waste
14Memorial University Waste Audit 2011-12
Arts and Administration
Description of location: The Arts and Administration building contains staff and faculty offices, classrooms and lecture
halls, and a small take-out café in an open area.
Special considerations:
- Garbage collected from offices was for a period of approximately one week, but only some of the offices were
collected due to a rotating pick-up schedule therefore the sample size was small.
- The café was not audited separately; food is not prepared on site and there is no seating area.
Figure 9. Composition of garbage collected from public areas/classrooms in Arts and Administration building for
24 hour period on September 27, 2011.
1.5%
1.3% 4.1% Recyclable paper
0.6%
Cardboard
9.6% Refundable bvg.
21.1% 3.2% Non-refundable bvg.
Recyclable plastic
6.5%
0.3% Non-recyclable plastic
Metals
21.5% Organics
30.4%
Paper towel
Waste
Electronics & office
Figure 10. Composition of garbage collected from offices in Arts and Administration building on
September 27, 2011.
0.6% 1.7%
Recyclable paper
Cardboard
15.3% Refundable bvg.
2.1%
20.8% Non-refundable bvg.
3.4%
Recyclable plastic
8.3% Non-recyclable plastic
8.1%
Metals
5.9%
Organics
23.5% 9.8% Paper towel
Waste
0.6% Electronics & office
15Memorial University Waste Audit 2011-12
Education
Description of location: The Education building contains staff and faculty offices, classrooms and lecture halls, and a
small take-out café with some seating.
Special considerations:
- Garbage collected from offices was for a period of 3 to 7 days due to office waste being picked up on different
days.
- The garbage in the café is collected and put directly outside in a dumpster by café staff. This waste was not
included in the audit.
Figure 11. Composition of garbage collected from public areas and classrooms in Education building for 24 hour
period on October 4, 2011.
1.8%
0.4% 4.4% Recyclable paper
2.5%
Cardboard
Refundable bvg.
25.0% 11.7% Non-refundable bvg.
2.1% Recyclable plastic
Non-recyclable plastic
13.3% Metals
Organics
28.4%
10.3% Paper towel
0.2%
Waste
Electronics & office
Figure 12. Composition of garbage collected from offices in Education building on October 4, 2011.
1.8% Recyclable paper
Cardboard
9.2%
17.8% Refundable bvg.
2.3% Non-refundable bvg.
15.7% 1.9% Recyclable plastic
Non-recyclable plastic
8.6%
Metals
10.3%
Organics
4.4%
13.6% Paper towel
13.4%
Waste
0.9% Electronics & office
16Memorial University Waste Audit 2011-12
Engineering and Applied Science
Description of location: The Engineering building contains staff and faculty offices, classrooms, labs and lecture halls,
and a cafeteria.
Audit areas: The Engineering Cafeteria was audited separately from the other areas.
Special considerations:
- The Engineering Cafeteria was audited separately to determine if it creates a large amount of food waste and
would be a candidate for a potential composting program. The results are presented separately in Figure 15 and
combined with the public/classroom and bathroom in Figure 16.
Figure 13. Composition of garbage collected from public areas and classrooms in Engineering building for 24
hour period on October 19, 2011.
2.5%
2.9%
7.4% Recyclable paper
Cardboard
23.8% Non-refundable bvg.
13.7%
Recyclable plastic
2.4% Non-recyclable plastic
Metals
8.3%
Organics
22.2%
Paper towel
14.4% 2.4%
Waste
Electronics & office
Figure 14. Composition of garbage collected from offices in Engineering building on October 19, 2011.
Recyclable paper
Cardboard
7.7%
1.6%
17.5% Refundable bvg.
0.5% Non-refundable bvg.
2.3% Recyclable plastic
27.0%
0.6% Non-recyclable plastic
Metals
22.0%
Organics
5.8%
Paper towel
10.8% Waste
4.1% Electronics & office
17Memorial University Waste Audit 2011-12
Engineering and Applied Science (cont’d)
Figure 15. Composition of garbage collected from Engineering Café for 24 hour period on November 2, 2011.
2.5% 3.0% 1.3% 0.4%
Recyclable paper
3.4%
1.5%
Cardboard
Refundable bvg.
Non-refundable bvg.
29.2% 14.4%
Recyclable plastic
0.7% Non-recyclable plastic
Metals
Organics
3.3% 40.4% Paper towel
Waste
Glass
Figure 16. Composition of garbage collected from public area/classrooms and Engineering Café in Engineering
building for 24 hour period on October 19 and November 2, 2011, respectively.
1.0%
1.5% 2.2% Recyclable paper
0.1%
5.7% Cardboard
Refundable bvg.
9.6%
26.0% 2.0% Non-refundable bvg.
Recyclable plastic
10.7% Non-recyclable plastic
Metals
1.7%
14.6% Organics
Paper towel
24.8%
Waste
Electronics & office
18Memorial University Waste Audit 2011-12
Queen Elizabeth II Library
Description of location: The library contains public areas used by a large number of students, and offices. The library
has long hours and allows food. At the time of the audit, there was no café in the library.
Special considerations:
- Employees of the building were notified of the audit in advance because of concerns by administration that they
needed to know that the loading bay was being used for the audit.
Figure 17. Composition of garbage collected from public areas in QEII Library for 24 hour period on
November 9, 2011.
0.5%
0.3% Recyclable paper
1.6%
Cardboard
8.4% 4.6%
Refundable bvg.
26.6% Non-refundable bvg.
10.3% Recyclable plastic
Non-recyclable plastic
2.5%
Metals
9.8%
Organics
18.6%
Paper towel
16.4% 0.4% Waste
Electronics & office
Figure 18. Composition of garbage collected from offices in QEII Library on November 9, 2011.
0.5% Recyclable paper
Cardboard
7.3%
Refundable bvg.
22.9%
Non-refundable bvg.
19.3%
Recyclable plastic
6.2% Non-recyclable plastic
0.9% Metals
9.6%
Organics
4.7%
Paper towel
12.0% 13.7% 1.4%
Waste
1.6% Electronics & office
19Memorial University Waste Audit 2011-12
Facilities Management
Description of location: The Facilities Management building houses several units of Facilities Management including
Campus Enforcement and Patrol, as well as Image Services of Marketing and Communications and a few other offices
external to Facilities Management. At the time of the audit, part of the ground floor of the building was vacant. Except for
one training room, there are no classrooms or public areas.
Audit period: Garbage collected in lunch rooms and bathrooms was for a 24 hour period.
Figure 19. Composition of garbage collected from lunch rooms and bathrooms in the Facilities Management
building for a 24 hour period on November 22, 2011.
5.1% 0.9%
0.3%
2.4% Recyclable paper
3.7%
12.3% Cardboard
Refundable bvg.
7.1%
Non-refundable bvg.
2.7%
Recyclable plastic
Non-recyclable plastic
34.4%
Metals
31.1% Organics
Paper towel
Waste
Figure 20. Composition of garbage collected from offices in the Facilities Management building on
November 22, 2011.
1.5% Recyclable paper
Cardboard
15.6% Refundable bvg.
2.0%
26.6% 1.1% Non-refundable bvg.
Recyclable plastic
12.6% Non-recyclable plastic
Metals
8.5%
Organics
3.8%
8.3% Paper towel
19.5%
Waste
0.6% Electronics & office
20Memorial University Waste Audit 2011-12
Music
Description of location: The Music building contains staff and faculty offices, classrooms, and lecture halls.
Special considerations: The Music building hosts many events and concerts where food and beverages are served
however there was none during the audit.
Figure 21. Composition of garbage collected from classrooms and public areas in the Music building for a 24
hour period on November 22, 2011.
4.7% 1.6% 3.7%
Recyclable paper
Cardboard
23.3% Refundable bvg.
9.1%
Non-refundable bvg.
3.5%
Recyclable plastic
8.7% Non-recyclable plastic
21.1% Metals
0.3% Organics
23.8% Paper towel
Waste
Figure 22. Composition of garbage collected from offices in the Music building on November 22, 2011.
2.1% Recyclable paper
9.1%
19.9% Cardboard
Non-refundable bvg.
10.7%
Recyclable plastic
5.4% Non-recyclable plastic
15.9%
Organics
8.9%
Paper towel
6.7% Waste
21.3%
Electronics & office
21Memorial University Waste Audit 2011-12
Science
Description of location: The Science building contains staff and faculty offices, classrooms, research and teaching labs,
lecture halls, and a café with limited seating.
Audit Categories:
- The Science Café was audited separately from the other areas.
Special considerations:
- There were some communication issues with custodial staff prior to and during this audit. On the first planned
audit day, the garbage was thrown out by staff who were not aware of or forgot about the audit procedure. On the
day before garbage was collected for the audit, it was observed that some of the bathrooms and the hallways did
not have the appropriate coloured bags placed in the garbage containers. It is possible that some bags from these
areas were mixed in with the office bags that were collected in the regular black garbage bags.
- Biological waste (invertebrates frozen in ice and rocks) was found in the garbage collected from the
office/research lab area. Biological waste is not normally disposed of in the regular garbage. It was categorized as
waste in Figure 24 since there was no category for it. Due to the excessive weight of the biological waste, the
percentage of waste is very high compared to other locations. An assumption was made that the biological waste
was disposed of improperly or collected in error. Figure 25 shows the results with the biological waste removed.
Figure 23. Composition of garbage collected from public areas and classrooms in the Science building for a 24
hour period on January 12, 2012.
4.1% 1.4% 1.1%
3.1% 5.2% Recyclable paper
Cardboard
0.7%
Refundable bvg.
Non-refundable bvg.
8.3%
31.0% 0.1% Recyclable plastic
9.8% Non-recyclable plastic
Metals
Organics
Paper towel
35.0%
Waste
Electronics & office
22Memorial University Waste Audit 2011-12
Science (cont’d)
Figure 24. Composition of garbage collected from offices and research labs in the Science building on
January 12, 2012.
0.3% Recyclable paper
Cardboard
8.4%
14.9% Refundable bvg.
4.8%
Non-refundable bvg.
1.2%
Recyclable plastic
4.4%
Non-recyclable plastic
1.5%
42.5% Metals
9.4%
Organics
8.7% Paper towel
0.5%
Waste
3.3% Electronics & office
Figure 25. Composition of garbage collected from offices and research labs in the Science building on January
12, 2012 with biological waste removed.
0.3% Recyclable paper
Cardboard
11.6%
Refundable bvg.
20.5%
Non-refundable bvg.
Recyclable plastic
21.3% 6.5% Non-recyclable plastic
1.6% Metals
6.1%
Organics
Paper towel
4.6% 11.9% 12.9% 2.1%
Waste
0.7% Electronics & office
23Memorial University Waste Audit 2011-12
Figure 26. Composition of garbage collected from the Science Café for a 24 hour period on January 12, 2012.
1.4% 3.2%
0.1%
Recyclable paper
8.0% Cardboard
30.3% Refundable bvg.
10.5%
Non-refundable bvg.
Recyclable plastic
6.3%
Non-recyclable plastic
Organics
4.5%
Paper towel
35.7%
Waste
Figure 27. Composition of garbage collected from public areas, classrooms, teaching labs and the Science Café
for a 24 hour period on January 12, 2012.
2.6% 1.7%
3.7% Recyclable paper
1.0% 5.7%
Cardboard
2.3%
Refundable bvg.
Non-refundable bvg.
30.9% 8.0%
0.1% Recyclable plastic
Non-recyclable plastic
14.1% Metals
Organics
Paper towel
29.9% Waste
Electronics & office
24Memorial University Waste Audit 2011-12
Chemistry-Physics
Description of location: The Chemistry building contains staff and faculty offices, classrooms, research and teaching
labs, and lecture halls.
Special considerations:
- Chemical waste and sharps were found in garbage bags from offices/research labs. These items should have been
segregated and disposed of as hazardous waste as specified by the Department of Health and Safety. The manager
of Custodial Services and the custodial supervisor for the building were notified immediately of the findings. The
manager notified the Department of Health and Safety.
- The audit was done in a classroom during regular working hours. A phone call and e-mail were received by the
Sustainability Office from the Department of Chemistry listing several concerns about the audit.
Figure 28. Composition of garbage collected from classrooms and public areas in the Chemistry-Physics
building for a 24 hour period on January 25, 2012.
0.3% 1.6% Recyclable paper
Cardboard
10.8% 0.8%
4.9% Refundable bvg.
20.8%
1.4% Non-refundable bvg.
Recyclable plastic
8.6% Non-recyclable plastic
Metals
2.9%
Organics
36.4% 11.4%
Paper towel
Waste
Electronics & office
Figure 29. Composition of garbage collected from offices in the Chemistry-Physics building on January 25, 2012.
0.9% Recyclable paper
2.1% Cardboard
12.2% 1.5% Refundable bvg.
23.0% 3.9%
Non-refundable bvg.
2.4%
Recyclable plastic
Non-recyclable plastic
15.0% Metals
17.1%
Organics
Paper towel
20.9% 1.0% Waste
Electronics & office
25Memorial University Waste Audit 2011-12
Business Administration
Description of location: The Business building contains staff and faculty offices, classrooms, lecture halls and the
Gardiner Centre.
Special considerations:
- There was only one bag of garbage collected from offices on the audit day due to scheduling complications and a
snow storm the day before therefore there are no results for offices.
Figure 30. Composition of garbage collected from classrooms and public areas in the Business building for a 24
hour period on March 15, 2012.
2.9% 0.1%
Recyclable paper
3.7%
7.6% 2.3% Cardboard
Refundable bvg.
23.7% Non-refundable bvg.
9.3%
Recyclable plastic
2.2%
Non-recyclable plastic
10.3% Organics
Paper towel
26.7%
11.3% Waste
Electronics & office
Glass
26Memorial University Waste Audit 2011-12
Burton’s Pond Apartments
Description of location: Burton’s Pond Apartments consists of six buildings. Five of these buildings house students
including one building for families. The other building has offices, the campus food bank, a laundry area and recreational
space. There are five dumpsters outside of the buildings where residents bring their garbage at any time; there is no pick
up within the buildings by custodial staff. Apartments have kitchens and students can also choose to be part of the meal
plan at the dining hall and other locations on campus. Residents are able to recycle refundable beverage containers by
bringing them to Corte Real, the building housing the recreational space and laundry area. There is no pick-up in the
apartment buildings or curbside pick-up of recycling, however sometimes residents volunteer to collect recycling.
Audit period: Garbage was collected on two days at 9:30 am, prior to the contractor emptying the dumpsters. A sample
of five to six bags was collected from each dumpster on each audit day. The results for the two days were combined.
Special considerations:
- Since residents can place their waste in the dumpsters at any time, the audit cannot be used to show amount of
waste produced in a given period.
- Only a small sample of garbage was taken from the dumpsters. Data on the total weight of garbage collected by
trucks has been requested to estimate composition of a typical week of garbage.
- As these dumpsters are publicly accessible and not locked, there is the possibility that waste from outside of the
university is dumped there.
- Many bags in the dumpsters were broken open. Initially, this was thought to be from birds. On the first day of the
audit, only bags that were not broken open were selected. Upon reflection, it was thought that collecting some
open bags might be more accurate. On the second day of the audit, garbage was also collected from broken bags.
During the garbage collection, two people were seen taking beverage containers out of the dumpsters. One of
them said that the bags were ripped open from the collection of refundable beverage containers. By taking the
ripped open bags, the results may have been skewed to reflect fewer refundable beverage containers than actual.
When the two days were compared, there were a lot fewer beverage containers on the second day.
- There has been some consideration of starting a more thorough recycling program in Burton’s Pond. These results
will be provided to Facilities Management for review.
Figure 31. Composition of garbage collected from dumpsters outside Burton’s Pond apartments on March 26 and
March 30, 2012, averaged for the two collection periods.
2.8%
0.1%
Recyclable paper
3.2%
7.1% Cardboard
Refundable bvg.
9.9% Non-refundable bvg.
29.4%
Recyclable plastic
3.9%
2.9% Non-recyclable plastic
5.7% Metals
Organics
4.1% 3.1% Paper towel
27.8% Waste
Electronics & office
27Memorial University Waste Audit 2011-12
Overall Trends
Paper
Paper recycling in office areas has been on-going for several years at Memorial with legislation introduced in 2005
requiring that businesses and organizations with greater than 25 employees recycle paper. For employees, this is the
recycling program on campus with the least effort required. Small blue bins are located in most offices and are emptied by
custodial staff. Occupants of offices simply have to place paper in the blue bins. There are also large recycling bins in
hallways of some buildings and a paper recycling slot in the new waste/recycling containers in the University Centre.
In office areas of nine of the buildings audited, 15 per cent or more of the garbage by weight was recyclable paper (Table
3). The weight of the paper may have been higher due to some soiled or wet paper being included in the recyclable paper
category. This paper was included because had it not been placed in the garbage it would not have been soiled, and could
have been recycled.
Table 3. Percentage of recyclable paper in the garbage by location.
Percentage of Location
Paper by Weight
>10% Chemistry-Physics Public
Chemistry-Physics Offices
University Centre Public
>15% Arts and Administration Offices
Education Offices
Engineering Offices
Music Offices
Science Offices
>20% Facilities Management Offices
QEII Library Offices
University Centre Offices
The most obvious reason for a high percentage of paper in office garbage is that some employees are not placing paper in
the blue bins as required. In addition, there might be other factors contributing to these results:
- Lack of knowledge of types of paper acceptable in the blue bins. For example, boxboard (e.g. cereal and cracker
boxes) was categorized as recyclable paper in the audit as the paper recycling contractor said it is accepted. The
audit results show that, generally, boxboard is being disposed of as garbage in offices, however it only makes up a
small amount of the recyclable paper in the garbage compared to office paper.
- Lack of blue bins in office areas.
- Some custodial staff might be disposing of the contents of paper recycling bins as garbage (the Sustainability
office has received complaints in the past from occupants of one building). This could be due to contamination of
paper or other reasons.
Recommendations:
- Ask custodial staff for recommendations to increase paper recycling, for example locations where bins are
lacking.
- Have custodial supervisors remind custodial staff of the requirement to keep paper separate from the garbage.
- Provide information to employees about what is accepted in the blue bins and remind them that paper recycling is
mandatory.
28Memorial University Waste Audit 2011-12
Paper Towel
Paper towel is provided in most bathrooms and lunchrooms on campus. There were several areas (public areas with
bathrooms) where paper towel made up more than 30 per cent of the garbage by weight (Table 4). While paper towel is
not heavy itself, it is usually wet, adding to the weight.
Table 4. Percentage of paper towel in the garbage by location.
Percentage of Location
Paper Towel
by Weight
>10% Chemistry-Physics Offices
Education Offices
QEII Library Public
>20% Business Public
Education Public
Engineering Public (including café)
Music Public
University Centre Public including bathrooms
>30% Arts and Administration Public
Facilities Management Public
Science Public
Chemistry-Physics Public
Campus Childcare
Recommendations:
- For areas with a high percentage of paper towel waste and high overall output of garbage, determine the
feasibility of installing hand dryers. Determine if Memorial is interested in increasing use of hand dryers and if
they are being installed in new buildings. There is debate on whether paper towel or dryers are more sustainable
in an institutional setting.
- Determine if paper towels from bathrooms could be accepted in a composting program.
Refundable Beverage Containers
Burton’s Pond Apartments stands out as the audit location which had more than double the percentage of refundable
beverage containers (10 per cent) compared to other locations (less than five per cent in all other locations).
Even though the percentage by weight of beverage containers in most locations is not high, it is important to recycle as
many containers as possible since deposit refunds contribute to the Campus Food Bank and Ever Green Recycling. For
areas that have a high output of garbage on a daily basis (for example, the University Centre food court and the library),
diverting more beverage containers daily could have a large impact. Using the public area of the library as an example,
approximately 200 refundable beverage containers (equivalent to $10 in refunds) were found in the garbage in one day.
Since the library is open more than 300 days per year, the university could be contributing $1500 more to the food bank
annually (half of the $3000 in refunds goes to Evergreen Recycling), while diverting 60 000 containers from the garbage.
Recommendations:
- Improve the recycling system for beverage containers at Burton’s Pond Apartments.
- Target areas of high output of garbage for education to increase beverage container recycling.
29You can also read