MESOAMERICAN REEF REPORT CARD - 10 Years of Collaboration & Conservation - Healthy Reefs

Page created by Katherine Mack
 
CONTINUE READING
MESOAMERICAN REEF REPORT CARD - 10 Years of Collaboration & Conservation - Healthy Reefs
10 Years of Collaboration & Conservation

             MESOAMERICAN REEF
                   REPORT CARD
                                           AN EVALUATION OF ECOSYSTEM HEALTH
MESOAMERICAN REEF REPORT CARD - 10 Years of Collaboration & Conservation - Healthy Reefs
MESOAMERICAN REEF HEALTH
             REPORT CARD 2018
                                                                              1%
                                                                            VERY GOOD
                                                                     13%
                                                                     GOOD                 17%
                                                                                        CRITICAL
                               NORTHERN
                               QUINTANA                                   Meso-
                               ROO                                       American
                                                          32%
                                                                           Reef
                                                          FAIR           319 SITES
                                                                                            37%
                                                                                            POOR
                                                          1%
                                                     VERY GOOD
                                                   11%                                          12%
                                                   GOOD           22%                           GOOD           20%
                                                                  CRIT                                         CRIT
                            COZUMEL
                                          28%
                                                   Mexico                          29%
                                                                                                   Belize
                                          FAIR     134 SITES                       FAIR            94 SITES
                                                           38%                                          39%
                                                           POOR                                         POOR
Mexico           CENTRAL
                 QUINTANA
                 ROO                                                                                   6%
                                                                                           20%         CRIT
                                                                  30%                     GOOD
                                                                  CRIT
                                                                                                                  28%
                                                 Guatemala                                   Honduras             POOR
                                                    10 SITES                                       81 SITES
              SOUTHERN
              QUINTANA                      70%
                                            POOR
              ROO                                                                            46%
                                                                                              FAIR
                 BANCO
MESOAMERICAN REEF REPORT CARD - 10 Years of Collaboration & Conservation - Healthy Reefs
CHINCHORRO

                                                                                                                                                                                            Threshold Values for Indicators
                                                                                                                                                                                   (ASSIGNED THE HIGHEST RANK MEETING THESE MINIMUM VALUES)
                                                                         NORTHERN                                                                                                                                Fleshy          Herbivorous       Commercial
                                                                         BARRIER                                                                                               Grade         Coral Cover       Macroalgae           Fish              Fish
                                                                                                                                                                                                                 Cover            Biomass           Biomass

                                                                          TURNEFFE                                                                                           Very Good           40%                1%              3,290             1,620

                                                                                                                                                                               Good              20%                5%              2,740             1,210

                                                                                                                                                                                Fair             10%                12%             1,860              800

                                                                                                                                                                                Poor              5%                25%              990               390
                                                                                             LIGHTHOUSE                                                                       Critical           25%
MESOAMERICAN REEF REPORT CARD - 10 Years of Collaboration & Conservation - Healthy Reefs
SUBREGIONS

                                                                                                 l
                                                                                               ra r
                                                                                                ve
                                                                                                             Mac Fle
                                                                                                                ro           KEY FINDINGS

                                                                                                                  sh lga
                                                                                         CoCo

                                                                                                                    a
                                                                                                                    y e
                                                                                                                             Overall, the Mesoamerican
                                                                                                        RHI                  Reef is in ‘fair’ condition with
                                                                                                        2.8

                                                                                          H e r Fi

                                                                                                                       ial
                                                                                                                             a reef health index score of

                                                                                                                  s h e rc
                                                                                               bi
                                                                                             s h o ro             m

                                                                                                  v
                                                                                                        us   C o m Fi        2.8 out of 5.

                                                                                                                             We evaluated 319 sites for reef
                                                                                                                             condition, finding 1% very good,
                                                                                                                             13% good, 32% fair, 37% poor,
                                                                                                                             and 17% critical.

                                                                                                                             Reef health has improved from poor
                                                                                                                             in 2006 (2.3) to fair (2.8) in 2016,
                                                                                                                             as in 2014.

                                                                                                                             Honduras has the highest Reef Health
                                                                                                                             Index (3.0) followed by Belize and
                                                                                                                             Mexico (2.8) and Guatemala (2.0).

                                                                                                                             Three of the four indicators improved
                                                                                                                             over the decade, including coral cover
                                                                           Photo © Claudio Contreras Koob/ILCP               (18%), herbivorous fish (2,731 g/100m2)
                                                                                                                             and commercial fish (909g/100m2).

                                                                                                                             The only indicator with no improvement
                 A DECADE OF MAKING                                                                                          and a ‘poor’ ranking is fleshy macroalgae
                                                                                                                             now 23%—up from 12% in 2006.
                 A DIFFERENCE
                 The Mesoamerican Reef (MAR) supports our culture,                                                           The increase in coral cover included coral
                                                                                                                             species important for reef building and
                 fisheries, tourism, coastal protection and biodiversity.                                                    coastal protection.
                 The Healthy Reefs Initiative (HRI) collectively and
                 quantitatively assesses reef health and informs                                                             21% of corals bleached in 2015/16,
                                                                                                                             with no mortality noted, although
                 science-based management recommendations.
                                                                                                                             higher bleaching in 2017 is a concern.

                 Over the past 10 years, we have conducted rigorous science in support                                       Coral recruitment has remained stable,
                 of management. Our reliable measures of reef condition allow us to                                          but overabundant reef competitors are
                 identify the most urgent threats and responses. HRI training workshops                                      a concern.
                 continue to strengthen scientific capacity. Our partners are scaling-up and
                                                                                                                             We now have 47 marine protected
                 improving management in 47 MPAs spanning almost 60,000 km2. Through                                         areas, covering 57% of the territorial
                 our Regional Coral BleachWatch Network, we have quickly mobilized and                                       sea, but only 3% of the sea is fully
                 supported teams of partners across the region to monitor coral bleaching.                                   protected from fishing.

                 HRI convenes annual partner meetings, enabling us to achieve a common                                       Fully-protected replenishment zones
                 voice and collectively accelerate conservation action. Together, we have                                    (RZs) are working, with a doubling of
                 shaped policy, such as protecting herbivorous fish in 3 of 4 countries.                                     commercial fish over the past decade.
                                                                                                                             Big reproductive fish are primarily in the
                 It has been 20 years since the four country leaders signed the historic
                                                                                                                             RZs and are critical to replenishment.
                 Tulum Declaration, committing to protect the MAR’s shared resources.
                 Our science-based knowledge and collective management efforts                                               New management interventions are
                 need to be accelerated—particularly to reduce pollution and increase                                        being piloted to restore herbivory.
                                                                                                                             Stronger efforts are needed to
                 replenishment zones. Our 2018 Coral Reef Report Card includes a 10-year
                                                                                                                             reduce nutrient pollution to combat
                 perspective on reef health and conservation aimed to ensure our reefs will                                  macroalgae proliferation.
                 endure and thrive into the future.

                                                                                                                             Cover photo © Luciano Candisani/iLCP
             2
MESOAMERICAN REEF REPORT CARD - 10 Years of Collaboration & Conservation - Healthy Reefs
SUBREGIONS
                    REEF HEALTH BY SUBREGION AND COUNTRY
                                                                                                                          SUBREGIONAL ANALYSIS
                                                                                 NORTHERN
                                                                                 QUINTANA        Subregion /        RHI     # Sites    Live          Fleshy       Commercial       Herbivorous
                                                                                 ROO             Country                               Coral         Macroalgae   Fish             Fish
                                                                                                                                       (% cover)     (% cover)    (g/100m2)        (g/100m2)
             Reef Health Index (RHI)                                                             Nothern
                                                                                                                    2.5     47         17            22           665              2521
             by Subregion                                                                        Quintana Roo ▼

                  Very Good    4.3 – 5.0                                                         Cozumel            3.5     18         17            17           3,226 ●          2,851

                  Good         3.5 – 4.2                                                         Central
                                                                                                 Quintana Roo       2.3     40         13            26           988              1,555
                  Fair         2.7 – 3.4                                                         (Sian Ka’an) ▼
                  Poor         1.9 – 2.6
                                                                                                 Southern
                  Critical     1.0 – 1.8                                                                            2.3     22         18            24           572              1,738
                                                                                                 Quintana Roo
                                                                          COZUMEL
                                                                                                 Banco
                                                                                                                    2.8     7          11 ●          17           1,590            1,438
                                                                                                 Chinchorro

                                                                                                 MEXICO             2.8     134        15            23           1,139            2,092

                                                                                                 Nothern Barrier
      Mexico                                                                                     Complex
                                                                                                                    2.8     17         12            33 ●         1,194            3,104
                                                           CENTRAL
                                                           QUINTANA                              Central Barrier
                                                           ROO                                                      1.8     18         17            24           139              978
                                                                                                 Complex ▼

                                                                                                 Southern Barrier
                                                                                                                    3.8     13         12            22           2,002            4,194
                                                                                                 Complex ▲

                                                                                                 Turneffe           2.5     26         17            14 ●         585              2,063

                                                    SOUTHERN                                     Lighthouse
                                                                                                                    3.3     8          19            20           1,746            2,441
                                                    QUINTANA                                     Reef ▲
                                                    ROO
                                                                                                 Glover’s Reef ▲    2.3     12         16            18           363              2,173

                                                                                                 BELIZE             2.8     94         16            21           876              2,384
             CHETUMAL                                                                            GUATEMALA          2.0     10         27 ●          18           43 ●             433 ●
                              MAHAHUAL
                                                                                                 Coastal
                                                                                                                    2.8     20         23            28           452              2,976
                                                                                                 Honduras ▲
                                               BANCO
                                               CHINCHORRO
                                                                                                 Cayos Cochinos     2.8     11         16            26           683              5,662 ●

                                                                                                 Utila ▲            3.5     9          21            30           1,467            4,233
                                         NORTHERN
                                         BARRIER                                                 Roatan ▼           3.3     25         26            25           688              5,453

                                         TURNEFFE                                                Guanaja            2.8     16         19            31           481              4,138

      Belize                                                                                     HONDURAS           3.0     81         22            27           675              4474
                 BELIZE
                   CITY                                                                          Mesoamerican
                                                                                                                    2.8     319        18            23           909              2,731
                                                                                                 Reef
             CENTRAL
             BARRIER
                                                                                                ● Regional Best Values
                                                    LIGHTHOUSE                                  ● Regional Worst Values
                                                    REEF                                        ▲ Subregions that improved from 2015                                           SWAN ISLANDS
               DANGRIGA                                                                         ▼ Subregions that declined from 2015

                                                                                                    GUANAJA
                                           GLOVER’S
                                           REEF                                  ROATAN                                                            SINCE OUR                SUBREGIONS
                                                                                                                                                                  5/16      IMPROVED
                                                                                                                                                   2015
                                                                                                                                                                            SUBREGIONS
                                                            UTILA
                                                                                                                                                    REPORT
                                                                                                                                                                  4/16      DECLINED
                                        COASTAL
   PUNTA                  SOUTHERN     HONDURAS
   GORDA                   BARRIER                                                          CAYOS
                                                                                            COCHINOS

LIVINGSTON
                              PUERTO                TELA
                                                                      LA CEIBA
             PUERTO           CORTES                                                                                                                                           N
             BARRIOS
                                                                                                                                                             0              50               100km

      Guatemala                              Honduras

                                                                                                                                                   MESOAMERICAN REEF REPORT CARD 2018 | 3
MESOAMERICAN REEF REPORT CARD - 10 Years of Collaboration & Conservation - Healthy Reefs
CHANGES

          Photo © Pete Oxford/iLCP

                                       TEN YEARS OF CHANGE
                                       Analysis by country provides insight and a call to action                                                                                                                                       Legend: indicators
                                                                                                                                                                                                                                       over time at all sites

                                       The Reef Health Index improved from 2.3 to 2.8 over the past decade. Compared to global trends                                                                                                         Commercial Fish
                                                                                                                                                                                                                                              Herbivorous Fish
                                       of widespread reef decline, these encouraging results of recovery are a testament to the benefits                                                                                                      Coral
                                       of collaborative management. Each country’s unique history and management efforts affect the                                                                                                           Fleshy Macroalgae
                                                                                                                                                                                                                                       (#) Parentheses represent
                                       status of the four reef indicators. These trends are an urgent Call to Action for country specific                                                                                              number of sites surveyed

                                       management responses. Note different axis values.

                                              MEXICO                                                    BELIZE                                                   GUATEMALA                                          HONDURAS
                                       3500                                                30   2800                                                 30   1400                                             30   5600                                                 35
                                       3000                                                25   2400                                                 25   1200                                                  4900                                                 30
                                                                                                                                                                                                           25
                                                                                                                                                                                                                4200
              Fish Biomass (g/100m2)

                                       2500                                                     2000                                                      1000                                                                                                       25

                                                                                                                                                                                                                                                                          Percent Cover
                                                                                           20                                                        20                                                    20   3500
                                       2000                                                     1600                                                       800                                                                                                       20
                                                                                           15                                                        15                                                         2800
                                       1500                                                     1200                                                       600                                             15                                                        15
                                                                                                                                                                                                                2100
                                                                                           10                                                        10
                                       1000                                                      800                                                       400                                             10   1400                                                 10
                                       500                                                 5     400                                                 5     200                                                   700                                                 5
                                                                                                                                                                                                           5
                                         0                                                 0      0                                                  0       0                                                     0                                                 0
                                              2006 2009 2011 2014 2016                                   2006 2009 2011 2014 2016                                2006 2009 2011 2014 2016                               2006 2009 2011 2014 2016
                                              (121)       (48)   (63)      (86)    (134)                 (140)       (66)   (68)     (94)     (94)                (5)        (0)   (4)       (8)    (10)                 (60)      (16)     (58)       (60)   (81)

                                        Mexico shows a slow, steady                              In Belize, parrotfish biomass                             Coral cover is higher and                            In Honduras, relatively high coral
                                        increase in coral cover since 2005.                      continues to increase (post-                              macroalgae is lower, mainly due to                   cover has been stable or increasing
                                        Commercial fish biomass, highest                         protection), with the first                               the inclusion of newly discovered                    over the past decade. Commercial
                                        in the region, has fluctuated but                        indication of a slight decline in                         reefs influencing trends. With                       fish biomass has remained
                                        increased 140% over the past                             fleshy macroalgae noted this year.                        time and enforcement, the 2015                       constant, although the value is
                                        decade. Sustained enforcement                            Coral cover has varied year to year                       regulation protecting parrotfish                     poor and would benefit from more
                                        and more replenishment zones                             but has increased overall since                           should help reverse the decline in                   replenishment zones. Despite
                                        are needed. Fleshy macroalgae                            2006. Commercial fish biomass                             herbivorous fish. Commercial fish                    having the highest herbivorous fish
                                        remain an intensifying problem,                          has fluctuated over the past                              biomass is the lowest in the region,                 biomass, fleshy macroalgae is still
                                        with accelerated growth in the                           decade but generally increased.                           with a 95% decrease since 2006.                      the highest in the region.
                                        past two years.                                          Call to Actions: Increase replen-                         Call to Actions: Create replen-                      Call to Actions: Reduce contami-
                                        Call to Actions: Protect herbiv-                         ishment zones to 10% by 2018;                             ishment zones on reefs; restrict                     nants from land run-off, improve
                                        orous fish and improve sewage                            ban gill nets and fish traps.                             gillnets and trawling.                               sewage treatment and create
                                        treatment.                                                                                                                                                              more replenishment zones.

                                                  l          Mac Fle                                          l          Mac Fle                                     l          Mac Fle                                    l          Mac Fle
                                                ra r            ro                                          ra r            ro                                     ra r            ro                                    ra r            ro
                                                 ve                                                          ve                                                     ve                                                    ve
                                                                        sh lga

                                                                                                                                   sh lga

                                                                                                                                                                                         sh lga

                                                                                                                                                                                                                                                   sh lga
                                         CoCo

                                                                                                   CoCo

                                                                                                                                                             CoCo

                                                                                                                                                                                                                  CoCo

                                                          2016                                                        2016                                                   2016                                                  2016
                                                                          a

                                                                                                                                     a

                                                                                                                                                                                           a

                                                                                                                                                                                                                                                     a
                                                                          y e

                                                                                                                                     y e

                                                                                                                                                                                           y e

                                                                                                                                                                                                                                                     y e

                                                         RHI                                                         RHI                                                    RHI                                                   RHI
                                                         2.8                                                         2.8                                                    2.0                                                   3.0
                                          H e r Fi

                                                                                                       H e r Fi

                                                                                                                                                             H e r Fi

                                                                                                                                                                                                                  H e r Fi
                                                                           ial

                                                                                                                                      ial

                                                                                                                                                                                            ial

                                                                                                                                                                                                                                                      ial
                                                                        s h e rc

                                                                                                                                   s h e rc

                                                                                                                                                                                         s h e rc

                                                                                                                                                                                                                                                   s h e rc
                                               bi

                                                                                                            bi

                                                                                                                                                                  bi

                                                                                                                                                                                                                       bi

                                              s h o ro                m                                   s h o ro               m                               s h o ro               m                              s h o ro                 m
                                                  v

                                                                                                               v

                                                                                                                                                                     v

                                                                                                                                                                                                                          v

                                                         us      C o m Fi                                            us     C o m Fi                                        us     C o m Fi                                       us       C o m Fi

          4
MESOAMERICAN REEF REPORT CARD - 10 Years of Collaboration & Conservation - Healthy Reefs
CHANGES
                                                                         VALUE OF TIME SERIES DATA
                                                                         The country graphs (p. 4) include all available data
                                                                         from HRI and partners, with reef survey sites varying
                                                                         each sampling period depending on funding or other
                                                                         constraints. Below, we examine the same 104 sites
                                                                         Heathy Reefs Initiative monitored in both 2006 and
                                                                         2016. This perspective provides more confidence in
                                                                         specific changes for each indicator, although the results
                                                                         could be less representative of the region as a whole.

                                                                                                             COMPARISON OF 104 REPEATED SITES
                                                                                                                                     2006 MAR # of repeated sites surveyed: 104
A CLOSER LOOK AT KEY INDICATORS                                                                                                      2016 MX: 19 | BZ: 31 | GT: 4 | HN: 50

   Coral Cover | Corals recovering slowly                                                                                 25

                                                                                            % Coral Cover
                                                                                                                          20
Coral cover increased by 38% at these repeated sites, similar to the overall regional                                          2016 MAR AVG (17.7%)

dataset, with greater increases in Guatemala and Mexico. The inaugural 2006 survey                                        15
                                                                                                                               2006 MAR AVG (13.4%)
followed hurricane and bleaching damage. Given the slow growth rate of dominant                                           10

reef-building corals, we expected recovery to be slow. Even though coral bleaching
                                                                                                                           5
events are predicted to be more frequent, we look forward to continued gradual
                                                                                                                           0
increases in coral due to our management actions (see p. 6).                                                                       MEXICO              BELIZE   GUATEMALA   HONDURAS
                                                                                            % Fleshy Macroalgae

                                                                                                                          30
   Fleshy Macroalgae | New interventions needed
                                                                                                                          25
                                                                                                                               2016 MAR AVG (23.6%)
Fleshy macroalgal biomass has nearly doubled across the region, with significant                                          20

increases in all four countries. Given their rapid growth, fleshy macroalgae can quickly                                  15
                                                                                                                               2006 MAR AVG (12.7%)
overgrow a reef. Urgent actions are needed to reduce coastal and watershed nutrient                                       10

and sewage contamination, along with interventions to increase herbivory. If these                                         5

actions are taken, we expect a gradual algal reduction—if not, the proliferation will                                      0

continue (see p. 8).                                                                                                               MEXICO              BELIZE   GUATEMALA   HONDURAS

                                                                                                                        5000
                                                                                           Herbivorous Fish (g/100m2)

   Herbivorous Fish | Protection measures working                                                                       4500

                                                                                                                        4000

Herbivorous fish biomass varies reef to reef, yet has remained stable in the last                                       3500 2016 MAR AVG (3114.7 g/100m2)
                                                                                                                             2006 MAR AVG (3012.2 g/100m2)
                                                                                                                        3000
decade. The MAR-wide average shows a slow, but positive increase, likely due to
                                                                                                                        2500
management actions. Honduras has noticeably higher biomass. Parrotfish are now                                          2000

protected in Guatemala, Belize and the Bay Islands of Honduras, with efforts underway                                   1500

                                                                                                                        1000
in Mexico; thus, we expect their numbers to continue to increase (see p. 11).                                            500

                                                                                                                           0
                                                                                                                                   MEXICO             BELIZE    GUATEMALA   HONDURAS
   Commercial Fish | Declines of concern
                                                                                            Commercial Fish (g/100m2)

Commercial fish biomass declined 23% at these repeated sites, which do not include                                      1200

data from many protected replenishment zones (RZs). Guatemala had the greatest                                          1000
                                                                                                                               2006 MAR AVG (841.5 g/100m2)
decrease, while Mexico showed an increase, especially for snappers. This result                                          800
                                                                                                                               2016 MAR AVG (647.8 g/100m2)
differs from the overall increase found in the full analysis, because it includes fewer                                  600

RZs. This indicator is responsive to management, so adding more effectively managed                                      400

RZs will allow populations to increase in the future (see p. 11).                                                        200

                                                                                                                           0
                                                                                                                                   MEXICO              BELIZE   GUATEMALA   HONDURAS

                                                                                                                                             MESOAMERICAN REEF REPORT CARD 2018 | 5
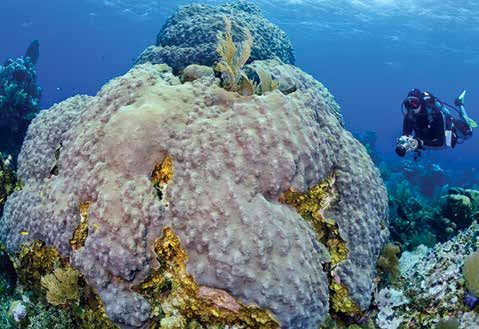
MESOAMERICAN REEF REPORT CARD - 10 Years of Collaboration & Conservation - Healthy Reefs
CORALS

                                                                                                                                BUILDERS OF REEFS
                                                                                                                                Not all corals are created equal, some coral species
                                                                                                                                construct the majority of the 3-D structure (reef-
                                                                                                                                builders); others contribute less (reef-contributors).
                                                                                                                                Coral cover has increased over the past 10 years,

                                                                                               Photo © José Alejandro Alvarez
                                                                                                                                but based on a subsample of 104 reefs resurveyed,
                                                                                                                                the ratio of reef-building to reef contributing corals
                                                                                                                                varies. Increases in reef-building coral cover occurred
                                                                                                                                in Mexico and Honduras, while increases in Belize and
                                                                                                                                Guatemala were due to non-reef building species.

             TINY CORAL ANIMALS BUILD MASSIVE REEF STRUCTURES. Reef-building
             corals, like this mountainous star coral in the Swan Islands, are keystone
             species—without them the system can collapse The ideal reef has enough                                                          PROTECT CORAL REFUGIA
             builders to continue positive net growth.
                                                                                                                                             Recovery of elkhorn (Acropora palmata) and staghorn
                                                                                                                                             (A. cervicornis) corals has been slow, compared to their
                                                                                                                                             rapid decline in the 1980s. Elkhorn corals were found
                                                                                                                                             at 14 of 104 sites and staghorn at 16, with increases
                                                                                                                                             in Mexico and Belize. The region’s largest elkhorn
                                                                                                                                             stand (35% cover), near Puerto Morelos, Mexico is
                                                                                                                                             threatened by coastal development. Unique, dense
                                                                                                                                             staghorn thickets are found in Cordelia Banks, Honduras.
                                                                                                                                             Mountainous star coral (Orbicella species) has suffered
                                                                                                                                             declines due to bleaching and disease. Star corals were
                                                                                                                                             found at 73 of 104 sites in 2016; Turneffe, Belize had
                                           Elkhorn coral (above)
                                                                                                                                             the site with the highest cover (18%). Orbicella declined
                                           and Staghorn coral (below)      Photo © Ken Marks/AGRRA
                                                                                                                                             overall in Honduras, likely resulting from its susceptibility
                                                                                                                                             to bleaching and disease. Lettuce coral (Undaria
                                                                                                                                             tenuifolia) are important reef builders in the MAR.
                                                                                                                                             Lettuce corals were found at 61 of the 104 sites; reefs
                                                                                                                                             in Bay Islands, Honduras had highest cover (10 to 35%).
                                                                                                                                             Recently, new reefs with abundant lettuce coral were
                                                                                                                                             discovered at Capiro Banks in Honduras (>50% cover)
                                                                                                                                             and on reefs of Cayman Crown (Guatemala/Belize).

                        Lettuce coral
                Photo © Ian Drysdale/HRI   Mountainous Star coral          Photo © Ken Marks/AGRRA

                        SHIFTING THE BALANCE:                                                                                                       100%

                                                                                                                                                    80%
                                                                                                                                Percent Cover (%)

                        PROMOTERS VS COMPETITORS                                                                                                    60%

                        Numerous plants and animals, on and inside the reef, compete for limited                                                    40%

                        benthic space. Corals, crustose coralline algae, and sparse turf algae                                                      20%
                        are “promoters” of reef growth; others are “competitors” capable of                                                          0%
                        overgrowing and displacing corals. The MAR has fewer promoters (43%)                                                               Mexico      Belize         Guatemala    Honduras

                        than competitors (57%), yet it varies by country. Fleshy macroalgae are the
                                                                                                                                     ■ LC – Live Cover                      ■ TAS – Turf Algal Sediment Mat
                        main competitor, but in Mexico dense algal turf mats that trap sediment                                      ■ TA – Turf Algae                      ■ CMA – Crustose Macroalgae
                        sometimes dominate. These are avoided by herbivorous fish but removed by                                     ■ CCA – Crustose Coralline Algae       ■ AINV – Aggressive Invertebrates
                                                                                                                                     ■ FMA – Fleshy Macroalgae              ■ Other
                        urchins. Thus, shifting the balance to more promoters may require a targeted
                        approach that selects the best herbivore for each site.                                                     For more: Lang et al 2016 (agrra.org/wp-content/uploads/2016/08/
                                                                                                                                    ICRS-poster-compact.pdf)
         6
MESOAMERICAN REEF REPORT CARD - 10 Years of Collaboration & Conservation - Healthy Reefs
CORALS
     REEFS IN A CHANGING SEA
     Continuous coral bleach events put MAR at high risk
     The Mesoamerican Reef has bleached at least seven times since
     1995. Coral bleaching is a general stress response where the coral
     expels its beneficial symbionts due to stress, such as elevated
     temperatures. Healthy Reefs led a regional Coral BleachWatch

                                                                                                               Photo © A. Tewfik / WCS
     in partnership with 19 partner organizations. Throughout the
     four countries, 68 sites were surveyed in 2015 and 107 in 2016,
     evaluating a total of 33,890 corals (photo at right).

                                                                                                    BLEACHING SEVERITY INDEX
     BLEACHING BUT NOT                                                                    90° W      89° W     88° W                     87° W       90° W   89° W       88° W      87° W

     MORTALITY IN 2015–16                                                                         2015                                                   2016
                                                                                         21° N
     The 2015/16 bleaching event moderately affected the MAR with 3% of
                                                                                                  36%                                                    49%
     corals fully bleached, 18% partially bleached and 22% pale. 2016 was                         CORALS                                                 CORALS
                                                                                                  AFFECTED                                               AFFECTED
                                                                                         20° N

     worse than 2015, with little to no recorded mortality.
                                                                                                     0 – 10
     Spatial patterns vary                                                                           10 – 15
                                                                                         19° N

                                                                                                     15 – 20
     Overall, bleaching was highest in Honduras (73%) then Mexico (47%),
                                                                                                     20 – 25
     Guatemala (33%) and Belize (23%). Bleaching also varied by habitat, from                        25 – 30
                                                                                                     30 – 35
                                                                                         18° N

     most to least affected: patch reefs > fore reef > back reef > reef flat.
                                                                                                     35 – 40
     Similarly, in 1998 the worst bleaching (with mortality) was in patch reefs.                     40 – 45
                                                                                                     45 – 50
                                                                                         17° N

     Susceptibility by species
     The most affected included slow-growing reef-builders (Orbicella spp,
                                                                                         16° N

     P. strigosa) and fast growing Undaria and Porites species. Environmental
     stressors, including temperature, light, and water motion, contributed to                    100km

     bleaching and affected species differently.
                                                                                         15° N

                                                                                                                                                                 1
                                                                                                                                                                     Muñiz-Castillo et al. in prep

    2016 DHW                                  2017 DHW                             TRACKING THE HEAT TO PREDICT
                                                                                   BLEACHING RISK
                                                                                   Our ability to respond to coral bleaching events has improved with advancements
                                                                                   in tracking tools. Degree Heating Weeks (DHW) are a measure of the severity and
                                                                                   length of heat stress—with severe bleaching occurring at >8DHW (orange) 2.
                                                                                   Each warm water event has affected the region differently. The past three years have
                                                                                   had increasing stress each year—but not surpassing the impacts of the 1998 event.
                                                                                   Coral bleaching events are predicted to increase in frequency and severity, with
                                                                                   bleaching events expected to occur in the MAR region on an annual basis by 2030–
                                                                                   20603. Restoring bleach-resistant corals is one component of reef restoration
                                                                                   programs currently underway—some of which actively seek to propagate more
                                                                                   resistant corals. Over 135,000 corals have been planted in the MAR to date.

www.coralreefwatch.noaa.gov/ 3van Hooidonk, R., et al (2015)
2

                                                                                                                                                 MESOAMERICAN REEF REPORT CARD 2018 | 7
MESOAMERICAN REEF REPORT CARD - 10 Years of Collaboration & Conservation - Healthy Reefs
MACROALGAE

                             WHAT CAUSES

                                                                                                                                                                                                  Photo © Nadia Bood / WWF
                                                                              Photo © Brian E. Lapointe
                             MACROALGAE
                             PROLIFERATION?
                             Macroalgae are plant-like marine
                             organisms that were historically in
                             rather low abundance on Caribbean                                            Excess Nutrients                            Habitat Destruction
                             reefs. Today most of these reefs are                                         Originating from inadequate                 Direct loss of mangroves
                             overrun with macroalgae, which out-                                          sewage treatment,                           and seagrass beds from
                             competes coral for space, reduces coral                                      agricultural and industrial                 coastal development and
                             recruitment success and inhibits coral                                       run-off, land clearing and                  related activities reduces the
                             growth. Fleshy macroalgae increased                                          coastal development                         capacity to absorb nutrients
                             from 12 to 23% over the past decade.                                         (including dredging).                       and other pollutants.

                     OUR REEFS NEED CLEANER WATER
                      & MORE HERBIVORES TO THRIVE                                                                                                     UNSUSTAINABLE FISHING
                                 Threats are from many sources
                                                                                                                                                      Years of over-fishing, illegal fishing, lack
                                                                                                                                                      of enforcement of existing regulations,
                                                                                                                     UNREGULATED                      and increasing demand have resulted in
                                                                                                                     COASTAL                          reductions or collapses of target species
                                                                                                                     DEVELOPMENT                      and increasing fishing of herbivorous fish.
                                                                                                                     The growing tourism industry
                                                                                                                     is increasing demand             60% 2016 Eco-Audit Score
                                                                                                                     for development. Poor
                                                                                                                     development practices            POOR WATERSHED MANAGEMENT
                                                                                                                     destroy mangroves,
                                                                                                                                                      Central America’s rivers also carry high loads
                                                                                                                     seagrasses, wetlands,
                                                                                                                                                      of nutrients, contaminants and sediments
                                                                                                                     and beach dunes. These
                                                                                                                                                      into coastal waters, caused by poor
                                                                                                                     ecosystems normally filter
                                                                                                                                                      agricultural and land management practices.
                                                                                                                     nutrients and pathogens
                                                                                                                     before they reach coral reefs.
                 INADEQUATE SEWAGE                                                                                                                    60% 2016 Eco-Audit Score
                 AND WASTE CONTROL
                                                                                                                     2016 Eco-Audit Score
                                                                                                                                                                      See full Eco-Audit details at:
                 Poor sewage treatment                                                                               70% CZM Planning                         http://eco-audits.healthyreefs.org/
                 releases more nutrients and                                                                         50% Mangrove Protection
                 pathogens which filter through
                 porous limestone, causing algal
                 blooms and diseases that harm
                 coral reefs. Poor solid waste
                 disposal results in chemical
                 contaminants and trash
                 pollution, particularly plastics.
                                                                                                                      ROOT PROBLEMS
                 46% 2016 Eco-Audit Score                                                                             Lack of regulation enforcement, increasing human population (including
                                                                                                                      tourists) and demand for resources are underlying problems in all issues.

                             MANAGEMENT INTERVENTIONS
                             Reducing nutrient pollution + increasing herbivory = Healthier Reefs
                             The excessive nutrient contamination in the MAR, overfishing of herbivorous fish and the current low
                             abundance of other herbivores has allowed macroalgae to grow unimpeded. We URGENTLY need to REDUCE
                             nutrient pollution and INCREASE herbivory. We also require more consistent, comprehensive water quality
                             monitoring in order to better understand and correct this problem.
             8
MACROALGAE
       RESTORE KEY HERBIVORES TO REDUCE MACROALGAE
       HRI and partners are continuing efforts to have region-wide protection of parrotfish, while also beginning pilot
       projects to evaluate the potential for restoring urchin and king crab populations in key protected areas, in order to
       restore herbivory and reduce macroalgae.

Photo © Brian Skerry/National Geographic                   Photo © callieoldfield               Photo © Michael Webster                  Photo © State of Hawaii DLNR

Protect Parrotfish                         Caribbean                                Long-spined Sea                       Reef Weeding
Our main efforts to increase
                                           King Crab                                Urchin (Diadema)                      Direct removal of
herbivory have focused on                  The importance of crabs in               In the 35 years since the             macroalgae by trained
protecting herbivorous fish.               controlling macroalgae has               mass mortality of Diadema             divers can jumpstart their
This was achieved in Belize                been largely overlooked.                 urchins, little natural               reduction, which can then be
(2009), Bay Islands, Honduras              Research in Florida has                  recovery has occurred in              maintained by more efficient
(2010) & Guatemala (2015).                 demonstrated crabs are                   the MAR (0.12 to 0.16/m      2
                                                                                                                          marine herbivores. In Hawaii,
Protection is being drafted                efficient herbivores. HRI and            from 2006 to 2016). HRI and           managers experimented
in Quintana Roo, Mexico,                   partners will implement a pilot          partners will study urchin            with a reef vacuum to
leaving the Caribbean coast                study and encourage private              larval recruitment, lab rearing       remove harmful algae. HRI
of Honduras as the only                    sector aquaculture, which could          and translocation techniques          and partners will implement
gap to achieving MAR-wide                  be a source for population               in an effort to aid their             a manual algal removal
protection.                                enhancement efforts.                     recovery.                             project next year.

       REDUCE NUTRIENT POLLUTION TO IMPROVE WATER QUALITY
       Improve Sewage Treatment                                                        Reduce Land-based Run-off
       Nutrient pollution is the key driver of macroalgae                              Reduce upstream sources of pollution (agriculture,
       proliferation. HRI continues our commitment to                                  livestock, urban/tourism, industrial, rural
       reduce the sources of nutrient pollution, including:                            deforestation) through better management
       • Work with regulatory agencies to reduce fecal bacteria                        practices, action plans and regulations in each sector.
          in sewage effluents to levels that comply with Class
          1 waters in the Cartagena Convention. Honduras is the                        Restore Natural Filtration
          only country yet to sign this convention and Belize is                       • Stop mangrove clearance by enforcing existing
          the only country that has fully ratified it.                                   regulations and prosecuting offenders.
       • Build or modernize treatment plants, strengthen                               • Prevent direct and indirect loss of seagrass from
          local water boards and assist residents in getting                             dredging operations.
          connected, as demonstrated in Roatan.                                        • Implement mangrove reforestation and seagrass
       • Explore new innovative technologies such as Omega                               restoration efforts.
          Global Initiative’s closed systems that turns sewage                         • Conduct pilot studies for enhancing populations of
          waste into biofuel, capturing CO2 (http://omegaglobal.org/).                   sponges, bivalves and other natural filtering species.

                                                                                                                          MESOAMERICAN REEF REPORT CARD 2018 | 9
MARINE PROTECTED AREAS
MPAs

                                                                                                                                   Over 50% of the MAR is now protected.
                              Marine Protected Area Statistics                                                                     Our region has excelled in creating and managing
                               MPA                                        Largest    Smallest
                Country        area
                                         RZs       TS Ter.    Number
                                                                            MPA        MPA                                         MPAs for 30 years. Our current focus is securing real
                                         Area       Sea        MPAs
                              (km2)                                        (km2)      (km2)
                                                                                                                                   protection through a network of connected, fully-
                Mexico*      19,625.9   798.5     20,172.8       18       11,070          2

                 Belize      4,009.7    582.0     18,658.6       17        1,192          4                                        protected replenishment zones (RZs). RZs are areas of
                Guatemala    1,063.8      2.2      1,559.7        2        1,026          38                                       the ocean protected from all extractive and destructive
                Honduras     9,572.8    482.1     19,564.2       10        6,449          15                                       activities. A well-designed and managed RZ network will
                  MAR        34,272.0   1,864.8   59,955.2       47          —            —
                                                                                                                                   enhance biodiversity, fisheries and livelihoods.
            TS: Territorial Sea | RZ: Replenishment Zone (no fishing)
            * Mexico includes only the portion of Mexican Caribbean Biosphere Reserve,
            the largest in the region, that is inside the TS. MPA statistics determined                                                             MPAs by Country and Year
            jointly by TNC, HRI and collaboration1.
                                                                                                                                    50
                                                                                                                                            2017
                                                                                                                                    45
                                                                                                                                            47 MPAs
                Mexico                                                                                                              40
                                                                                                                                            33,000 km2 protected
                                                                                                                                    35
                % T.SEA IN MPA

                97%                                                                                                                 30

                % T.SEA IN RZ                                                                                                       25

                4.0%                                                                                                                20
                % MATURE GROUPER*                                                                               2016 Eco-Audit2
                                                                                                                                    15
                35%                                                                                             70% MPA
                                                                                                            MANAGEMENT              10
                % MATURE SNAPPER*

                77%                                                                                                                  5

                                                                                                                                         1980     1985     1990      1995       2000      2005       2010   2015

                                                                                                                  MPAs
                                                                                                                  57%                                HON            GUA            BLZ               MEX

                            Belize                                                                                                       MPAs only work if well managed
                                                                                                                                         Enforcement Levels:
                            % T.SEA IN MPA
                                                                                                                                         13 good | 17 moderate | 17 inadequate
                            22%                                                                                     RZs                  * Based on the 2016 Eco-Audit
                            % T.SEA IN RZ                                                                           3%
                            3.1%                                                                                                                Nearly ALL big                  # of mature fish
                            % MATURE GROUPER*
                                                                                                                                                  fish found in                 per site:
                            26%                                                                                                                 replenishment                   1.4      outside MPAs
                            % MATURE SNAPPER*                                                                                                            zones                  1.5      inside MPAs
                            40%                                                                                                                                                 6.4      in RZs

                     Guatemala                                                                  Honduras
                      % T.SEA IN MPA               % MATURE GROUPER*                            % T.SEA IN MPA          % MATURE GROUPER*

                      68%                          3%                                           49%                     49%                                        Marine Protected Area
                      % T.SEA IN RZ                % MATURE SNAPPER*                            % T.SEA IN RZ           % MATURE SNAPPER*                          Replenishment Zones
                      0.1%                         10%                                          2.5%                    83%                                        Coral Reef
                                                                                                                                                            * Percent of fish of reproductive size
            1
             Just Released: “Biophysical Principles for Designing a Network of Replenishment Zones for the Mesoamerican Reef System”.                       (sexually mature) in 2016
            Download at healthyreefs.org/cms/mpa/ 2 http://eco-audits.healthyreefs.org/
       10
MPAs
          Fish Biomass (g/100m2)
                                                                                                                                                   91
                                                                                                                                                                       REPLENISHMENT
                                   3000                                                             3000                                    159
                                                                                                                                                                       ZONES ARE WORKING
                                                                                                                173
                                                                                                                                       64
                                                                                                                                                                       TO RESTORE
                                   2000
                                                                                            91
                                                                                                    2000              109

                                                                                                                            37
                                                                                                                                                                       POPULATIONS
                                                                                                                                                                       Our data clearly show fish have increased within the RZs
                                   1000                37                                           1000
                                                                                     159                                                                               in the past decade, but not in open fished areas. These
                                             173 109                         64
                                                                                                                                                                       RZs are replenishing some fishing areas, but 3% is not
                                                                                                                                                                       sufficient to reseed the remaining 97%. By increasing
                                    0                                                                 0
                                                                                                                                                                       the amount and monitoring the results, we can determine
                                                2006                                 2016                            2006                   2016

                                          COM ME RC IAL FIS H                                                   H E R B IVO RO US F I S H                              the optimal RZ design needed for an effective network
                                                                                                                                                                       that maximizes fisheries production and conservation.
       ZONE                         Fished             General Use Zone                                   No Fishing Zone # Sites surveyed

                                                                                                 RZs BENEFIT                                                   RZs BENEFIT                                        NO RZs
                                                                                                 COMMERCIAL FISH                                               HERBIVOROUS FISH                                   NO BENEFITS
                                                            Fish Biomass (g/100m2)

                                                                                      3000
     ACTIONS                                                                                                                     Mexico
                                                                                                                                       53
                                                                                                                                                        6000
                                                                                                                                                                                              Belize
                                                                                                                                                                                                           6000
                                                                                                                                                                                                                                     Guatemala

     FOR ENHANCING
                                                                                      2000
     OUR RZ NETWORK
                                                                                                                                                        4000                                       30      4000
     • Represent 20–30% of                                                                                      21                                                                 25
                                                                                                                                 56
       key habitat types in RZs                                                       1000                                                                                               34
                                                                                                                                                        2000       87 31    16                             2000
     • Reduce risk by                                                                                     63               25                                                                                                  4
                                                                                                                                                                                                                       1              7    3
       replicating RZs in                                                                           36
                                                                                            0                                                              0                                                  0
       each subregion
                                                                                                         2006                   2016                                 2006               2016                            2006           2016
     • Protect critical
       and unique areas                                                                          Mexico’s RZs are working, as shown by                         Belize fully protected herbivorous                 Guatemala’s decline in fish biomass
     • Incorporate                                                                               the significant increases in commercial                       fish in 2009, a global milestone                   corresponds to its lack of any
       connectivity among RZs                                                                    fish. RZs were established, enforced                          in ecosystem-based fisheries                       RZs in coral reef habitat to help
                                                                                                 and monitored in collaboration with local                     management. As a result, herbivorous               restore populations. Biomass values
     • Allow time for recovery
                                                                                                 fishers. While some poaching exists,                          fish have increased overall, particularly          are the lowest in the region. Urgent
                                                                                                 fisher patrols and tourism presence in                        inside the RZs. Some poaching                      action is needed to create RZs and
                                                                                                 other closed areas help deter poaching.                       outside of RZs still occurs and                    limit destructive fishing gear.
                                                                                                                                                               requires better enforcement.

                                                                                                                  BIG FISH HAVE                                                         69,830 fish counted in 148 sites
                                                                                                                                                                                        Over 88,800m2 • 13 tiger grouper
                                                                                                                  BIGGER RISK                                                           0 Goliath grouper (largest)
                                                                                                                  Different species of fish become mature (able to reproduce) at very different sizes
                                                                                                                  (ages). The larger fish are more likely to be overfished due to the time it takes to reach
                                                                                                                  maturity. Most of the reproductive fish surveyed were found inside the fully protected
                                                                                                                  replenishment zones. Bigger fish have more offspring, enhancing replenishment.
                                                                                                                 Snapper

                                                                                                                            15cm                    65cm                                            16cm          67.7cm
                                                                                                                                                                                         Grouper

                                                                                                                            Yellowtail              Cubera                                          Graysby       Black Grouper
                                                                                                                            407 fish                6 fish                                          457 fish      13 fish
                                                                                                                            86% mature              0% mature                                       29% mature    8% mature

                                                                                                                 Fish illustrations © Diane Peebles and © South Atlantic Fishery
Photo © A. Tewfik / WCS                                                                                          Management Council SAFMC (Graysby)                                                        MESOAMERICAN REEF REPORT CARD 2018 | 11
COLLABORATIONS

                          COLLABORATING FOR CONSERVATION
                          Healthy reefs are essential to sustaining our cultural identity, tourism-based
                          economies, traditional fisheries and our future.
                          HRI’s partners have ongoing conservation strategies aimed at sustaining fisheries and restoring the health
                          of the coral reef, seagrass and mangrove ecosystems that support them. Together, we are rebuilding reef
                          health through community-led management, reducing harmful fishing methods, and harmonizing fisheries
                          regulations. Transitioning fisheries toward sustainability will take time, but our collective efforts are already
                          having positive benefits for our communities and reef. The diagram below illustrates our key strategies to
                          restoring fish populations, with examples of success on the following page.

                                                                                                                        ACHIEVING MORE TOGETHER
                                                                                                                        Today 69 local, national and international conservation,
                                                                                                                        research, private and government agencies are
                                                                                                                        collaborating within the Healthy Reefs for Healthy
                                                                                                                        People Initiative—the first effort of its kind to
                                                                                                                        collectively and qualitatively assess reef health in
                                                                                                                        biennial Report Cards with science-based management
                                                                                             Photo © Ian Drysdale/HRI

                                                                                                                        recommendations, followed by Eco-Audits that track
                                                                                                                        their implementation. (Photo: Partners at our 5th
                                                                                                                        Regional Partner Meeting). www.healthyreefs.org

                                                                                                                                 RESTORING FISH
                                                                                                                              POPULATIONS IN THE MAR
                                                                                                                                  What we are doing to help bring fish back
                      Transboundary
                      collaboration

                                                                            Manage
                                             Provide alternative            access for
                                             incomes for fishers            all fisheries

                                                                                                                                                 Promote
                                 Involve and communicate                                                                                         sustainably
                                 with communities                                                                                                caught seafood

                                                                     Protect parrotfish
                                                                     and other grazers

                                                                                                                                    Conduct                                   Protect fish
                                                                                                                                    consistent                                spawning
                                                                                                                                    monitoring                                sites
                                                                                                                                    and research

                      Increase
                      Replenishment
                      Zones (no-fishing
                      zones)                                                                Safeguard critical
                                                                                            nursery and
                                                                                            feeding habitats

                 12
COLLABORATIONS
                                                           SUCCESS STORIES
                                                           BRINGING BACK OUR FISH                                                                                                          BZ

                                          MX

                                                                                                                                                                      Photo © Sergio Izquierdo/iLCP
                          Photo © Baruch Figueroa Zavala

                                                                                                      MX
                                                                                                                                                                                                                                                              BZ

                                                                                               Photo © COBI

                                                                                                                                                                                                                                        Photo © A. Tewfik / WCS
                                                           MARINE REFUGES IN AKUMAL                                                                                                                   MANAGING ACCESS TO
                                                                                                                                                                                                      EMPOWER FISHERS AS
                                                           In 2015, the Federal government
                                                                                                              PROTECTION OF NASSAU                                                                    STEWARDS
                                                           established the Fish Refuge Zone
                                                                                                              GROUPER IN SIAN KA’AN                                                                   In June 2016, Belize                                        SPAWNING FOR
                                                           in Akumal, comprising an area                                                                                                                                                                          SUSTAINABILITY
                                                                                                              In 2013, the first fish refuge                                                          inaugurated its national
                                                           of 9.88 km2—first refuge out of
                                                                                                              (4.28 km2) on a fish spawning                                                           managed access system,                                      Belize’s Spawning Aggregation
                                                           the limits of a natural protected
                                                                                                              aggregation in Mexico was                                                               ending open access fishing for                              (SPAG) Working Group has met
                                                           area. In 2016, the Refuge Area
                                                                                                              created in Sian Ka’an. In 2016, two                                                     its 3,000 fishers, now limited                              and monitored the 13 fully
                                                           for Aquatic Species Protection in
                                                                                                              15 km2 fish refuges were created.                                                       to 1 of 9 zones. Each zone is                               protected SPAG sites since
                                                           Akumal was decreed.
                                                                                                              All the known Nassau Grouper                                                            managed by elected fishers,                                 establishment in 2003. Several
                                                                                                              spawning sites in the Sian Ka´an                                                        increasing accountability, data                             of these SPAG sites have active
                                                                                                              region are now protected.                                                               availability, and incentives to                             enforcement and show signs
                                                                                                                                                                                                      reduce illegal fishing.                                     of recovery and fairly stable
                                                                                                                                                                                                                                                                  populations (1,000–3,000 fish).

                                                                                                                                                                                                                                                                             HN

                                                                                                                                                      HN

                                                                                                                                                                                                                                                                     Photo © CORAL
                                                                                                                                         Photo © Jorge Anariba

                                              GT
                          Photo © Manuel Ixquiac

                                                                                                                                                                 PRIVATE SECTOR PROVIDES
                                                                                                                                                                 A HELPING HAND                                                                                                      RIGHTS-BASED
                                                                                                                                                                                                                                                                                     FISHERY FIRST
                                                                                                                                                                 The private sector in Guanaja is helping                                                                            FOR HONDURAS
                                                           COLLABORATIVE AGREEMENTS FOR CLOSED FISHING                                                           manage fish replenishment zones. An                                                                                 In April 2017, three local
                                                           SEASONS GENERATE WIDER SUPPORT AND COMPLIANCE                                                         “Environmental Fund” was created through                                                                            communities near Tela
                                                           Since 2006, refining the closed season calendar has been one                                          a $10 voluntary donation from visitors,                                                                             agreed to implement
                                                           of the most dynamic, participatory and successful fisheries                                           resulting in 260 patrols, 150 children’s                                                                            a managed access
                                                           management tools in Guatemala. Fishermen, academics,                                                  environmental classes and 11,644                                                                                    fishery and have stricter
                                                           government and non-governmental organizations come together                                           mangrove seedlings being planted.                                                                                   regulations in Micos
                                                           to review and set the closures each year.
                                                                                                                                                                                                                                                                                     Lagoon. This is now the
                                                                                                                                                                                                                                                                                     first rights-based fishery
                GT                                                                                                  MOTAGUA RIVER FORUM: WORKING TOWARDS                                                                                                                             implemented in a coastal
                                                                                                                    THE PROTECTION OF NATURAL RESOURCES                                                                                                                              lagoon in Honduras.
Photo © Alfredo Barroso

                                                                                                                    Organizations are focusing on solutions to the political,
                                                                                                                    economic, social, cultural and environmental problems affecting
                                                                                                                    Izabal. A recent action will focus on diminishing solid waste
                                                                                                                    coming from the river to the ocean.
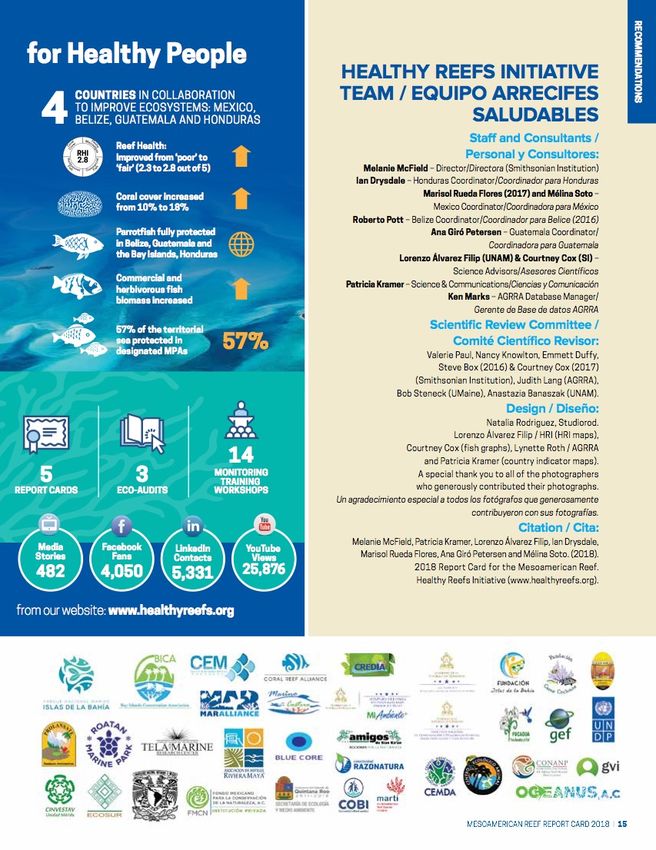
                                                                                                                                                                                                                                        MESOAMERICAN REEF REPORT CARD 2018 | 13
RECOMMENDATIONS

                                                                                                              Healthy Reefs
                       RECOMMENDATIONS

                                                                                                              10
                       HRI partners have recommended management solutions for over a                                  YEARS OF TEAMWORK,
                       decade. Some of the 28 actions measured in our Eco-Audits have                                 RESEARCH AND
                       been implemented fully, whereas some partially and others not at                               COLLABORATION
                       all. Overall, these recommendations have been 62% implemented,
                       across the 4 countries (see eco-audits.healthyreefs.org). This year
                                                                                                                        FIELD SURVEYS
                       we highlight these three top priorities for immediate action:
                                                                                                               854      ASSESSED
                       Marine Protected Areas
                       Increase the area under full protection to 20% by 2020.
                       Ecosystem-based Fisheries Management                                           267,501            FISH
                       Protect parrotfish throughout the entire Mesoamerican Reef.
                       Sanitation and Sewage Treatment
                       Demonstrate improvement in sewage treatment in at least one                       40,974          CORALS
                       additional location per country.

                                                                                                                         CORAL
                       RECOMENDACIONES                                                                        5,084      RECRUITS
                       Los socios de HRI han recomendado soluciones para mejorar
                                                                                                                         DIADEMA
                       la gestión durante más de una década. Algunas de las 28
                       acciones medidas en nuestros Informes de Avances han                                   6,729      URCHINS
                       sido implementadas completamente, mientras que algunas
                       parcialmente y otras no han sido implementadas. En general, estas
                       recomendaciones han sido implementadas en un 62%, en los
                       4 países (ver http://www.healthyreefs.org/cms/es/informe-de-          OUR PRODUCTS
                       avances/). Este año destacamos estas tres prioridades principales
                       que requieren acción inmediata:
                       Áreas Marinas Protegidas
                       Aumentar la cobertura de áreas protegidas en un 20% para el 2020.
                                                                                              DATABASE WITH       TRAINING OF
                       Gestión de Pesquerías
                       Basada en el Ecosistema                                                  256                181                    69
                                                                                                 USERS          FIELD BIOLOGISTS        PARTNERS
                       Proteger a los peces loro en todo el Arrecife Mesoamericano.
                       Saneamiento y Tratamiento
                       de Aguas Residuales
                       Demostrar mejoras en la calidad del agua asociadas con la                 MEDIA &                  Website
                                                                                                                                        Number of
                       mejora en el tratamiento de aguas residuales, en al menos un             OUTREACH                   Hits
                                                                                                                         (2011–2016)   Presentations
                       sitio adicional por país.
                                                                                                                        3,638,946         452

                                                                                             Download additional resources and spanish graphics

                  14
You can also read