Metal Ion Release from Engineered Stone Dust in Artificial Lysosomal Fluid-Variation with Time and Stone Type
←
→
Page content transcription
If your browser does not render page correctly, please read the page content below
International Journal of
               Environmental Research
               and Public Health

Article
Metal Ion Release from Engineered Stone Dust in Artificial
Lysosomal Fluid—Variation with Time and Stone Type
Preeti Maharjan, Joseph Crea, Michael Tkaczuk, Sharyn Gaskin                                and Dino Pisaniello *

                                            Adelaide Exposure Science and Health, School of Public Health, University of Adelaide,
                                            Adelaide, SA 5005, Australia; maharjanpreety@gmail.com (P.M.); joseph.crea@adelaide.edu.au (J.C.);
                                            michael.tkaczuk@adelaide.edu.au (M.T.); sharyn.gaskin@adelaide.edu.au (S.G.)
                                            * Correspondence: dino.pisaniello@adelaide.edu.au

                                            Abstract: Inhalational exposure to dust from engineered stone (ES), also known as artificial or com-
                                            posite stone, is associated with a specific disease profile, namely accelerated silicosis, and scleroderma.
                                            The pathogenic mechanisms are poorly understood, particularly the role of resin and metal ions.
                                            Metal ions are present in pigments and constituent minerals and may be considered potential contrib-
                                            utors to toxicity. The aim of this preliminary study was to understand the solubility of ES-containing
                                            metals in artificial lysosomal fluid (ALF) simulating the acidic intracellular environment of the lung
                                            macrophage lysosome. Differences with respect to ES types and temporal release were explored. Ten
                                            ES products of variable colour and company origin were comminuted and assessed for four different
                                            metals, solubilized into ALF solutions at 1,2,4 and 8 weeks at 37 ◦ C. There was significant variability
                                            in metal release, particularly with regard to iron and manganese, which could be correlated with the
                                  reflected brightness of the stone. A majority of the available Mn, Fe, Al and Ti was solubilized. Time
                                     trends for metal release varied with ES type but also with metal ion. The data suggest a high metal
Citation: Maharjan, P.; Crea, J.;           ion bioavailability once engulfed by lung macrophages. There is a need to investigate a wider range
Tkaczuk, M.; Gaskin, S.; Pisaniello, D.     of ES dust and relate metal content to markers of ES toxicity.
Metal Ion Release from Engineered
Stone Dust in Artificial Lysosomal          Keywords: engineered stone; artificial stone; metal ion; biosolubility; silicosis; artificial lysoso-
Fluid—Variation with Time and Stone         mal fluid
Type. Int. J. Environ. Res. Public Health
2021, 18, 6391. https://doi.org/
10.3390/ijerph18126391

                                            1. Introduction
Academic Editor: Annalisa Pinsino
                                                  Engineered stone (ES), also known as artificial stone, is a composite material primarily
                                            used in kitchens and bathrooms as an alternative to granite and other natural stone. The
Received: 27 April 2021
Accepted: 8 June 2021
                                            exposure of workers breathing ES dusts during cutting, grinding, and abrasive polishing
Published: 12 June 2021
                                            using power tools has been associated with accelerated silicosis, scleroderma, and upper
                                            respiratory diseases [1–3]. A high prevalence of a new form of silicosis associated with
Publisher’s Note: MDPI stays neutral
                                            extensive use of ES materials was first reported in Israel in 2006 [4], following which,
with regard to jurisdictional claims in
                                            Spain, Italy, Australia, and United States have also reported cases of accelerated silicosis
published maps and institutional affil-     related to ES [5–7]. In addition to the increased incidence, epidemiological studies also
iations.                                    suggest that the accelerated silicosis is associated with a comparatively rapid development
                                            of fibrosis, less exposure duration, a shorter latency period, and less visibility on X-ray
                                            and CT scan [7,8]. Although there has been significant progress in reducing inhalation
                                            dust hazards in Australian workplaces, preventable occupational lung diseases such as
Copyright: © 2021 by the authors.
                                            silicosis have re-emerged [5,9]. There is uncertainty about the incidence and prevalence
Licensee MDPI, Basel, Switzerland.
                                            of accelerated silicosis in Australia, partly due to the absence of a national dust disease
This article is an open access article
                                            registry, and voluntary reporting by treating physicians. Voluntary notifications to the
distributed under the terms and             Thoracic Society of Australia and New Zealand’s Occupational Lung Diseases Special
conditions of the Creative Commons          Interest Group identified seven ES-associated silicosis cases between 2011 and 2016 [5]. The
Attribution (CC BY) license (https://       median age of those reported cases was 43 years, and the median duration of exposure was
creativecommons.org/licenses/by/            only 7.3 years, representing an accelerated disease development among young workers.
4.0/).                                      A formal screening program in Queensland identified silicosis in more than 12% of ES

Int. J. Environ. Res. Public Health 2021, 18, 6391. https://doi.org/10.3390/ijerph18126391                      https://www.mdpi.com/journal/ijerph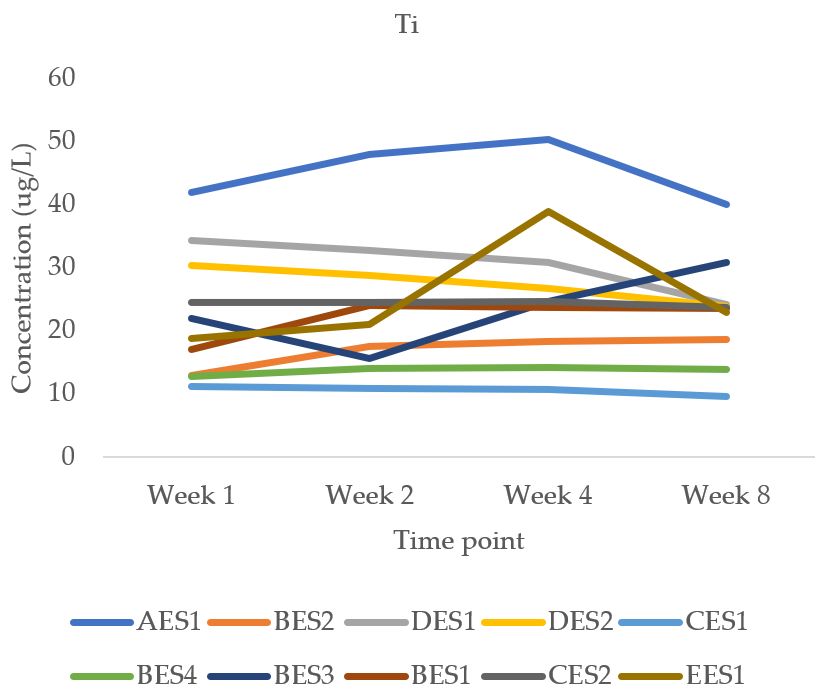
Int. J. Environ. Res. Public Health 2021, 18, 6391                                                                               2 of 11

                                        workers, a much higher prevalence than normally expected for silica-exposed workers.
                                        Many of these workers were deemed to require lung transplants [9]. The concerns about ES-
                                        associated silicosis and the comparatively young workers affected led to the development
                                        of the National Diseases Dust Taskforce in 2019 with the situation being viewed as a public
                                        health crisis [10].
                                              In the case of ES, most benchtop fabricators are small businesses, and a lack of personal
                                        protective measures and engineering controls has been considered a plausible explanation
                                        for the occurrence of ES-related silicosis [3,5]. Engineered stones are significantly different
                                        from natural stones and differing compositions could be related to higher toxicity [3]. Apart
                                        from the high amount of crystalline silica, ES includes organic resin, pigments, and other
                                        minerals such as feldspar [11]. The evidence relating to the toxicological and chemical
                                        properties of ES dust appears sparse, particularly the potential role played by resin and
                                        metal ions in the development of lung disease and broader immunological effects [3,8].
                                        Elemental components such as metal ions are considered important contributors to lung
                                        toxicity, primarily due to their ability to produce reactive oxygen species (ROS) [12,13].
                                        Elements such as iron, chromium, and manganese may induce the overproduction of
                                        ROS causing oxidative stress leading to damage in cell components and ultimately cell
                                        malfunction and death. The few studies that have assessed the chemical composition of
                                        respirable ES dust suggest that hetero ions present in ES dust are potentially responsible for
                                        higher toxicity and reactivity [8,14–16]. Cohen [12] reviewed the pulmonary toxicology of
                                        a range of metals, including aluminium and transition metals such as manganese. Changes
                                        have been noted in alveolar macrophages for manganese as MnCl2 and nickel as NiCl2.
                                        More research is required, particularly for combinations of metals, for understanding
                                        intrapulmonary effects [12].
                                              Element biosolubility studies are useful in assessing cell uptake evoking lung toxic-
                                        ity [17]. Simulated lung fluids (SLFs) simulating the interstitial and intracellular lung fluid
                                        environment have been used in several studies to assess the bioaccessibility of metallic
                                        constituents from vehicle dust, road exhaust, ultrafine airborne particulate matter, and
                                        high-temperature insulation wool [17–19]. To our knowledge, there is no reported study
                                        assessing the elemental bioaccessibility of ES dusts.
                                              The aim of this preliminary study was to understand solubility of ES-containing
                                        metals in artificial lysosomal fluid (ALF) simulating the acidic intracellular environment
                                        of lung macrophage lysosomes. In particular, the biosolubility variability across ES types
                                        (manufacturer and colour), and the time trend of metal ion release are explored.

                                        2. Materials and Methods
                                        2.1. ES Dust Generation
                                             Ten authentic ES samples were obtained from five different manufacturers, and were
                                        chosen on the basis of consumer popularity, colour and design. The organic content
                                        varied from 8.4–14.3% by weight. Each sample was initially cut using a wet diamond
                                        blade saw, and then crushed into small gravel-size pieces using a tungsten carbide jaw
                                        crusher in a specialized mineral processing facility in the University of Adelaide’s School
                                        of Physical Sciences. These were further comminuted using a tungsten carbide ring mill for
                                        4 min, maintaining moderate temperatures, to generate fine dust containing respirable and
                                        inhalable size particles. The mid-point of the size distribution was 10–18 µm, as determined
                                        by wet sizing with a Malvern Mastersizer 2000. Cross-contamination between samples was
                                        avoided by thoroughly cleaning the jawcrusher and ring mill after and before each use.
                                        The handling of the comminuted ES was done in a fume cupboard as the dust was easily
                                        dispersed into the atmosphere. We used a real time aerosol photometer (TSI DustTrak, TSI
                                        Incorporated, Shoreview, MN, USA) to identify and monitor dusty aspects of the work.

                                        2.2. Preparation of Artificial Lysosomal Fluids (ALF) and Its Extraction
                                             Artificial lysosomal fluid (ALF) at pH 4.5, simulating the in vivo physiological con-
                                        dition of an acidic intracellular environment in lung cells, was used for bioaccessibility,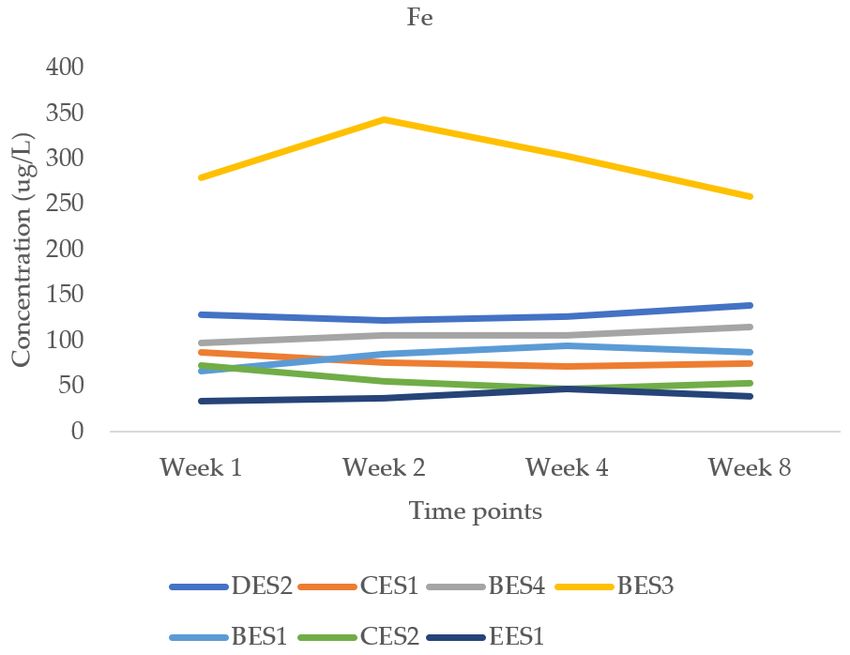
Int. J. Environ. Res. Public Health 2021, 18, 6391                                                                             3 of 11

                                        as recommended by Pelfrene [20]. ALF was prepared following the composition used
                                        by Cannizzaro et al. [18]. Analytical grade chemicals and ultra-pure water were used
                                        throughout to avoid contamination.
                                             Five grams of ES dust was mixed with 250 mL of ALF in a Schott bottle. ALF solution
                                        contains components such as pyruvate, citric acid, and glycine, which act as a growth media
                                        for many microorganisms; thus, 0.0002% formaldehyde was added to avoid microbial
                                        growth [18]. The sealed bottles containing a mixture of ES dust and ALF were placed in
                                        a shaker (Ratek OM25 orbital/mixer incubator) at 37 ◦ C and gently agitated at 80 rpm.
                                        Thirty-millilitre aliquots of ALF fluids were extracted periodically at one week, and two
                                        weeks, four weeks, and eight weeks of interaction with ES dust and was filled again with
                                        30 mL of new ALF. The pH was noted at all time points for all ALF bottles with ES dust. A
                                        blank (250 mL ALF without any ES dust) was used for every batch as a quality control.

                                        2.3. Determination of Metals and ES Reflected Brightness
                                             Extracted 30 mL ALF aliquots from the 250 bottles were centrifuged in metal free
                                        centrifuge tubes at 4000 rpm for 15 min to settle any suspended particles if present. None
                                        of the aliquots had any visible residues at the bottom of the tube after centrifugation. The
                                        aliquots, including blanks, were forwarded to a commercial laboratory with a National
                                        Association of Testing Authorities accreditation to perform elemental analysis of metal ions
                                        such as iron (Fe), Manganese (Mn), Aluminum (Al) and Titanium (Ti). A standard method
                                        using inductively coupled plasma-mass spectrometry (ICP-MS) was used. Adjustments for
                                        dilution with fresh ALF were made in the reporting of metal ion concentrations. In initial
                                        experiments, a linear relationship was observed in metal ion concentrations for samples
                                        that had 1, 2, 4, and 10 g of solid. Thus, the values reported here are also normalized on a
                                        gram basis, i.e., concentrations are expressed as micrograms/litre per gram of solid.
                                             Available metals (acid extractable) in the solid dust were determined by digestion
                                        with nitric and hydrochloric acid (1:1) for 1.5 h at 90–98 ◦ C prior to analysis by ICP-AES
                                        (atomic emission spectroscopy) and ICP-MS.
                                             The uncut ES samples were placed under normal overhead fluorescent lighting (4000
                                        K) and reflected light was determined with a calibrated Minolta NT-1 luminance meter.
                                        Values are expressed as candela per square metre.

                                        2.4. Data Analysis
                                             Descriptive statistics (with MS Excel) were used to summarise the concentration of
                                        metal ions for each stone type at each time point. The coefficient of variation was used to
                                        estimate the variability of the metal ion concentration results in replicate samples.

                                        3. Results
                                              Ten ES dusts (AES1, BES1, BES2, BES3, BES4, CES1, CES2, DES1, DES2 and EES1)
                                        from five different companies (prefixes A–E) were assessed.
                                              Although 12 elements were determined, based on likely content in the ES, only four
                                        elements, aluminum, titanium, manganese, and iron are included here as the metal ion
                                        concentration of vanadium, arsenic, nickel, copper, chromium, and antimony were below
                                        the limit of detection. In addition, tungsten and cobalt were not included as these could be
                                        introduced as contaminants during stone dust generation using tungsten carbide [21].
                                              All metal ion analyses conducted on blank ALF solutions at all time points were below
                                        the level of practical quantification. For Fe, Mn, Al and Ti, these were 10, 5, 10 and 1 µg/L
                                        for liquid samples. In the case of solid dust samples, these were 10, 1, 10 and 1 mg/kg.
                                              In order to estimate the variability of quantified metal ion concentrations in ALF
                                        solutions, triplicate samples in separate bottles were run for two stone types (BES2 and
                                        BES4) across three time points (week 1, 2 and 4). The maximum coefficient of variation was
                                        14.5% for Fe, 15.6% for Mn, 17% for Al and 22.8% for Ti.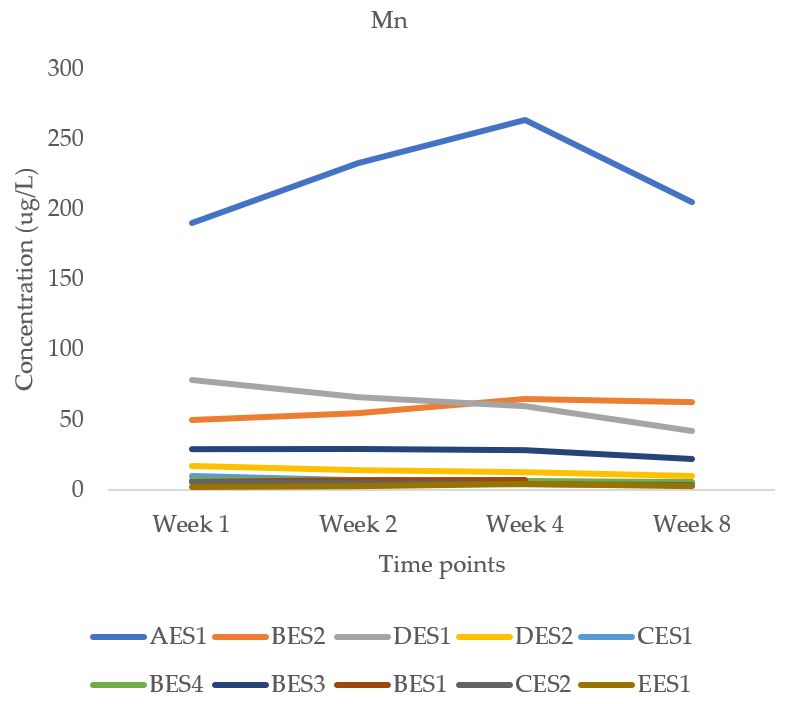
Int. J. Environ. Res. Public Health 2021, 18, 6391 4 of 11
3.1. Reflected Brightness of the Slab and Selected Chemical Characteristics in Unreacted ES
Dust Samples
Table 1 shows the reflected brightness of the slab, as well as the presence and variabili-
ties of selected metal elements, and main crystalline species before reaction with ALF. The
reflected brightness correlated with the visual appearance of ES types, such that the dark-
coloured stones had low values, while the light-coloured stones had the highest values. In
addition, the ES stones with low brightness (AES1, BES2, and DES1) had comparatively
higher amounts of iron and manganese. Manganese values tended to follow iron values.
Table 1. Physico-chemical characteristics of stone types: Brightness of original ES samples, metal concentrations in dust and
main crystalline species.
Brightness Fe Mn Al Ti
Stone Type Main Crystalline Mineral Species *
(cd/m2 ) (mg/kg) (mg/kg) (mg/kg) (mg/kg)
AES1 3.1 3800 63 150 9 89% quartz; 3% albite; 0.8% magnetite
BES1 62 40 1 230 7 56% quartz, 24% cristobalite, 2% albite
BES2 5.2 710 23 250 4 92% quartz
BES3 60 90 7 160 7 19% quartz, 47% cristobalite, 6% albite
BES4 58 50 3 190 6 23% quartz, 43% cristobalite, 7% albite
CES1 56 50 3 330 6 98% quartz, 2% rutile #
CES2 39 40 2 400 10 96% quartz, 4% rutile #
DES1 9.0 565 21 140 8 90% quartz
DES2 45 80 3 60 7 76% quartz, 23% cristobalite #
EES1 63.2 30 1 240 9 99% quartz #
* determined by X-ray Diffraction; # semi-quantitative.
3.2. Release of Metal Ions in Artificial Lysosomal Fluid
There were significant differences in the release of Fe, Al, Mn and Ti, depending on
the stone type. These tend to reflect the metal amounts inherent in the dust (Table 1).
Figure 1a,b relate to iron. Figure 1b excludes AES1, BES2 and DES1, which had high levels
of iron. Figure 1c–e relate to Al, Mn and Ti respectively.
3.2.1. Iron
There is significant variability in absolute terms. As can be seen from Figure 1a,
AES1 had the highest value of Fe release and the values increased steadily from week 1
to week 8. It is interesting that this sample had 0.8% crystalline magnetite as determined
by quantitative X-ray diffraction, and that the dust can be attracted to a strong magnet.
However, Fe release remained similar from week 1 and week 8 for other ES samples. These
data suggest that iron is solubilised relatively rapidly, which was confirmed by several
3-day reaction experiments (not reported here).
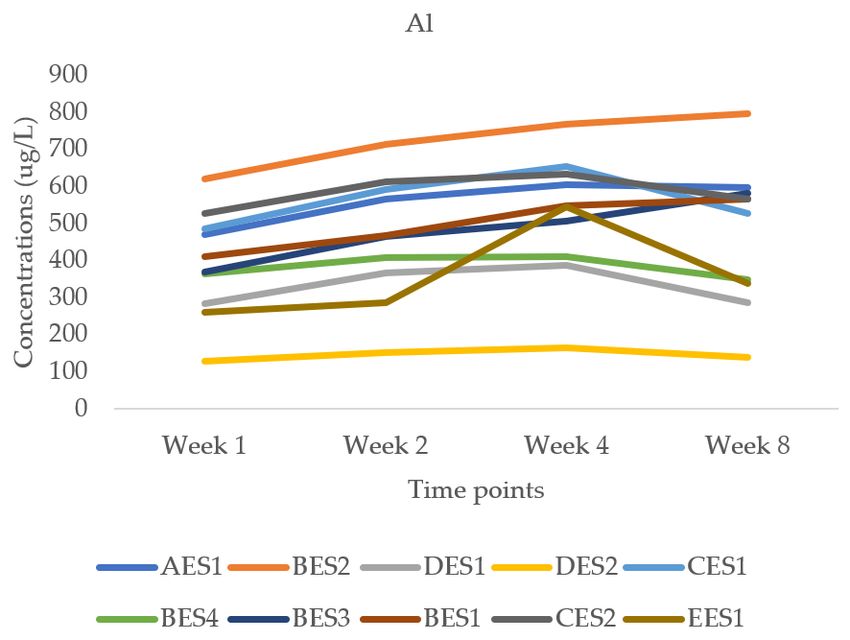
3.2.2. Aluminium
Aluminium was found to be a relatively abundant element released in ALF, which is to
be expected as ES typically contains aluminosilicate minerals, such as feldspars. Figure 1c
shows moderate variability in absolute terms and that aluminium release increased slightly
from week 1 to week 8 for most of the ES samples.
3.2.3. Manganese and Titanium
Figure 1d shows that there is significant variability in the manganese release in
absolute terms, but the time trend is relatively flat. Figure 1e shows less variability for
titanium in absolute terms and similar flatness in terms of time trend. Titanium can be
present as titanium dioxide, used as a white pigment.Int. J.J.Environ.
Int. Environ.Res.
Res.Public
PublicHealth
Health2021, 18,x6391
2021,18, FOR PEER REVIEW 5 5ofof11
11
(a)
(b)
Figure 1. Cont.Int.J.J.Environ.
Int. Environ.Res.
Res.Public
PublicHealth
Health2021, 18,x6391
2021,18, FOR PEER REVIEW 6 6ofof11
11
(c)
(d)Int.
Int.J.J.Environ.
Environ.Res.
Res.Public
PublicHealth
Health2021,
2021,18,
18,x6391
FOR PEER REVIEW 7 7ofof11
11
(e)
Figure
Figure1.1.(a)
(a)Iron
Iron release μg/L per
release ((µg/L pergram
gramofofsolid)
solid)from
fromvarious
variousESESat
atdifferent
differenttimepoints;
timepoints;(b)
(b) Iron
Iron
release (μg/L per gram of solid) at different time points, excluding AES1, BES2 and DES1;
release (µg/L per gram of solid) at different time points, excluding AES1, BES2 and DES1; (c) Alu- (c) Alu-
minium
miniumrelease
release(μg/L
(µg/Lperpergram
gramofofsolid)
solid)from
fromvarious
variousESESat
at different
different timepoints;
timepoints; (d)
(d) Manganese
Manganese
release (μg/L per gram of solid) for various ES at different time points; (e) Titanium release (μg/L
release (µg/L per gram of solid) for various ES at different time points; (e) Titanium release (µg/L
per gram of solid) for various ES at different time points.
per gram of solid) for various ES at different time points.
3.2.2.
3.2.4.Aluminium
Correlation of Reflected Brightness with Metal Ion Release
Aluminium
Figure 2a,b was
showfound to be arelationship
an inverse relatively abundant
betweenelement
reflectedreleased in ALF,
brightness and which is
the max-
to be expected
imum asiron
levels of ES typically containsrelease.
and manganese aluminosilicate minerals, such
This is consistent withasthe
feldspars. Figure1
data in Table
1c shows moderate
pertaining variabilitymetal
to acid-extractable in absolute
contentterms
of the and
solidthat aluminium release increased
dust.
slightly from week 1 to week 8 for most of the ES samples.
3.2.3. Manganese and Titanium
Figure 1d shows that there is significant variability in the manganese release in abso-
lute terms, but the time trend is relatively flat. Figure 1e shows less variability for titanium
in absolute terms and similar flatness in terms of time trend. Titanium can be present as
titanium dioxide, used as a white pigment.
3.2.4. Correlation of Reflected Brightness with Metal Ion Release
Figure 2a,b show an inverse relationship between reflected brightness and the maxi-
mum levels of iron and manganese release. This is consistent with the data in Table 1
pertaining to acid-extractable metal content of the solid dust.Int.
Int. J.
J. Environ. Res. Public
Environ. Res. Public Health
Health 2021, 18, x
2021, 18, 6391
FOR PEER REVIEW 88of
of 11
11
(a)
(b)
Figure
Figure 2.
2. (a)
(a) Iron
Iron release μg/L per
release ((µg/L pergram
gramofofsolid)
solid)versus
versus reflected
reflected brightness.
brightness. (b)
(b) Manganese
Manganese release
release
(μg/L per
(µg/L pergram
gramof ofsolid)
solid)versus
versusreflected
reflected brightness.
brightness.
3.3. Degree
3.3. Degree of Solubilisation
of Solubilisation of Metals
of Metals in Artificial
in Artificial Lysosomal
Lysosomal FluidFluid
The degree
degree ofofmetal
metalsolubilisation
solubilisationinin ALF
ALF varied
varied byby sample
sample typetype
andand metal.
metal. The
The pro-
proportion of metal released, relative to the amount available, was calculated
portion of metal released, relative to the amount available, was calculated as as (maximum
(μg/L) ××0.25
metal ion concentration (µg/L) 0.25L)/available
L)/available metal
metal inin the
the dust
dust (µg/g).
(μg/g).
Table 2 shows
shows that
that the
the proportion
proportion waswas generally
generally more
more than
than 50%.
50%. For example,
example, iron
solubilisation ranged
solubilisation ranged from
from 39%
39% inin EES1
EES1 to to 96%
96% in
in BES3.
BES3. InIn the
the case
case ofof aluminium,
aluminium, the
the
aluminosilicate content appears to have decomposed.
aluminosilicate content appears to have decomposed.Int. J. Environ. Res. Public Health 2021, 18, 6391 9 of 11
Table 2. Available metal in dust and percentage solubilisation of metals in ALF.
Metal AES1 BES1 BES2 BES3 BES4 CES1 CES2 DES1 DES2 EES1
Fe (mg/kg or
Available metal in solid dust 3800 40 710 90 50 50 40 565 80 30
µg/g))
Fe (µg/L) Maximum metal release 13,300 95 1257 344 116 87 73 1940 139 47
% of metal solubilised in ALF 87 59 44 96 58 44 46 86 43 39
Mn (mg/kg) Available metal in solid dust 63 1 23 7 3 3 2 21 3 1
Mn (µg/L) Maximum metal release 264 7 65 29 7 10 5 79 17 4
% of metal solubilised in ALF -* -* 71 -* 58 83 63 94 -* -*
Al (mg/kg) Available metal in solid dust 150 230 250 160 190 330 400 140 60 240
Al (µg/L) Maximum metal release 604 568 796 583 410 654 635 389 164 545
% of metal solubilised in ALF 100 62 80 91 54 50 40 69 68 57
Ti (mg/kg) Available metal in solid dust 9 7 4 7 6 6 10 8 7 9
Ti (µg/L) Maximum metal release 50 24 19 31 14 11 25 35 30 39
% of metal solubilised in ALF -* 86 -* -* 58 46 63 -* -* -*
* could not be reliably determined due to low initial concentration.
4. Discussion
This is the first study reporting ES metal ion release in ALF. The data indicate ex-
tensive, and sometimes progressive, metal solubilization in acid environments (pH 4.5)
corresponding to the intracellular environment of lung macrophage lysosomes. This is pos-
sibly due to chelation of the metals, driving the equilibrium towards soluble metal-organic
moieties.
The presence of the metals is generally consistent with information in the safety data
sheet (SDS) for the ES, including minerals such as rutile, magnetite, and hematite [11]. How-
ever, the information in SDSs is limited and does not provide proportionate information on
iron or any other elemental constituents. In addition, the SDS are usually not specific for
a stone type [11]. Thus, the users of the products are unaware of the amounts of metals
in the base minerals or pigments. However, our data suggest that the reflected brightness
may be an indication of iron and manganese content, and release (Table 1, Figure 2a,b).
Metals assessed in this study may enhance lung toxicity from crystalline silica [14,22,23].
Manganese and iron are essential cations for cell function in trace amounts. However,
where there is imbalance, these are toxicogenic and damage lung cells and tissues [24].
The presence of excessive Fe and Mn may enhance production of reactive oxygen species
(ROS), converting hydrogen peroxide into very reactive hydroxyl species, resulting in cell
damage [25,26].
Unfortunately, there seem to be very limited data on normal intra-macrophage metal
ion concentrations in the scientific literature. It is estimated that Fe concentrations in
lysosomes are 1–5 µM (56–279 µg/L) compared with extracellular fluid of 15–20 µM [27].
The source of various metals could be the mineral constituents, pigments, organic
resins, and stone processing activities [14]. Precise information on minerals, pigments and
resins used for ES manufacture is commercially sensitive and the elements could vary
depending on the source of raw materials used. A source of Fe and Mn could possibly be
the inorganic pigments. Titanium could be due to rutile, giving a white appearance. The
stone processing activities in industrial stone workshops may introduce different elements
such as Co, W and Fe [16,21]. For example, Co and W could be introduced through
cutting and grinding of ES slabs using tungsten carbide. A study comparing parent and
processed ES dust found that there can be significant chemical variability between parent
and processed dust. The variation was found to relate to the type of processing such as dry
cutting or wet cutting [16]. Another source of element contamination in ES is the polyester
resin binder, although the amount of metal catalyst is very small [28].Int. J. Environ. Res. Public Health 2021, 18, 6391 10 of 11
This study has a number of strengths. It examined products from multiple suppliers,
and examined metal ion release into ALF over an extended time period. The dust was
generated by moderate temperature comminution of authentic slab samples, avoiding any
decomposition.
There are some limitations. This preliminary study mainly focused on elemental
analysis and there was no speciation of the metals. Comprehensive physicochemical
characterisation of the ES dust, including electron microscopy was not done. Further
information on physicochemical characteristics would be helpful in further understanding
pathogenicity. Toxicology experiments can be coupled with the information of metal ion
release. These include cellular studies and hemolysis assays of ES that have significantly
different metal ion content. In this case, the role of metals in hemolysis and subsequent
fibrosis can be explored [29,30].
These findings may be useful in modifying the ES composition of these ES to make
safer products.
5. Conclusions
This study demonstrated the substantial variability in potential metal ion release from
ES dust in a simulated lung cell environment. There were significant differences in metal
ion release, depending on the ES type, particularly iron release. Time trends for metal
release also varied with ES type but also metal ion. With different varieties of ES available
in market and data suggesting variability of metal release with ES, there is a need for
further investigation of the toxicological properties of ES dust.
Author Contributions: All authors contributed to study design and interpretation of data. P.M., J.C.,
M.T. and D.P. undertook laboratory experimentation. P.M. and D.P. drafted the manuscript with
critical commentary from other authors. All authors have read and agreed to the published version
of the manuscript.
Funding: This research was supported by the SA Mining and Quarrying OHS Committee, Grant
MAQ0520.
Institutional Review Board Statement: Not applicable.
Informed Consent Statement: Not applicable.
Data Availability Statement: The data presented in this study are available on request from the
corresponding author.
Acknowledgments: We thank Fionnuala Sheehan from the School of Physical Sciences, University
of Adelaide, for assistance with sample comminution.
Conflicts of Interest: The authors declare no conflict of interest.
References
1. Cooper, J.H.; Johnson, D.L.; Phillips, M.L. Respirable Silica Dust Suppression during Artificial Stone Countertop Cutting. Ann.
Occup. Hyg. 2015, 59, 122–126. [CrossRef] [PubMed]
2. Fazen, L.E.; Linde, B.; Redlich, C.A. Occupational Lung Diseases in the 21st Century: The Changing Landscape and Future
Challenges. Curr. Opin. Pulmon. Med. 2020, 26, 142–148. [CrossRef]
3. Leso, V.; Fontana, L.; Romano, R.; Gervetti, P.; Iavicoli, I. Artificial Stone Associated Silicosis: A Systematic Review. Int. J. Environ.
Res. Public Health 2019, 16, 568. [CrossRef] [PubMed]
4. Ophir, N.; Amir Bar, S.; Korenstein, R.; Kramer, M.R.; Fireman, E. Functional, Inflammatory and Interstitial Impairment due to
Artificial Stone Dust Ultrafine Particles Exposure. Occup. Environ. Med. 2019, 76, 875–879. [CrossRef] [PubMed]
5. Hoy, R.F.; Baird, T.; Hammerschlag, G.; Hart, D.; Johnson, A.R.; King, P.; Putt, M.; Yates, D.H. Artificial Stone-Associated Silicosis:
A Rapidly Emerging Occupational Lung Disease. Occup. Environ. Med. 2018, 75, 3–5. [CrossRef] [PubMed]
6. Rose, C.; Heinzerling, A.; Patel, K.; Sack, C.; Wolff, J.; Zell-Baran, L.; Weissman, D.; Hall, E.; Sooriash, R.; McCarthy, R.B.; et al.
Severe Silicosis in Engineered Stone Fabrication Workers-California, Colorado, Texas, and Washington, 2017–2019. MMWR Morb.
Mortal. Wkly. Rep. 2019, 68, 813–818. [CrossRef] [PubMed]
7. Perez-Alonso, A.; Cordoba-Dona, J.A.; Millares-Lorenzo, J.L.; Figueroa-Murillo, E.; Garcia-Vadillo, C.; Romero-Morillos, J.
Outbreak of Silicosis in Spanish Quartz Conglomerate Workers. Int. J. Occup. Environ. Health 2014, 20, 26–32. [CrossRef]
[PubMed]Int. J. Environ. Res. Public Health 2021, 18, 6391 11 of 11
8. Paolucci, V.; Romeo, R.; Sisinni, A.G.; Bartoli, D.; Mazzei, M.A.; Sartorelli, P. Silicosis in Workers Exposed to Artificial Quartz
Conglomerates: Does it Differ from Chronic Simple Silicosis? Arch. Bronconeumol. 2015, 51, e57–e60. [CrossRef]
9. Kirby, T. Australia Reports on Audit of Silicosis for Stonecutters. Lancet 2019, 393, 861. [CrossRef]
10. Australia Government Department of Health. National Dust Disease Taskforce. Available online: https://www1.health.gov.au/
internet/main/publishing.nsf/Content/ohp-nat-dust-disease-taskforce.htm (accessed on 25 October 2020).
11. Reed, S.; Madden, C.; Davidson, M.; O’Donnell, G. Characterisation of Respiratory Hazards during the Manufacture and
Installation of Engineered and Natural Stone Products. In Proceedings of the 37th Annual Conference and Exhibition, Perth,
Australia, 20 November–4 December 2019; pp. 55–64, ISBN 978-0-9577703-6-2. Available online: https://www.aioh.org.au/
static/uploads/files/aioh-2019-conference-proceedings-combined-file-v2-wfxxyrwknmls.pdf (accessed on 25 October 2020).
12. Cohen, M. Pulmonary Immunotoxicology of Select Metals: Aluminum, Arsenic, Cadmium, Chromium, Copper, Manganese,
Nickel, Vanadium, and Zinc. J. Immunotoxicol. 2004, 1, 39–69. [CrossRef]
13. Jaishankar, M.; Tseten, T.; Anbalagan, N.; Mathew, B.B.; Beeregowda, K.N. Toxicity, Mechanism and Health Effects of Some Heavy
Metals. Interdiscip. Toxicol. 2014, 7, 60–72. [CrossRef]
14. Castranova, V.; Vallyathan, V.; Ramsey, D.M.; McLaurin, J.L.; Pack, D.; Leonard, S.; Barger, M.W.; Ma, J.Y.; Dalal, N.S.; Teass, A.
Augmentation of Pulmonary Reactions to Quartz Inhalation by Trace Amounts of Iron-Containing Particles. Environ. Health
Perspect. 1997, 105 (Suppl. 5), 1319–1324. [CrossRef]
15. Pavan, C.; Polimeni, M.; Tomatis, M.; Corazzari, I.; Turci, F.; Ghigo, D.; Funini, B. Abrasion of Artificial Stones as a New Cause of
an Ancient Disease. Physicochemical Features and Cellular Responses. Toxicol. Sci. 2016, 153, 4–17. [CrossRef] [PubMed]
16. Di Benedetto, F.; Giaccherini, A.; Montegrossi, G.; Pardi, L.A.; Zoleo, A.; Capolupo, F.; Innocenti, M.; Lepore, G.O.; d’Acapito,
F.; Capacci, F.; et al. Chemical Variability of Artificial Stone Powders in Relation to their Health Effects. Sci. Rep. 2019, 9, 6531.
[CrossRef]
17. Weggeberg, H.; Benden, T.F.; Steinnes, E.; Flaten, T.P. Element Analysis and Bioaccessibility Assessment of Ultrafine Airborne
Particulate Matter (PM0. 1) Using Simulated Lung Fluid Extraction (Artificial Lysosomal Fluid and Gamble’s Solution). Environ.
Chem. Ecotoxicol. 2019, 1, 26–35. [CrossRef]
18. Cannizzaro, A.; Angelosanto, F.; Barrese, E.; Campopiano, A. Biosolubility of High Temperature Insulation Wools in Simulated
Lung Fluids. J. Occup. Med. Toxicol. 2019, 14, 15. [CrossRef] [PubMed]
19. Colombo, C.; Monhemius, A.J.; Plant, J.A. Platinum, Palladium and Rhodium Release from Vehicle Exhaust Catalysts and Road
Dust Exposed to Simulated Lung Fluids. Ecotoxicol. Environ. Saf. 2008, 71, 722–730. [CrossRef]
20. Pelfrêne, A.; Cave, M.R.; Wragg, J.; Douay, F. In Vitro Investigations of Human Bioaccessibility from Reference Materials using
Simulated Lung Fluids. Int. J. Environ. Res Public Health 2017, 14, 112. [CrossRef] [PubMed]
21. Yamasaki, T. Contamination from Mortars and Mills during Laboratory Crushing and Pulverizing. Bull. Geol. Surv. Jpn. 2018, 69,
201–210. [CrossRef]
22. Hetland, R.B.; Refsnes, M.; Myran, T.; Johansen, B.V.; Uthus, N.; Schwarze, P.E. Mineral and/or Metal Content as Critical
Determinants of Particle-Induced release of IL-6 and IL-8 from A549 cells. J. Toxicol Environ. Health A 2000, 60, 47–65. [CrossRef]
23. Becher, R.; Hetland, R.B.; Refsnes, M.; Dahl, J.E.; Dahlman, H.J.; Schwarze, P.E. Rat Lung Inflammatory Responses after In Vivo
and In Vitro Exposure to Various Stone Particles. Inhal. Toxicol. 2001, 13, 789–805. [CrossRef] [PubMed]
24. Neves, J.; Haider, T.; Gassmann, M.; Muckenthaler, M.U. Iron Homeostasis in the Lungs-A Balance between Health and Disease.
Pharmaceuticals 2019, 12, 5. [CrossRef]
25. Martinez-Finley, E.J.; Gavin, C.E.; Aschner, M.; Gunter, T.E. Manganese Neurotoxicity and the Role of Reactive Oxygen Species.
Free Rad. Biol. Med. 2013, 62, 65–75. [CrossRef] [PubMed]
26. Fubini, F.; Fenoglio, I. Toxic Potential of Mineral Dusts. Elements 2007, 3, 407–414. [CrossRef]
27. Bischof, H.; Burgstaller, S.; Waldeck-Weiermair, M.; Rauter, T.; Schinagl, M.; Ramadani-Muja, J.; Graier, W.F.; Malli, R. Live-Cell
Imaging of Physiologically Relevant Metal Ions Using Genetically Encoded FRET-Based Probes. Cells 2019, 8, 492. [CrossRef]
28. Jansen, J.F.G.A.; Hilker, I.; Kleuskens, E.; Hensen, G.; Kraeger, I.; Posthumus, W. Cobalt Replacement in Unsaturated Polyester
Resins-Going for Sustainable Composites. Macromol. Symp. 2013, 329, 142–149. [CrossRef]
29. Murashov, V.; Harper, M.; Demchuk, E. Impact of Silanol Surface Density on the Toxicity of Silica Aerosols Measured by
Erythrocyte Haemolysis. J. Occup. Environ. Hyg. 2006, 3, 718–723. [CrossRef]
30. Pavan, C.; Santalucia, R.; Leinardi, R.; Fabbiani, M.; Yakoub, Y.; Uwambayinema, F.; Ugliengo, P.; Tomatis, M.; Martra, G.; Turci,
F.; et al. Nearly Free Surface Silanols are the Critical Molecular Moieties that Initiate the Toxicity of Silica Particles. Proc. Natl.
Acad. Sci. USA 2020, 117, 27836–27846. [CrossRef]You can also read