Meteorological, snow and soil data (2013-2019) from a herb tundra permafrost site at Bylot Island, Canadian high Arctic, for driving and testing ...
←
→
Page content transcription
If your browser does not render page correctly, please read the page content below
Earth Syst. Sci. Data, 13, 4331–4348, 2021
https://doi.org/10.5194/essd-13-4331-2021
© Author(s) 2021. This work is distributed under
the Creative Commons Attribution 4.0 License.

          Meteorological, snow and soil data (2013–2019) from a
          herb tundra permafrost site at Bylot Island, Canadian
              high Arctic, for driving and testing snow and
                           land surface models
       Florent Domine1,2,3 , Georg Lackner1,2,4 , Denis Sarrazin2 , Mathilde Poirier2,5 , and Maria Belke-Brea1,2,6
       1 Takuvik   Joint International Laboratory, Université Laval (Canada) and CNRS-INSU (France), Québec, Canada
                                  2 Centre d’Études Nordiques, Université Laval, Québec, Canada
                                     3 Département de chimie, Université Laval, Québec, Canada
                       4 Département de génie civil et de génie des eaux, Université Laval, Québec, Canada
                                    5 Département de biologie, Université Laval, Québec, Canada
                                  6 Département de géographie, Université Laval, Québec, Canada

                               Correspondence: Florent Domine (florent.domine@gmail.com)

                                     Received: 28 February 2021 – Discussion started: 1 April 2021
                          Revised: 2 August 2021 – Accepted: 11 August 2021 – Published: 7 September 2021

       Abstract. Seasonal snow covers Arctic lands 6 to 10 months of the year and is therefore an essential element
       of the Arctic geosphere and biosphere. Yet, even the most sophisticated snow physics models are not able to
       simulate fundamental physical properties of Arctic snowpacks such as density, thermal conductivity and specific
       surface area. The development of improved snow models is in progress, but testing requires detailed driving and
       validation data for high Arctic herb tundra sites, which are presently not available. We present 6 years of such data
       for an ice-wedge polygonal site in the Canadian high Arctic, in Qarlikturvik valley on Bylot Island at 73.15◦ N.
       The site is on herb tundra with no erect vegetation and thick permafrost. Detailed soil properties are provided.
       Driving data are comprised of air temperature, air relative and specific humidity, wind speed, shortwave and
       longwave downwelling radiation, atmospheric pressure, and precipitation. Validation data include time series of
       snow depth, shortwave and longwave upwelling radiation, surface temperature, snow temperature profiles, soil
       temperature and water content profiles at five depths, snow thermal conductivity at three heights, and soil thermal
       conductivity at 10 cm depth. Field campaigns in mid-May for 5 of the 6 years of interest provided spatially
       averaged snow depths and vertical profiles of snow density and specific surface area in the polygon of interest
       and at other spots in the valley. Data are available at https://doi.org/10.5885/45693CE-02685A5200DD4C38
       (Domine et al., 2021). Data files will be updated as more years of data become available.

1   Introduction                                                    mafrost thermal regime (Zhang, 2005; Barrere et al., 2017).
                                                                    Where permafrost is absent, snow thermal conductivity de-
The seasonal snowpack covers high-latitude regions at low           termines whether and when the ground freezes, with a very
elevation 6 to 10 months of the year (Connolly et al., 2019).       strong impact on nutrient recycling and the accumulation of
Snow physical properties such as specific surface area (SSA)        organic compounds in soils (Saccone et al., 2013; Myers-
and density determine albedo (Carmagnola et al., 2013), an          Smith and Hik, 2013; Buckeridge and Grogan, 2008). Snow
essential component of the surface energy budget. Snow ther-        thermal conductivity also strongly influences surface air tem-
mal conductivity determines heat exchanges between the at-          perature (Domine et al., 2019), and inadequate simulations of
mosphere and the ground and therefore impacts the per-              this variable can modify simulated air temperature by up to

Published by Copernicus Publications.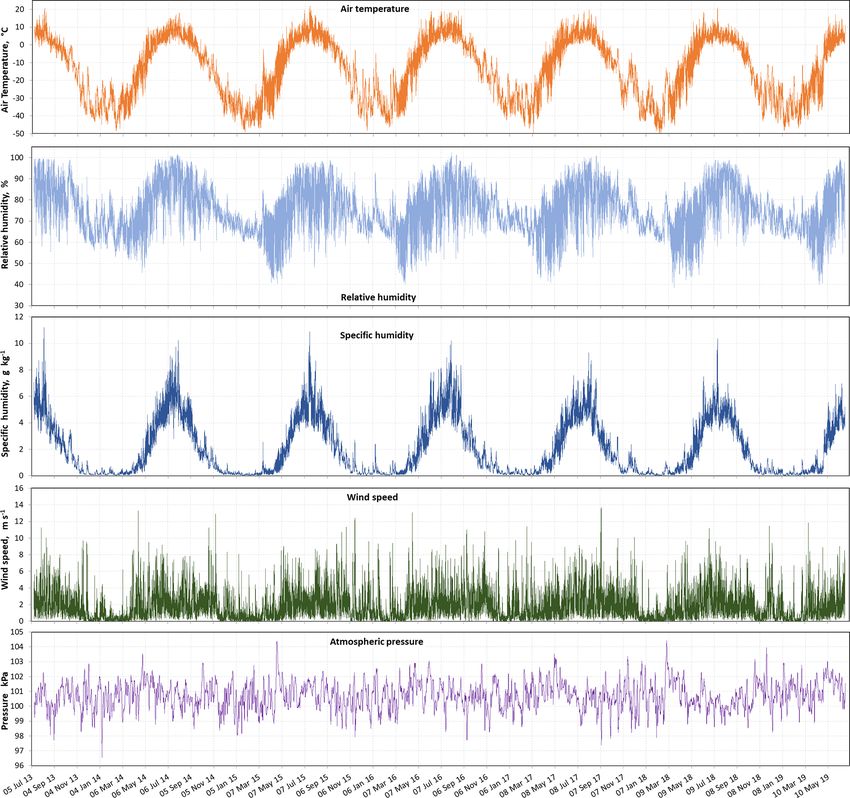
4332                                                     F. Domine et al.: High Arctic data for snow and land surface models

4 ◦ C, potentially affecting meteorological models and high-      Arctic and boreal forest snowpacks together represent by
latitude weather forecasts. Lastly, snow physical properties      far the most important seasonal snowpacks on Earth on an
affect wildlife. For example, lemmings, small rodents of the      areal basis (Sturm et al., 1995), it is essential that data sets
high Arctic, live, move, feed and reproduce under the snow        be available which allow the testing of snow models and
9 months of the year in the high Arctic (Poirier et al., 2019;    their application to high latitudes. At present, there is not
Bilodeau et al., 2013). Their population cycles have intrigued    to our knowledge any multi-year high Arctic data set com-
scientists for decades (Fauteux et al., 2015), and recent stud-   plete enough to drive and validate in detail a snow physics
ies have indicated that snow physical properties, and in par-     model. The northernmost site used in the latest snow model
ticular the hardness of the snow basal layer, may strongly im-    intercomparison project (SNOWMIP; Krinner et al., 2018) is
pact lemming reproductive success in winter and their sum-        Sodankylä, Finland, 67◦ N. Although it is classified as “Arc-
mer population dynamics (Domine et al., 2018b). Likewise,         tic” in Krinner et al. (2018), Sodankylä is in the boreal forest,
larger Arctic herbivores such as caribou are strongly affected    while Arctic usually refers to regions above the tree line. In
by snow physical properties, which determine their access to      the boreal forest, the dense wind slabs observed in the Arc-
food under the snow (Langlois et al., 2017).                      tic do not form, and snow properties are markedly different
   Adequately simulating snow physical properties is there-       from those on Arctic tundra (Sturm et al., 1995). Boike et
fore essential for understanding and/or projecting climate,       al. (2018) have provided a 20-year data set of permafrost, ac-
meteorology, the state of permafrost, nutrient cycling and        tive layer and meteorological data for a site near Ny-Ålesund,
carbon storage in soils and therefore vegetation growth and       Svalbard (78.5◦ N, 11.6◦ E), suitable for driving land surface
the carbon budget of Arctic soils and permafrost as well          and snow models. However, while this data set can be used
as and wildlife ecology and population dynamics. Despite          for numerous valuable applications, the snow validating data
these critically high stakes, there is today no detailed snow     are limited to snow depth and to snow pit observations in
physics model capable of simulating Arctic snowpack physi-        late April or early May. The snow physical data are com-
cal properties adequately. Domine et al. (2016b) have shown       prised of density at several heights and of the vertical tem-
that both detailed snow models Crocus (Vionnet et al., 2012)      perature profile when the pit was dug. These data are useful
and SNOWPACK (Bartelt and Lehning, 2002) failed to sim-           but are probably not sufficient for thoroughly testing snow
ulate essential characteristics of the snowpack at the high       physics model performance under Arctic conditions. Boike
Arctic site of Bylot Island (73◦ N). In particular, simulated     et al. (2019) also presented a 16-year data set of permafrost,
snow density profiles were inverted relative to observations.     active layer and meteorological conditions for Samoylov Is-
Both models predicted dense basal layers and light top lay-       land in Siberia (72.3◦ N, 126.5◦ E). The site is in the Lena
ers, while most snow observations in the high Arctic have         river delta and features ice-wedge polygons, with a very high
reported low-density basal layers made of depth hoar and          fraction of ground ice. The permafrost data, together with a
high-density upper wind slabs (Derksen et al., 2009; Domine       previous paper (Boike et al., 2013), are extremely detailed so
et al., 2002, 2012, 2016b; Gouttevin et al., 2018). The ex-       that this data set is certainly particularly useful for permafrost
planation proposed (Domine et al., 2019, 2016b) is that Cro-      simulations. Regarding snow however, data are more lim-
cus and SNOWPACK were calibrated using data from sites            ited and comprised of snow depth, time lapse photographs,
in the Alps, i.e., for mid-latitude warm, thick snowpacks,        and some spring measurements of snow properties such as
while the Arctic features cold, thin snowpacks. In the Alps,      density and thermal conductivity. Snow precipitation has not
an essential driving variable in snowpack vertical profiles of    been measured there.
physical properties is compaction by the snow overburden.            The Samoylov site has been used to test the SNOWPACK
In the thin Arctic snowpack, this process is negligible, and      model. Gouttevin et al. (2018) used a 1-year driving data set
the main process involved in determining the evolution of         to simulate snow and used snow pit data from a field cam-
the density profile after precipitation and wind compaction       paign in April as well as ground temperature monitoring at
is the upward flux of water vapor, caused mostly by convec-       5 cm depth as validating data. They modified the SNOW-
tion within the snowpack (Trabant and Benson, 1972; Sturm         PACK model to adapt it to Arctic conditions and in particular
and Benson, 1997; Sturm and Johnson, 1991; Domine et al.,         modified grain growth rate laws. However, they did not treat
2016b). This flux is driven by the large vertical temperature     upward water vapor fluxes explicitly. That study constitutes
gradient, which redistributes mass from lower to upper lay-       valuable progress towards the elaboration of an Arctic snow
ers. This process is so intense and the associated mass loss      model, but a 1-year test is not sufficient to oversee the va-
so large that it sometimes leads to the collapse of the basal     riety of high Arctic conditions. For example, in their study,
depth hoar layer (Domine et al., 2016b), even in the low Arc-     they encountered high-density “indurated” depth hoar which
tic (Domine et al., 2015). This process is not simulated by       is frequent but far from ubiquitous in the high Arctic. The
Crocus or SNOWPACK, leading to erroneous outputs.                 motivation of the present work is therefore to provide over
   Upward water vapor fluxes are also the main determinant        an extended period driving and testing data for snow physics
of snowpack vertical profiles of physical properties in many      at a high Arctic site so that the ability of snow physics and
areas of the boreal forest (Sturm and Benson, 1997). Since

Earth Syst. Sci. Data, 13, 4331–4348, 2021                                         https://doi.org/10.5194/essd-13-4331-2021
F. Domine et al.: High Arctic data for snow and land surface models                                                       4333

land surface schemes can be tested in a variety of meteoro-       center. Equipment is detailed in Table 1 and includes a tri-
logical situations in these high Arctic conditions.               pod supporting meteorological instruments at 2.3 m height, a
   We provide standard meteorological data for driving mod-       vertical polyethylene post supporting three TP08 heated nee-
els: air temperature and relative humidity, atmospheric pres-     dle probes for snow thermal conductivity measurements and
sure, wind speed, shortwave (SW↓) and longwave (LW↓)              another post supporting five thermistors for snow tempera-
incoming radiation, and precipitation. Detailed soil proper-      ture measurements. Below the surface, 5TM sensors from
ties such as density, granulometry, organic carbon content        Decagon (now Meter) measure soil temperature and volu-
and thermal conductivity at several depths are also provided.     metric liquid water content at five depths, and a TP08 probe
For validation, we provide continuous monitoring of snow          monitors soil thermal conductivity. The instruments are ac-
depth, upwelling shortwave radiation (SW↑), surface albedo,       cessed and maintained once a year in summer. Instrument
upwelling longwave radiation (LW↑), surface temperature,          failure thus cannot always be fixed immediately. The CNR4
snow temperature at five heights, snow thermal conductiv-         radiometer was brought back south in 2019 for recalibration
ity at three heights, soil temperature and volume liquid water    by Kipp & Zonen, and the drift in sensitivities was consid-
content at five depths, and soil thermal conductivity at 10 cm    ered in data analysis. Some data from 2013 to 2015 have been
depth. The data cover a 6-year span from 11 July 2013 to 25       reported by Domine et al. (2016b) and have been used by
June 2019. Data from 2019–2020 could not yet be retrieved         Barrere et al. (2017) to simulate snow and ground properties,
due to the COVID-19 pandemic, which prevented access to           with driving data presented by Barrere and Domine (2017).
our site. However, data from future years will be added to        Most data were recorded by a Campbell CR1000-XT data
the set as they become available. Furthermore, field cam-         logger, except soil temperature and volume water content,
paigns at this site were possible in May 2014, 2015, 2017,        which were recorded by an Em50 logger from Decagon
2018 and 2019, and we also present snow pit observations of       (now Meter). A Reconyx time lapse camera taking several
snow stratigraphy and measurements of vertical profiles of        pictures a day was installed in summer 2016. It was re-
snow density and SSA for those years. In May 2016, logisti-       placed and reoriented in July 2018. Similar cameras at other
cal difficulties prevented access to the site.                    sites within 3 km were present starting in 2015. In summer
                                                                  2016, the SALIX meteorological station, fairly similar to
                                                                  the TUNDRA station described here (except there was no
2   Study site and instruments                                    CNR4), was deployed 9 km up-valley from TUNDRA (at
                                                                  73.1816◦ N, 79.7454◦ W). Data from that station were occa-
Our study site is in Qarlikturvik valley on Bylot Island, north   sionally used for filling data gaps.
of Baffin Island in the Canadian Archipelago (Fig. 1). The           There is no small-scale topography within the polygon
nearest community is Pond Inlet on Baffin Island, 85 km to        (Fig. 1) and in particular no hummock or tussock. The
the southeast, from which our permanent camp can be ac-           permafrost there has been described by Fortier and Al-
cessed by helicopter in summer or snowmobile in spring.           lard (2005). It is several hundred meters thick with an ac-
Aircraft landing on skis is occasionally possible in spring       tive layer 20 to 35 cm deep. The visibly (dark) organic-rich
or on a nearby beach in summer with tundra tires. At-             surface soil layer is 2 to 10 cm thick. Soil samples from a
mospheric monitoring was initiated in August 1993 at the          vertical profile taken with a vertical resolution of 5 cm on 3
Camp Lake site (hereafter CAMP; 73.1567◦ N, 79.9571◦ W),          July 2017 were analyzed for organic carbon content using the
and air temperature and humidity as well as wind speed            procedure detailed in Gagnon et al. (2019). We chose a spot
(3 m) data are available since that date (CEN, 2020). In July     where the thawed layer was deepest, 30 cm, within an ob-
2004 a 10 m tower (called SILA) was built (at 73.1522◦ N,         served range of 15–30 cm. There was less moss at this spot
79.9886◦ W) 1150 m west-southwest of CAMP and equipped            than in most other places on the polygon. The carbon content
to measure wind speed and direction (10 m) and air tempera-       decreased from 8.3 to 0.3 kg C per kilogram of dry soil be-
ture. Data are also available (CEN, 2020) at the same repos-      tween 0–5 and 20–25 cm depths. A graph is shown in Fig. S1,
itory and DOI as the CAMP data. The data discussed here           along with soil density and water weight fraction. Soil granu-
are from a comprehensive monitoring station established on        lometry was analyzed as mentioned in Domine et al. (2016b)
7 July 2013 at the TUNDRA site (73.1504◦ N, 80.0046◦ W),          for three depth intervals: 0–5, 10–15 and 20–25 cm (Fig. S2).
1700 m to the west-southwest of CAMP. The GPS elevation           The 0–5 cm sample was silt loam with a unimodal asymmet-
of the site is 20 to 25 m, but according to the Canada At-        ric distribution of grain size centered at 51 µm, the 10–15 cm
las maps (http://atlas.gc.ca, last access: 15 January 2021),      sample was silt loam with a bimodal distribution at 17.4 and
the site is just below the 20 m contour line. Google Earth        59.0 µm, and the 20–25 cm sample was sandy loam with a
indicates an elevation of 25 m. The site has been presented       bimodal distribution at 11.6 and 152.5 µm.
by Domine et al. (2016b). Briefly, the instruments are within        Triplicate measurements of the ground thermal conductiv-
a rather well-drained low-center ice-wedge polygon typical        ity were performed on 9 July 2013 at 5 cm depth, within 2 m
of permafrost landscape. The polygon is about 11 m in its         of the TP08 post, with a TP02 heated needle probe from
largest dimension, and all instruments are within 3 m of its      Hukseflux, yielding values of 0.159 ± 0.004 W m−1 K−1 .

https://doi.org/10.5194/essd-13-4331-2021                                        Earth Syst. Sci. Data, 13, 4331–4348, 2021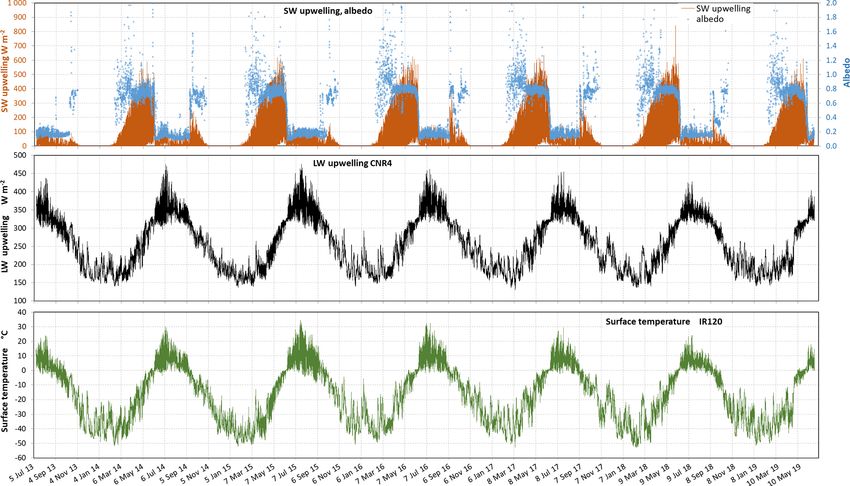
4334                                                         F. Domine et al.: High Arctic data for snow and land surface models

Table 1. Instruments used to obtain meteorological, snow and soil data at Bylot Island.

    Variable                   Instrument                     Manufacturer           Instrument height or       Comment
                                                                                     depth
    Shortwave radiation        CNR4 pyranometers,             Kipp & Zonen           2.3 m                      CNF4 on for 5 min
    down- and upwelling        300–3000 nm with CNF4                                                            before hourly measure-
                               ventilator and heater                                                            ment
    Longwave radiation         CNR4 pyrgeometers,             Kipp & Zonen           2.3 m                      CNF4 on for 5 min
    down- and upwelling        4.5–42 µm with CNF4 ven-                                                         before hourly measure-
                               tilator and heater                                                               ment
    Snow (winter) or soil      IR 120 infrared sensor,        Campbell Scientific    1.5 m                      Measurement every
    (summer) surface tem-      8–14 µm                                                                          minute, hourly average
    perature                                                                                                    recorded
    Air temperature and        HC2-S3-XT sensor, inside       Rotronic               2.3 m                      Ventilator on for 5 min
    relative humidity          white PVC tubing, venti-                                                         before hourly measure-
    (relative to liquid or     lated                                                                            ment
    supercooled water)
    Wind speed                 Cup anemometer                 Vector instruments     2.3 m                      Measurement every
                                                                                                                minute, hourly average
                                                                                                                recorded
    Precipitation              Geonor 200, complemented                              1.5 m
                               with data from
                               Geonor gauges at Pond
                               Inlet and Cape Liverpool
    Atmospheric pressure       Not measured, data from                                                          Average value of data
                               Pond Inlet and Cape Liver-                                                       from station at Pond In-
                               pool used                                                                        let and Cape Liverpool
    Snow depth                 SR50A acoustic gauge           Campbell scientific    2.2 m                      Measurement every
                                                                                                                minute, hourly average
                                                                                                                recorded
    Snow thermal               TP08 heated needle probes      Hukseflux              7, 17, 27 cm in 2013,      Measurement every
    conductivity                                                                     changed to 2, 12, 22 cm    other day at 05:00 local
                                                                                     in July 2014               summer time (UTC−4)
    Snow temperature           Pt 100 thermistors             Home-assembled         2, 7, 17, 27, 37 cm,       Measurement every
                                                              sensors                changed to 0, 5, 15, 25,   minute, hourly average
                                                                                     35 in July 2018            recorded
    Soil thermal               TP08 heated needle probes      Hukseflux              10 cm                      Measurement every
    conductivity                                                                                                other day at 05:00 local
                                                                                                                summer time
    Soil temperature and       5TM sensors                    Decagon                2, 5, 10, 15, 21 cm        Hourly measurement
    volume water content                                      (now Meter)
    Scenery                    Time lapse camera              Reconyx                1.5 m                      Four pictures a day

The ground temperature was 6.3 ◦ C, and the fractional wa-                was measured on 3 July 2017, within 2 m of the 29 June 2014
ter volume content measured with an EC5 probe from                        pit, when soil samples for carbon analysis were taken. Plots
Decagon was 0.151. A vertical profile of the ground ther-                 of the vertical profiles, along with the associated profiles of
mal conductivity was measured on 29 June 2014, about                      fractional water volume content (obtained with a Decagon
5 m away from the TP08 post, showing values increasing                    EC5 sensor) and temperature, are shown in Fig. S3. Signif-
from 0.235 W m−1 K−1 at 3 cm depth to 1.481 W m−1 K−1 at                  icant spatial variability in thermal conductivity is observed
15 cm depth. Another vertical profile of thermal conductivity             since values near the surface vary by a factor of 3 within a

Earth Syst. Sci. Data, 13, 4331–4348, 2021                                                https://doi.org/10.5194/essd-13-4331-2021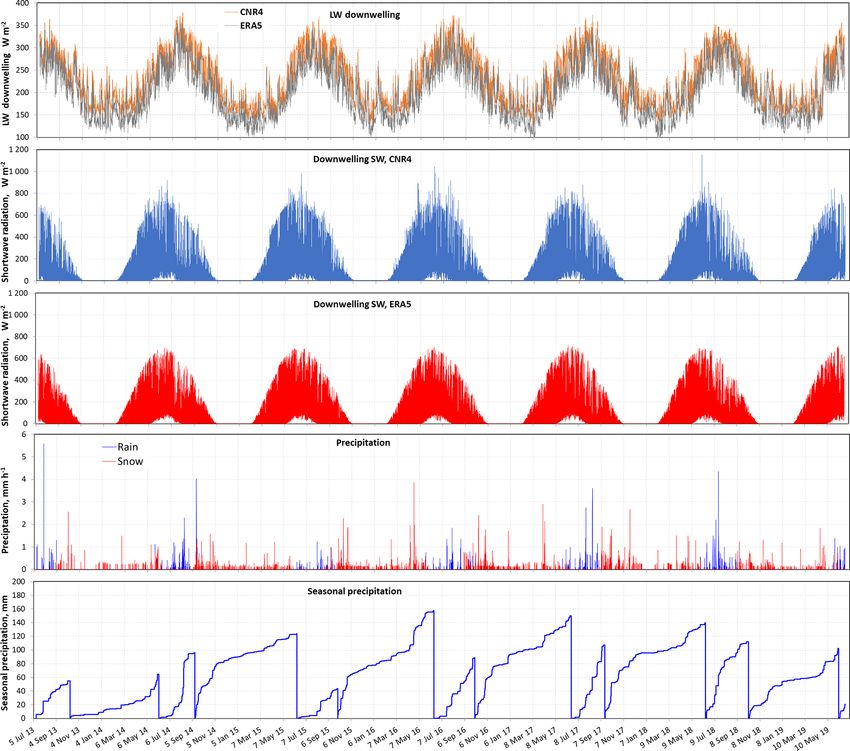
F. Domine et al.: High Arctic data for snow and land surface models                                                                  4335

Figure 1. (Left) map of Qarlikturvik valley on Bylot Island in the Canadian Arctic Archipelago, showing the TUNDRA study site. The
Environment and Climate Change Canada (ECCC) meteorological stations at Cape Liverpool and Pond Inlet as well as the SILA, CAMP and
SALIX stations, all of which were used for data gap filling, are also shown. View of the polygon where instruments were installed (right).
General aerial view of the polygon area, with arrow pointed at TUNDRA station. Maps from http://atlas.gc.ca (last access: 15 January 2021).

few meters. Over the years, about eight soil pits were dug              identical. The broadband albedo derived from the average of
in the TUNDRA polygon for physical measurements, sam-                   these spectra is 0.18.
pling, and instrument installation and maintenance. Varia-                 In May 2014, 2015, 2017, 2018 and 2019, field measure-
tions in soil color and texture were visible to the eye. In             ments were performed in several spots in Qarlikturvik valley.
particular the thickness of the darker surface soil layer, pre-         Around the TUNDRA sites, over 100 measurements of snow
sumably organic-rich, varied between 2 and 10 cm. All soil              depth were performed to obtain a more spatially represen-
physical variables mentioned here therefore varied within the           tative value of snow depth than the one spot measured auto-
polygon. More extensive pit digging for extra measurements              matically. Snow pits were dug to observe the stratigraphy and
risked modifying the soil properties in the polygon.                    measure vertical profiles of density and SSA. Density was
   Vegetation in these polygons has been detailed in Gau-               measured by weighing snow sampled with a 100 cm3 box
thier et al. (1995). It consists mostly of graminoids, sedges           cutter. SSA was measured by infrared reflectance at 1310 nm
and mosses with some prostrate ligneous species: Salix arc-             using the DUFISSS instrument (Gallet et al., 2009). During
tica and S. herbacea. Vegetation height does not exceed                 each campaign, a pit was dug within 3 m of the thermal con-
5 to 10 cm as there is no erect vegetation (Fig. 1). The                ductivity post. Two to seven pits were dug elsewhere in the
spectral albedo of the site was measured on 11 July 2015                valley to assess spatial variability. Logistical difficulties did
around 17:25 UTC. The sky was clear, but the atmosphere                 not allow a field campaign in May 2016.
was slightly foggy. The instrument was an SVC spectrome-
ter equipped with an integrating sphere, one Si photodiode
detector for the visible and near-infrared range, and two In-           3   Driving data quality check and correction
GaAs photodiode detectors for the shortwave infrared range.
Two spectra were recorded over the 346–2513 nm wave-                    Several environmental factors and problems with instruments
length range. They are shown in Fig. S4 and are essentially             can affect data quality. For example, since the tripod is on
                                                                        permafrost, ground thawing and freezing may modify its lev-

https://doi.org/10.5194/essd-13-4331-2021                                               Earth Syst. Sci. Data, 13, 4331–4348, 2021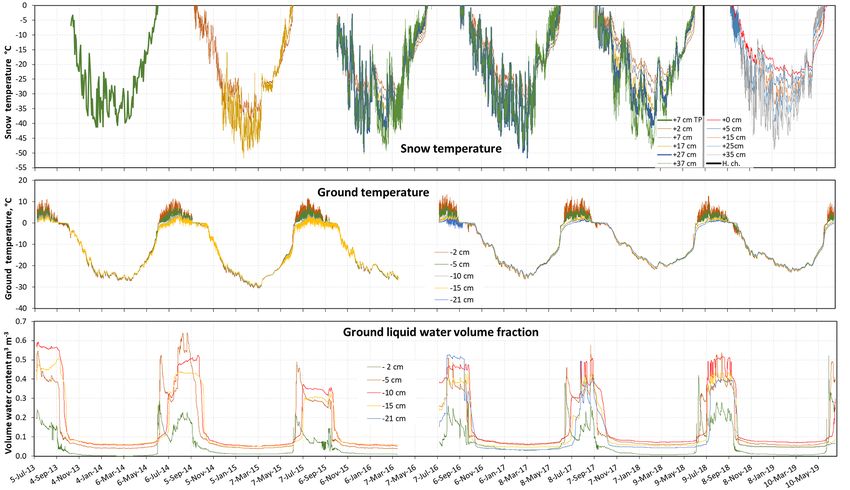
4336 F. Domine et al.: High Arctic data for snow and land surface models
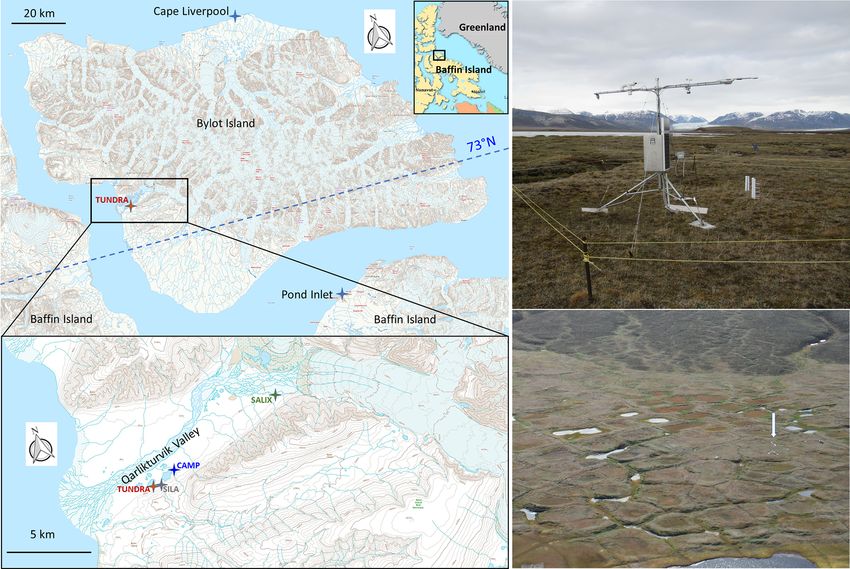
Figure 2. Time series of air temperature, relative and specific humidity, wind speed, and atmospheric pressure at the TUNDRA site on Bylot
Island.
eling, which was adjusted in early July every year. How- 3.1 Air temperature
ever, further shifting can take place later in the summer.
Some years, this produced a slight offset in snow depth and
Air temperature was measured with a ventilated HC2-S3-XT
in the CNR4 leveling. In winter, frost can build up on the
sensor at 2.3 m height. Data from 2013–2014 were missing
anemometer and block it. Frost can obscure the CNR4 top
because of sensor failure, but we used CR1000 data logger
windows, producing erroneous measurements. All these dif-
temperature instead. That sensor was slightly sensitive to ra-
ficulties were thoroughly investigated and corrected for. In
diation. Based on several years of simultaneous temperature
2016, large surface plates were placed under each tripod leg,
measurements of the HCS2-S3-XT and CR1000 sensors, we
and this significantly reduces tripod movement and tilting.
corrected the CR1000 sensor values by adding a linear func-
The treatments done to each driving and validating variable
tion of downwelling SW radiation whose coefficients were
are detailed below.
optimized to obtain a zero bias. The root mean square de-
Earth Syst. Sci. Data, 13, 4331–4348, 2021 https://doi.org/10.5194/essd-13-4331-2021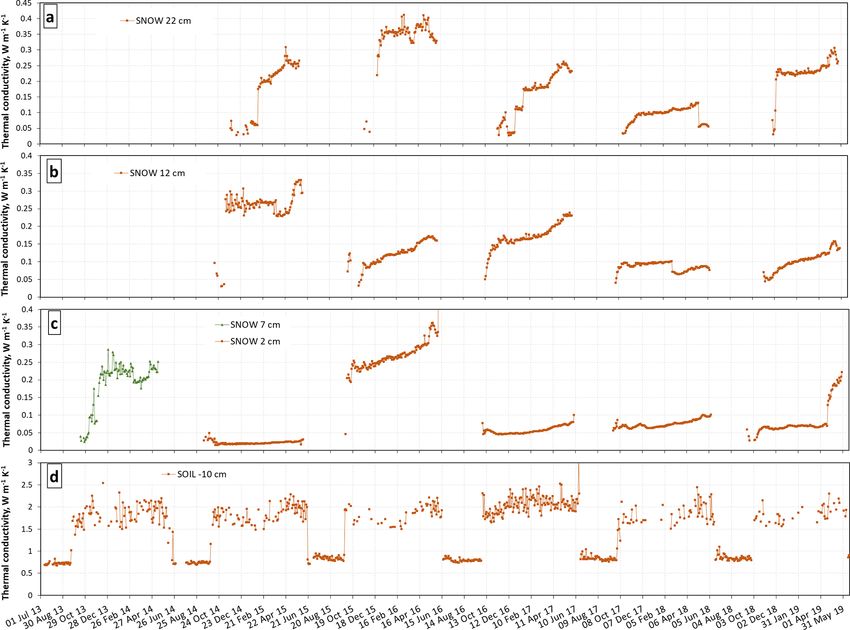
F. Domine et al.: High Arctic data for snow and land surface models                                                                    4337

Figure 3. Air humidity relative to liquid water. (a) Uncorrected data from the first RH sensor (red points), used in 2013–2014, and data from
the second RH sensor, used in 2014–2019 (blue points), after multiplication by 1.045 to ensure maximum RH reached 100 % in summer.
The ice-saturating RH values relative to supercooled water, based on the equations of Huang (2018), are also shown. (b) Corrected data for
2013–2014. Both data sets were corrected with Eq. (1) or (2) to ensure maximum winter values were at the ice-saturating RH. Only one of
the two corrected data sets is shown for clarity.

viation (RMSD) was 0.784 ◦ C. The sensor was replaced in                 the ice-saturating RH derived from Huang’s equations. To
July 2014, and there was no other data gap. TUNDRA air                   make our data fit the ice values, we used Eqs. (1) and (2) for
temperature data were compared to those from the SILA,                   the 2014–2019 and 2013–2014 data, respectively, where T is
CAMP and SALIX stations. All differences could be readily                temperature in Celsius and RH in percent.
explained by topography and basic meteorological concepts,
                                                                         RHcorrected =(RHmeasured × 1.045)
such as katabatic flow at the bottom of the valley, which led
to colder air at TUNDRA in winter. We are thus confident                                (0.0031 × T + 0.77) + 21                         (1)
in the reliability of the air temperature data. The temperature          RHcorrected = RHmeasured (0.00065 × T + 0.75) + 24              (2)
time series is shown in Fig. 2.
                                                                         3.3   Specific humidity

3.2   Relative humidity                                                  Many models use specific humidity rather than RH relative
                                                                         to water as input variable, and we therefore also provide that
Relative humidity (RH) was also provided by the HC2-S3-                  variable in grams of water per kilogram of moist air. To cal-
XT sensor. This is a HUMICAP thin-film capacitive sensor                 culate the partial pressure of water vapor, we used Eq. (17)
which provides RH relative to liquid or supercooled water,               of Huang (2018). We used PV = nRT for the gas equation
not ice. It needs to be calibrated, and the calibration pro-             of state, where P is pressure, V the volume considered, n the
vided by the manufacturer was checked. We found that for                 number of moles in V , R the gas constant and T temperature.
the second sensor, installed in 2014, RH never reached 100 %             Values used in the calculations are 18.01528 g for the molar
in summer. We therefore multiplied the value obtained by                 mass of water, 8.3145 J K−1 mol−1 for R and 28.9647 g for
1.045 so that the 100 % value was reached about as fre-                  the molar mass of dry air. The humidity time series are shown
quently as the first year. Regarding winter data, we observed            in Fig. 2.
that by plotting RH vs. temperature, maximum values devi-
ated from the ice saturation line (Fig. 3). The first sensor gave
                                                                         3.4   Wind speed
lower values for the 2013–2014 period, while the second sen-
sor gave higher values. We corrected the data so that maxi-              Data are from a cup anemometer at 2.3 m height. In winter
mum values for temperature < 0 ◦ C coincided with the ice                the anemometer frosted up during some stable weather peri-
saturation values. For the ice and supercooled water satura-             ods and was blocked about 2–3 weeks each year. Gaps were
tion vapor pressures, we used the equation of Huang (2018).              filled with data from Young anemometers at SILA, CAMP
Huang does not mention an accuracy for the supercooled                   or SALIX, adjusted using correlations. Often, two or three
water pressure values, but comparison with measured                      of the anemometers were blocked simultaneously. One gap
values available at https://www.engineeringtoolbox.com/                  could not be filled in November 2018 because all anemome-
water-supercooled-vapor-pressure-d_1910.html (last access:               ters were blocked. Since these blocking episodes all hap-
5 February 2021) revealed an excellent agreement. At                     pened under low wind speed (< 2 m s−1 ; usually much less),
−40 ◦ C, the value of Huang was 1.3 % higher than the mea-               that 2-week gap was filled with similar low-value data from
sured value (19.16 vs. 18.91 Pa). At −10 ◦ C, the difference             another period. Since the threshold value for cup anemome-
is just 0.024 % (286.57 vs. 286.50 Pa). In Fig. 3, we plotted            ters is higher than for Young anemometers, when the cup

https://doi.org/10.5194/essd-13-4331-2021                                                Earth Syst. Sci. Data, 13, 4331–4348, 2021
4338                                                      F. Domine et al.: High Arctic data for snow and land surface models

Figure 4. Raw longwave downwelling radiation measured by the CNR4. The near-zero values in winter over extended periods indicate the
presence of frost on the pyrgeometer window. The data for those periods are thus invalid.

value was 0 for extended periods, we used the value provided        true LW↓ data over those periods. These were used to de-
by the Young from CAMP. Each time, we checked that the              termine the correlation between ERA5 reanalyses (Hersbach
CAMP values were quite low, and in any case < 0.4 m s−1 .           et al., 2020) and our values. ERA5 values were noticeably
The wind speed time series is shown in Fig. 2. A flag in-           lower than CNR4 ones. For winter (i.e., here the 21 October
dicates gap-filled values (0: data; 1: gap-filled) in the data      to 14 April periods, which includes all frost-affected events)
repository. A total of 842 out of 52 202 values were gap-filled     non-frost-affected values the correlation is
(1.6 %).
                                                                    LW↓CNR4 = LW↓ERA5 × 0.7900 + 57.814 W m−2 .                 (3)
3.5    Atmospheric pressure                                         This is based on 10 850 values and R 2 = 0.50. Invalid data
                                                                    were replaced with ERA5 values modified with Eq. (3). Dur-
We did not measure atmospheric pressure. We relied on mea-
                                                                    ing the first year the CNR4 temperature sensor was not func-
surements performed by Environment and Climate Change
                                                                    tioning, preventing the temperature correction of the raw sig-
Canada (ECCC, https://climate.weather.gc.ca, last access:
                                                                    nal. The correlation between all valid CNR4 values (includ-
6 January 2021), who operate a station at Pond Inlet
                                                                    ing summer) and ERA5 values was
(72.6951◦ N, 77.9600◦ W; 60 m a.s.l.), 84.1 km to the south-
east of our site, and another station at Cape Liverpool
                                                                    LW↓CNR4 = LW↓ERA5 × 0.9233 + 41.777 W m−2 .                 (4)
(73.6681◦ N, 78.2942◦ W; 2 m a.s.l.), 79.5 km to the north-
east of our site. We present the average of both values, bear-         Equation (4), with R 2 = 0.79, was used to obtain a time se-
ing in mind that the altitude of our site is probably close         ries of LW↓ for the first year of this study. It could be argued
to 20 m. The atmospheric pressure time series is shown in           that for winter 2013–2014, Eq. (3) should be used. However,
Fig. 2.                                                             for the low LW↓ values of that period, the difference be-
                                                                    tween Eqs. (3) and (4) is small, between 0 and 10 W m−2 .
3.6    Longwave downwelling radiation                               Furthermore, a sudden change in equation may create an un-
                                                                    desirable discontinuity. A flag indicates gap-filled values (0:
The pyrgeometer provides a raw signal, which is the differ-         CNR4 data; 1: modified ERA5 data) in the data repository.
ence between LW↓ and its own LW emission. The raw data              Overall, 21 126 out of 52 202 LW↓ values were gap-filled
were corrected for the drift in sensor sensitivity, which de-       (40 %).
creased from 6.57 to 6.055 µV W−1 m2 , an 8.5 % decrease,              The CNR4 and ERA5 LW↓ values are shown in the same
assuming a constant drift over the 2193 d of use. LW↓ is then       graph in Fig. 5 for comparison. Over the whole period inves-
obtained by removing the instrument LW emission, and this           tigated, LW↓CNR4 values are higher than LW↓ERA5 values
is done using the temperature value provided by the CNR4            by an average value of 24.5 W m−2 . This large difference is
temperature sensor. Figure 4 shows that the raw signal re-          discussed and the validity of our measurements confirmed
mained close to zero over extended periods. This indicates          when we present LW↑ values in Sect. 4.2.
similar temperatures for the sensor and the source (upper at-
mosphere or clouds), which is only possible if the source is
                                                                    3.7   Shortwave downwelling radiation
close to the sensor. This is explained by the presence of frost
on the pyrgeometer window. The 5 min hourly heating by              The calibration constant for the upward-looking pyranome-
the CNF4 was therefore not sufficient to prevent frost build-       ter of the CNR4 drifted from 15.37 to 15.12 µV W−1 m2 , a
up. Figure 4 however shows some periods in winter with              1.65 % change. The data were adjusted for this drift. The
no frost, e.g., January 2016. The CNR4 temperature sensor           SW↓ radiation showed a −2 W m−2 offset, and a value of
data were used to perform the LW↓ correction and obtain the         2 W m−2 was added to all data. As for the pyrgeometer, frost

Earth Syst. Sci. Data, 13, 4331–4348, 2021                                          https://doi.org/10.5194/essd-13-4331-2021
F. Domine et al.: High Arctic data for snow and land surface models 4339
Figure 5. Time series of downwelling longwave radiation (from our CNR4 pyrgeometer and from ERA5 reanalyses), downwelling shortwave
radiation (both from our CNR4 pyranometer and from ERA5 reanalyses), hourly precipitation and cumulated seasonal precipitation (snow
and snow-free periods).
built up on the upper pyranometer window. However, since nometer, while it remained on its north side, scattering extra
there is no SW↓ to measure at 73◦ N most of the winter, radiation into the pyranometer. The pyrgeometer window is
data are overall less affected. In late March and early April flat, so frost there is less likely to be sublimated by radiation.
and to a lesser extent in late October, some albedo values Detailed data analysis showed that this process was more in-
were anomalously low, around 0.4. The corresponding SW↓ tense for solar zenith angles between 71 and 81◦ . While we
values were anomalously high (Fig. S5), much higher than cannot explain this in full detail, it is consistent with the idea
ERA5 values, and this happened during periods when pyrge- that there exists an optimal geometry to maximize the scat-
ometer data indicated the presence of frost and when the sky tering effect we propose. For those SW↓ data, we replaced
was clear. Our CNR4 is over essentially flat terrain, so slope them with corrected ERA5 data. For non-frosted conditions,
effects (Picard et al., 2020) can be ruled out. We propose that ERA5 and CNR4 values are extremely well correlated:
frost sublimated on the south side of the hemispherical pyra-
nometer window, allowing direct radiation to reach the pyra-
SW↓CNR4 = SW↓ERA5 × 0.9956 − 3.7033 W m−2 . (5)
https://doi.org/10.5194/essd-13-4331-2021 Earth Syst. Sci. Data, 13, 4331–4348, 20214340 F. Domine et al.: High Arctic data for snow and land surface models
The RMSD is 19.51 W m−2 . For frost-affected periods, we of the air temperature when observations at the Pond Inlet
therefore used Eq. (5) to obtain SW↓ values. However, since airport indicated that precipitation was snow (on the ECCC
some ERA5 values were probably underestimated, this re- web site) reveals that this threshold is sensible. We therefore
sulted in some albedo values > 1, which is not consistent used the gauge data from both ECCC sites. We determined
with a sound radiation budget. Some data users may de- the phase at each site from the temperature there, also given
cide to modify some of the ERA5-derived SW↓ values pre- by ECCC. Lastly, we corrected the amount of precipitation
sented here to ensure a reasonable albedo value, probably using the local wind speed given by ECCC. To obtain pre-
around 0.8. However, we left the ERA5-derived SW↓ val- cipitation at our site, we averaged both ECCC values and
ues unchanged, leaving decisions regarding modification to determined the phase at our site from our temperature mea-
the data users. A flag specifies when modified ERA5 val- surement.
ues were used (0: CNR4 data; 1: modified ERA5 data) in There were a few data gaps in the ECCC data sets. In
the data repository. Overall, 2550 out of 52 202 SW↓ val- that case we just used data from one of the two sites. There
ues were gap-filled (4.9 %). Finally, instrument noise yielded was a gap at Cape Liverpool from 30 November 2017 to 15
non-zero data even during the polar night. We set SW↓ to 0 April 2018 (115 d) and two gaps at Pond Inlet from 12 to 29
when the ERA5 reanalysis value was 0. April 2016 (18 d) and 13 February to 11 April 2017 (58 d).
A slight tilt due to ground freezing and thawing, always There was also a 24 d period from 8 September to 1 October
less than 1.5◦ and usually less than 1◦ , was observed most 2017 when our gauge at the CAMP site functioned well and
years on the CNR4 during maintenance. Given the generally measured a greater amount of precipitation than the ECCC
high solar zenith angle, this may significantly affect SW↓ gauges. During that period, we therefore used the CAMP
radiation measurement under clear-sky conditions. However, data. Figure 5 shows hourly precipitation time series, sepa-
given the excellent correlation with ERA5, we conclude that rated as rain or snow. Overall, considering errors in under-
these effects were probably not important. We are also pro- catch correction, the distance between the instruments and
viding ERA5 data for comparison but see no objective reason our site, and the instruments’ noise, we estimate the error in
not to recommend our CNR4 data over ERA5 data. The SW the precipitation data provided to be around 20 %.
radiation time series, both from CNR4 and ERA5, are shown We also provide cumulated seasonal precipitation data for
in Fig. 5. periods when there was snow on the ground and periods
when the ground was snow-free. Snow onset is the first day
3.8 Precipitation
when there is a continuous and permanent snow cover. Often,
the first snowfall melted partially or completely so that there
There is a Geonor 200 precipitation gauge with a single al- is some arbitrary character in determining the snow onset
ter shield at the CAMP site, 1.7 km from our TUNDRA site, date. For example, on 7 September 2017 a significant snow-
but most of the time, it did not function properly. We there- fall resulted in complete snow cover. That snow had mostly
fore relied mostly on data from the ECCC Geonor gauges melted when an important snowfall that lasted the whole sea-
at Pond Inlet, 84.1 km to the southeast, and Cape Liverpool, son happened on the evening of 17 September so that we
79.5 km to the northeast (Fig. 1). Geonor gauges measure the retain 17 September as the snow onset date. A picture on
weight of a glycol bath into which precipitation falls. There 17 September (Fig. S6) shows what was left of the 7 Septem-
is noise in the data, for example due to wind, which pro- ber snowfall to illustrate our choice. Meltout date is when the
duces small positive and negative precipitation events that winter snow cover has almost completely disappeared. Large
need to be corrected and filtered. ECCC does not detail their snow drifts melt later. A picture in Fig. S6 shows these re-
procedure. The negative signals from their gauges appear to maining drifts on 8 June 2019, when we consider the snow
have been compensated (e.g., by reducing the positive sig- to have melted out. Occasional late spring snowfalls that oc-
nal from the subsequent positive event). There are numerous cur after meltout were added to the summer precipitation.
small (< 0.2 mm in their hourly data) isolated positive events, Snow onset and meltout dates were determined from snow
and we wondered whether those might just be noise. We ex- gauges (present at TUNDRA and CAMP) and, when avail-
amined isolated events that had no other precipitation 10 h able, time lapse photographs. For 2013 and 2014, before the
before and after them. By comparing these events to our time deployment of several time lapse cameras in the valley, we
lapse photos and by considering the observer’s remarks at also used satellite images to determine snow dates, as de-
Pond Inlet, we concluded that most of these isolated events tailed in Domine et al. (2018b). Table 2 reports the snow on-
were real, even though about 30 % of them may be noise set and meltout dates that we used. Cumulated seasonal pre-
because for example, our cameras revealed blue-sky condi- cipitation time series are shown in Fig. 5. Note that winter
tions. We estimate that errors due to such noise amount to 2013–2014 was an exceptionally low-snow year.
less than 4 mm yr−1 . Precipitation needs to be corrected for
undercatch under windy conditions, and we used the equa-
tions of Kochendorfer et al. (2017) for rain and snow. The
threshold for rain and snow was set at +0.5 ◦ C. Examination
Earth Syst. Sci. Data, 13, 4331–4348, 2021 https://doi.org/10.5194/essd-13-4331-2021F. Domine et al.: High Arctic data for snow and land surface models 4341
Table 2. Snow onset and meltout dates at the TUNDRA site, used 0.8 during snow-covered periods are due to the use of modi-
to determine cumulated seasonal precipitation. fied SW↓ ERA5 values, while SW↑ are all from the CNR4.
A flag in the data file indicates which albedo data used
Snow year Snow onset Meltout ERA5-derived SW↓ values (0: CNR4; 1: modified ERA5).
2013–2014 11 October 2013 7 June 2014
2014–2015 12 September 2014 13 June 2015 4.2 Longwave upwelling radiation and surface
2015–2016 1 October 2015 15 June 2016 temperature
2016–2017 3 October 2016 18 June 2017
2017–2018 17 September 2017 15 June 2018 Both the downward-looking pyrgeometer and the IR120 sur-
2018–2019 8 October 2018 7 June 2019 face temperature sensor provide information on LW↑ radia-
tion. The CNR4 LW↑ sensor sensitivity changed from 6.38 to
5.95 µV W−1 m2 between 2013 and 2019, a 7.23 % change,
4 Validating data quality check and correction and the signals were corrected accordingly. As for the LW↓,
no data are available the first year. The IR120 provides sur-
Data for validation consist of monitoring data and snow pit face temperature Ts but was not recalibrated. Ts and LW↑
measurements and observations every year in May except in are linked by the Stefan–Boltzmann equation so that IR120
2016. data may be used to fill the first year of missing data from the
CNR4 LW↑. Both data sets are quite similar. The RMSD be-
4.1 Shortwave upwelling radiation and albedo
tween the CNR4 LW↑ and the IR120 LW↑ calculated from
Ts using a surface emissivity ε = 1 for the 2014–2019 pe-
CNR4 values for SW↑ radiation were corrected for sensitiv- riod is 7.51 W m−2 . The RMSD can be reduced if different ε
ity drift, similarly to SW↓ radiation. The sensitivity changed values are used during snow-covered and snow-free periods.
from 15.74 to 15.39 µV W−1 m2 between 2013 and 2019, For the 2014–2015 winter, RMSD = 6.12 W m−2 is obtained
a 2.27 % change. The downward-looking pyranometer does for ε = 1.027. For the 2015 summer, RMSD = 10.54 W m−2
not frost up. Values were set to zero when ERA5 SW↓ values is obtained for ε = 0.991. Obviously ε cannot be > 1, and
were zero. The error due to the tilt of the CNR4 discussed in the 1.027 value only indicates a systematic shift between
the case of the downwelling radiation is probably negligible both sensors. This is not surprising as the wavelength range
here since radiation is diffuse. SW↑ values are affected by sensed by the IR120 is narrower (Table 1), and small errors
the presence of the tripod and of the solar panel it carries. in the calibrations are inevitable. By comparing CNR4 drift-
Ideally, corrections can be performed, as done, for example, corrected data and IR120 uncorrected data over 5 years, we
by Wright et al. (2014). Values given here are uncorrected did not however note any detectable drift in the IR120 sensi-
for the presence of the tripod and solar panel, but we show tivity. For the first year, the CNR4 LW↑ data gap was filled
in Fig. S7 the geometry of the system so that the calculations with the IR120 data, with the optimal emissivities found
could be performed. However, Wright et al. (2014) had a ge- above for the snow-covered and snow-free periods. A flag
ometry less favorable than ours, and their correction was on in the data file indicates IR120-filled data. CNR4 LW↑ time
the order of 1 % so we do not expect this correction to be es- series and surface temperature time series from IR120 are
sential. Values thus obtained are reported in Fig. 6. The high plotted in Fig. 6. IR120 data have not been modified.
SW↑ value of 843 W m−2 on 3 June 2018 at noon local sum- We compared our CNR4 LW↑ data with ERA5. ERA5
mer time (UTC−4) is most likely real since it corresponds to LW↑ was on average 16.7 W m−2 lower, showing that ERA5
a high SW↓ value of 1151 W m−2 at the same time (Fig. 5). underestimates the temperature of the surface. The simplest
Other high values also coincide in the SW↑ and SW↓ data. explanation is that ERA5 LW↓ is underestimated, and this
These high values can be caused by thin clouds over snow reduces surface warming. This confirms that our LW↓ data,
which cause multiple reflections and amplify radiation. Par- which are on average 24.5 W m−2 higher than ERA5, are
tial cloud cover can also lead to significant radiation ampli- probably correct, and we recommend their use over ERA5
fication. These effects were predicted long ago (Nack and for our site.
Green, 1974) and have been evidenced by studies focusing
on UV radiation, with amplification sometimes exceeding a 4.3 Snow depth
factor of 2 (McKenzie et al., 1998; Weihs et al., 2000; Lee
et al., 2015), but the processes are similar for visible wave- Continuous snow depth data from the TUNDRA snow gauge
lengths and very likely explain these high values. ERA5 val- are shown in Fig. 7. To facilitate reading, snow-free periods
ues do not seem to account for these processes, and this is were assigned a snow depth value of zero. However, snow
one reason why we recommend the use of our SW↓ data over depth is highly spatially variable because of the relief at the
ERA5. 10 to 20 m scale in the ice-wedge polygon terrain. Therefore,
Albedo obtained from the SW↑ / SW↓ ratio is shown in additional manual snow depth measurements were taken in
the same panel as SW↑ in Fig. 6. Values very different from May 2014, 2015, 2017, 2018 and 2019 at several hundred
https://doi.org/10.5194/essd-13-4331-2021 Earth Syst. Sci. Data, 13, 4331–4348, 20214342 F. Domine et al.: High Arctic data for snow and land surface models
Figure 6. Time series of SW↑ radiation from the CNR4 radiometer, albedo, LW↑ radiation from the CNR4 radiometer and surface temper-
ature from the IR 120 infrared sensor. Most albedo values over snow-covered surfaces that are very different from 0.8 are due to the use of
ERA5 SW↓ values.
Figure 7. Time series of snow depth monitored by an automatic snow gauge. The averages of over 100 spot measurements in mid-May
around the TUNDRA site are also shown for 5 of the 6 years.
Table 3. Mean values and standard deviation of snow depths mea- random spots around the tundra site. The means and stan-
sured around the TUNDRA site in May. dard deviations are shown in Table 3. Snow depth measure-
ments were also done in numerous spots in the whole valley.
Date Mean depth Standard deviation This confirmed that spring 2018 was indeed the snowiest year
14 May 2014 16.2 cm 13.7 cm we experienced, and spring 2014 had by far the lowest snow
12 May 2015 25.3 cm 13.1 cm depth everywhere in the valley. The snow depth data of Ta-
May 2016 No data No data ble 3 are therefore representative of the climatology at least
13 May 2017 41.0 cm 10.9 cm at the 20 km scale.
14 May 2018 44.5 cm 13.4 cm
17 May 2019 29.5 cm 13.8 cm
4.4 Snow temperature
Snow temperatures were measured with Pt100 thermistors
installed in July 2014. For the 2013–2014 season, we provide
Earth Syst. Sci. Data, 13, 4331–4348, 2021 https://doi.org/10.5194/essd-13-4331-2021F. Domine et al.: High Arctic data for snow and land surface models 4343
Figure 8. Time series of snow temperature from Pt100 thermistors and ground temperature and liquid water volume fraction from 5TM
probes. In 2013–2014, snow temperature data were limited to 7 cm height (low snow height that year) with a reading from the TP08 probe
every other day at 05:00 local summer time (UTC−4). The heights of the snow temperature sensors were lowered by 2 cm in July 2018. The
vertical black line in July 2018 shows the date of this height change (H. ch. in legend box). There are negative spikes due to instrumental
noise on the soil temperature at 15 cm depth data until 2016 and on the 21 cm depth data in summer 2016.
temperature given by the TP08 heated needle probe, which 4.5 Ground temperature and liquid water volume
produced one value every other day at 05:00 local summer content
time, when a thermal conductivity measurement was per-
formed. In 2014–2015, there were only two thermistors, at These variables were measured using 5TM sensors from
heights of 2 and 17 cm. In July 2015, thermistors were added Decagon placed within 1 m of the TP08 post. The deepest
at 7, 27 and 37 cm. In July 2018, all five thermistors were sensor was placed at the base of the summer thawed layer.
lowered by 2 cm to 0, 5, 15, 25 and 35 cm. All data > 0 ◦ C Decagon documentation specifies that “the 5TM determines
were deleted. Data when no snow was present on the ground volumetric water content (VWC) by measuring the dielectric
have also been deleted, based on snow height data or time constant of the media using capacitance/frequency domain
lapse images. However, the snow gauge is about 6 m away technology. The sensor uses a 70 MHz frequency, which min-
from the thermistor post, and only the top of the post is in the imizes textural and salinity effects, making the 5TM accu-
field of view of the camera. Another criterion for the pres- rate in most soils. The 5TM measures temperature using an
ence of snow is the temperature gradient in the set of sensors. onboard thermistor.” Regarding temperature, offsets of up to
When snow is present, the lowest sensor is expected to be 0.5 ◦ C, constant over time, were noticed during soil freezing.
warmer, at least until spring warm up, when the temperature All temperatures were corrected so that T = 0 ◦ C during the
gradient reverses. However, all these criteria are not 100 % zero-curtain periods. Regarding VWC, the calibration pro-
certain, and we may have included some data in the absence vided by Decagon was used. For mineral soils, a 2 % accu-
of snow. Data from upper sensors not covered by snow have racy is claimed by the manufacturer. For other soils, 3 % is
not been deleted. Snow temperature data are shown in Fig. 8. claimed. This lower accuracy probably applies to the top two
sensors at 2 and 5 cm depth, where the soil has a significant
organics content. Due to battery failure, there is a data gap
between 20 March and 12 July 2016. Before March 2016,
the temperature sensor at 15 cm depth showed very frequent
spikes in summer that gave readings lowered by 1.5 to 3 ◦ C,
https://doi.org/10.5194/essd-13-4331-2021 Earth Syst. Sci. Data, 13, 4331–4348, 20214344 F. Domine et al.: High Arctic data for snow and land surface models
Figure 9. Time series of snow thermal conductivities at heights of (a) 22 cm, (b) 12 cm and (c) 7 cm for the first winter and 2 cm for
subsequent winters and (d) soil thermal conductivity at 10 cm depth. In 2013–2014 there was insufficient snow to cover the top two TP08
probes, which were at heights of 17 and 27 cm.
which is why the plots appear noisy. The same applies to the
21 cm sensor in August 2016. The causes are unknown. Data
are shown in Fig. 8.
4.6 Snow and soil thermal conductivity
Measurement methods using the TP08 heated needle probe
are detailed in Domine et al. (2015). Data from the first three
winters have already been reported in Domine et al. (2016b)
and Domine et al. (2018a). Figure 9 shows measurements
for all 6 years at three heights. In 2013–2014, only the 7 cm
needle was covered. In July 2014 the sensors were lowered
to 2, 12 and 22 cm.
Soil thermal conductivity values only show significant
Figure 10. Vertical profiles of snow density and SSA measured
variations between the thawed and frozen state, as frequently
within the TUNDRA polygon in mid-May of 5 years.
observed in soils (Smerdon and Mendoza, 2010). Thawed
and frozen values are around 0.75 and 1.8 W m−1 K−1 , re-
spectively, with little variations between years. Values may
Earth Syst. Sci. Data, 13, 4331–4348, 2021 https://doi.org/10.5194/essd-13-4331-2021F. Domine et al.: High Arctic data for snow and land surface models 4345
vary with water or ice content, but this was not investigated 5 Data availability
here. In the frozen state, many heating curves were of insuf-
ficient quality because of the limited heating, and those data The driving and validating data, including snow pit
were discarded (see Domine et al., 2015, for details), hence data, are available on the Nordicana D repository,
the missing data points. https://doi.org/10.5885/45693CE-02685A5200DD4C38
Snow thermal conductivity is a valuable proxy for snow (Domine et al., 2021).
type. Soft depth hoar always has a low value, and, for exam-
ple, the very low thermal conductivity value at 2 cm height in 6 Conclusion
2014–2015 (mostly < 0.035 W m−1 K−1 ) is indicative of the
presence of very soft depth hoar, as observed in May 2015 A 6-year time series of driving data for a high Arctic herb
during the field campaign. In contrast, the high values in tundra site is presented. A unique set of validation data is
2015–2016 (0.2 to 0.35 W m−1 K−1 ) indicate that depth hoar provided, which includes time series of snow and soil ther-
was probably indurated, due either to rain on snow (ROS) mal conductivity. Vertical profiles of snow density and spe-
that formed a hard refrozen layer or to high winds during pre- cific surface area in mid-May are also provided for all years
cipitation that formed a hard wind slab. On 1 October 2015 except 2016. One important objective of these data is to assist
ROS took place just after snow onset, and on 14–15 Octo- in the improvement and validation of snow physics models,
ber a 36 h storm with wind speeds exceeding 10 m s−1 and which today have great difficulties in simulating high Arctic
precipitation in excess of 10 mm took place so that either of snowpack properties. We plan to update the data sets on the
both options is possible. We could not get to Bylot Island in Nordicana D repository by adding extra years of data when-
spring 2016 for snow observations. However, snow pit obser- ever possible. The COVID-19 pandemic prevented us from
vations near Pond Inlet on 15 May 2016 indeed revealed the accessing the site in spring and summer 2020 and spring
presence of a 10 to 15 cm basal layer of indurated depth hoar. 2021, but we will do our best to maintain our effort in subse-
It has been reported that the heated needle probe method quent years.
produced a negative artifact in the measurement of snow ther-
mal conductivity (Riche and Schneebeli, 2013). A correction
algorithm has just been proposed by Fourteau et al. (2021). Supplement. The supplement related to this article is available
Briefly, the amount of correction decreases with increasing online at: https://doi.org/10.5194/essd-13-4331-2021-supplement.
snow density, and a multiplicative factor of about 1.1 for
dense wind slabs and 1.5 for soft depth hoar must be applied.
Data presented are uncorrected. Note that here the depth hoar Author contributions. FD designed the research and obtained
thermal conductivity at 2 cm in 2014–2015 has values around funding. DS and FD deployed and maintained the instruments. FD
and GL analyzed the data and prepared the data files. MP, FD and
0.02 W m−1 K−1 , lower than air, and after correction these
MBB performed the fieldwork. FD wrote the paper with input from
values will be around 0.03, more plausible for very light and
GL and comments from MBB, DS and MP.
incohesive depth hoar.
Competing interests. The authors declare that they have no con-
4.7 Field observations of snow flict of interest.
Snow density and SSA profiles cannot be monitored auto-
matically today. Instead, vertical profiles of these variables Disclaimer. Publisher’s note: Copernicus Publications remains
were measured at the TUNDRA site in mid-May 2014, 2015, neutral with regard to jurisdictional claims in published maps and
2017, 2018 and 2019 during field expeditions. The snow pits institutional affiliations.
were dug in the actual polygon of the station, within 3 m
of the snow thermal conductivity post. Data are shown in
Fig. 10. We stress here that these profiles are highly variable Acknowledgements. Logistical support was provided by the Po-
in space because of wind erosion and redeposition, which re- lar Continental Shelf Program and by Sirmilik National Park. We
sults in heterogeneous and often discontinuous snow layers. are grateful to Gilles Gauthier and Marie-Christine Cadieux for their
Attempting to reproduce the details of these profiles using decades-long efforts to build and maintain the research base of the
Centre d’Etudes Nordiques at Bylot Island. Assistance with field-
1-D model simulations is therefore not very meaningful. To
work by Mathieu Barrère, Mikael Gagnon and Marianne Valcourt
illustrate the spatial variability in these variables we report in
is gratefully acknowledged. Christophe Kinnard kindly pointed out
Figs. S8 and S9 additional profiles measured in the valley, in an error in the Campbell program for the CNR4. This allowed us to
the absence of erect vegetation, i.e., in places where there is make the best use of available radiation data. We acknowledge help-
no Salix richardsonii as these erect shrubs significantly affect ful discussions with Ghislain Picard and Marie Dumont regarding
snow properties (Domine et al., 2016a). The coordinates and LW and SW radiation and comments on the manuscript by Warwick
dates of these additional profiles are reported in Table S1. Vincent. We thank Richard Essery and Cécile Ménard (University
https://doi.org/10.5194/essd-13-4331-2021 Earth Syst. Sci. Data, 13, 4331–4348, 2021You can also read