Method validation for fatigue testing in kingpins - Tecnologia ...
←
→
Page content transcription
If your browser does not render page correctly, please read the page content below
a
Original Article - Special issue “Tribute to Prof. T. R. Strohaecker”
Method validation for fatigue testing in kingpins
Jonas Trento Buzzatti 1
Daniel Antonio Kapper Fabricio 2
Guilherme Vieira Braga Lemos 1
Hilton Rutsatz 1
Guilherme Kieckow 1
Fabiano Mattei 1
Etiene Benini Mendes 1
Abstract
Fatigue testing in kingpins consists in applying cyclic forces to simulate the mechanical loads experienced by
this automotive component in practice. In this context, Laboratório de Metalurgia Física (LAMEF) has a quality system
implemented as suggested by ISO/IEC 17025 standard, and for the test to be under the management structure, the method
must be validated. Method validation is a documented evidence that represents the standardization and indicates its suitability
for a certain purpose. Therefore, this work presents the method validation for fatigue tests in kingpins. Thus, selectivity,
linearity, sensitivity, range, precision, accuracy, stability and robustness were used as validation criteria. The interpretation
of each criterion showed a suitable performance and guaranteed the method validation according the methodology proposed.
Keywords: Method validation; Metrology; Fatigue testing; Kingpin.
1 Introduction
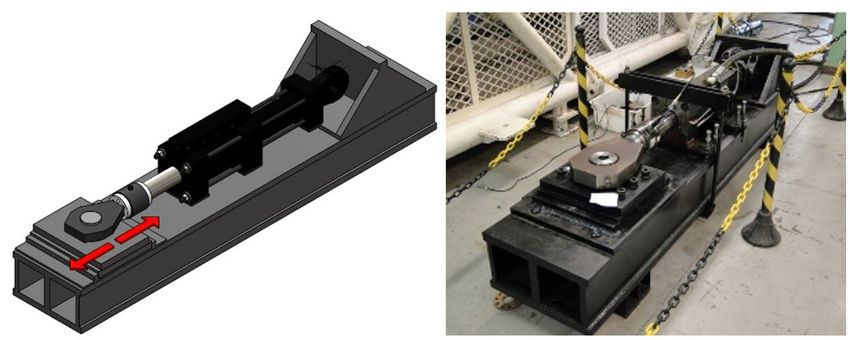
Product certification has been used to the Market and its purpose. The main acceptance criteria often considered in
is an essential requirement of consumers aiming at quality a method validation are selectivity, linearity, sensitivity, range
and cost. Besides, certification is an instrument for industrial of work, precision, accuracy, stability, and robustness [3].
development and consumer protection, being recognized Therefore, Figure 1 shows the flowchart for a typical method
by society to raise or ensure the quality level of products, validation (in the analytical cases).
services, and companies. Several approaches may be used to validate test
On February, 2008, the National Institute of Metrology, methods. Roiffé et al. [4] analysed repeatability, intermediate
Standardization and Industrial Quality (INMETRO) Ordinance accuracy, matrix interference, limit of quantification, linearity,
No. 70/2008 was formalized, establishing compulsory carryover and robustness to validate new analytical method
certification for kingpins, used on the vehicles carrying for the analysis of catecholamines and its biotransformation
dangerous goods and cargoes, and must be carried out by products.
a Product Certification Body (OCP), duly accredited by Yanamoto et al. [5] evaluated selectivity, linearity,
INMETRO. In this context, an OCP does not necessarily accuracy, precision, and sensitivity of flow cytometry-based
have to perform all the stages of certification and may hire analysis for human T cells in immunodeficient mouse blood.
accredited bodies to perform specific functions. In Brazil, Still, Khamis et al. [6] assessed linearity, precision, accuracy,
LAMEF is accredited to INMETRO, according to the NBR dilution integrity, selectivity, carryover, and stability to
ISO/IEC 17025 [1], to perform fatigue tests in kingpins. validate a method for the absolute quantification of amino/
This mechanical test is based on NBR NM-ISO 8716 [2] phonel metabolites. Therefore, many works are related to the
and consists in the application of cyclic forces that simulate biological, pharmaceutical and chemical areas [4-5,7-12].
the loads experienced by the kingpin. However, we have not found a method validation for fatigue
To verify if the quality system is properly implemented, tests in kingpins, as proposed in the current study.
the method is required to be validated. Method validation is The International Council for Harmonization (ICH) of
a documented proof that represents standardization. Also, technical requirements for pharmaceutical products of human
validation should demonstrate that the method is suitable for use [13] discussed the validation of analytical procedures
1
Laboratório de Metalurgia Física – LAMEF, Programa de Pós-graduação em Engenharia de Minas, Metalúrgica e de Materiais, PPGE3M,
Universidade Federal do Rio Grande do Sul – UFRGS, Porto Alegre, RS, Brasil.
2
Instituto Federal de Educação, Ciência e Tecnologia de Santa Catarina – IFSC, Chapecó, SC, Brasil.
*Corresponding author: jtbuzzatti@hotmail.com
2176-1523 © 2021. Buzzatti et al. Published by ABM. This is an Open Access article distributed under the terms of the Creative Commons
Attribution License, which permits unrestricted use, distribution, and reproduction in any medium, provided the original work is properly
cited.
Tecnol Metal Mater Min. 2021;18:e2473 | https://doi.org/10.4322/2176-1523.20212473 1/12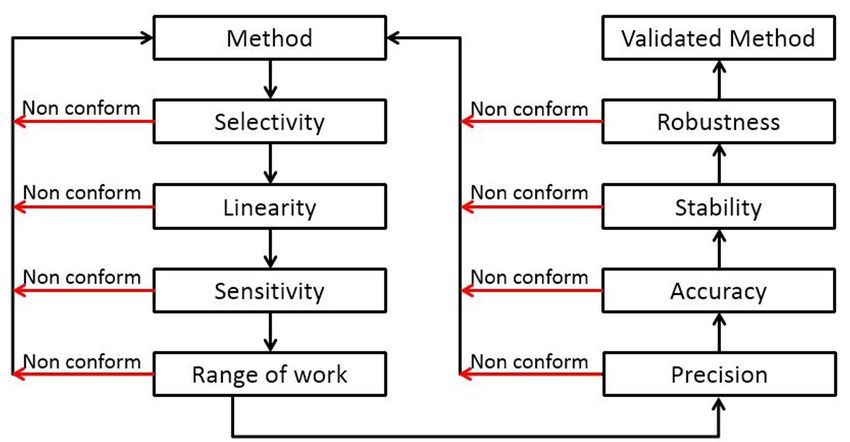
Buzzatti et al.

such as identification, impurities and quantitative tests of      tests in kingpins. Statistical tools were applied, adapted
the active fraction in samples of medicaments or related          to the data acquisition of forces for fatigue testing. Thus,
components.                                                       similarly to [3,13,15-18], the criteria used were: selectivity,
        The guide to validation and analytical quality            linearity, precision, accuracy, stability, and robustness and
control [14], developed by Brazilian government agencies,         all the forces were acquired in laboratory tests.
divides physical-chemical tests into distinct groups and
categories and indicates minimum parameters that should
                                                                  2 Materials and methods
be assessed. In the analytical methods [15], some parameters
may no longer be evaluated. It was also indicated that the        2.1 Equipment
method can be considered validated, even if some parameters
do not fit the limits established, but they are well known and            The analysed results were obtained in kingpin fatigue
adequate to the objectives to be accomplished.                    tests done at LAMEF. The tests were performed on a bench
        Methods validation is adaptable for numerous              test (250 kN capacity (Figure 2). The horizontal forces aimed
samplings and analysis. However, the validation criteria          to simulate the loads experienced by the kingpins.
for mechanical tests are not usually reported. Therefore,                 The force values were acquired through a force
the present work shows the method validation for fatigue          transducer (load cell), which was duly calibrated. A controller

Figure 1. Flowchart for a method validation [Adapted from [2]].

Figure 2. Bench test on kingpin.

Tecnol Metal Mater Min. 2021;18:e2473                                                                                        2/12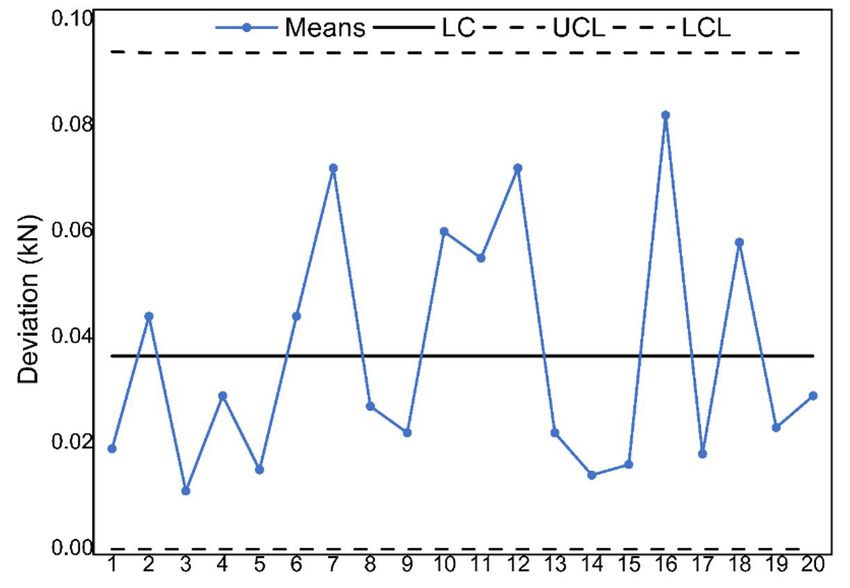
Method validation for fatigue testing in kingpins

of the MTS brand FlexText (16 bits) performed the reading                 2.3 Mechanical testing
of force values by the load cell, equipped with the Station
Manager 5.1C software. Thus, Figure 3 shows examples of                           The kingpin fatigue test consists in applying horizontal
the force transducers.                                                    forces perpendicularly to the pin axis, with a frequency of
                                                                          less than 30 Hz, during 2,000,000 cycles. In the test, the
2.2 Tested kingpin                                                        values of maximum and minimum force are acquired and
                                                                          stored in every 100 cycles for further data analysis.
       Kingpin is an automotive component that, along
with the fifth wheel, links the horse to the semi-trailer in              2.4 Evaluated criteria
automotive wagons. There are several kingpin models (two
shown in Figure 4) that can be exemplified as: 2 and 8-inch                      In this work, the criteria (Figure 1) were selected
kingpin with 8 and 12 holes and 3.5-inch kingpin with 8                   for the method validation. Therefore, criteria are briefly
and 12 holes.                                                             described below.

Figure 3. Some power transducer models available on the Market.

Figure 4. Kingpins: 2-inch with 8 and 12 holes (left) and 3.5-inch with 8 and 12 holes (right).

Tecnol Metal Mater Min. 2021;18:e2473                                                                                                 3/12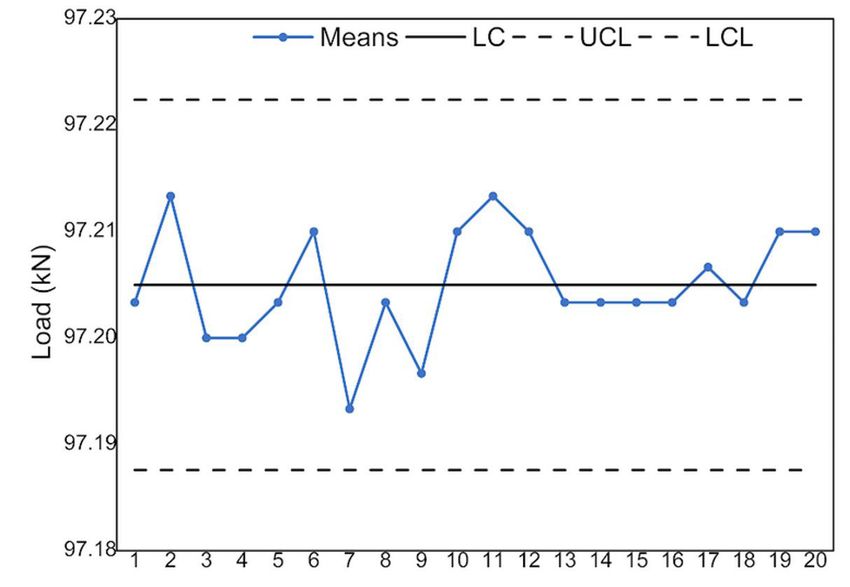
Buzzatti et al.

         When a sizing device can furnish values for one or        3 Results and discussion
higher measurands and these values are independent of each
other, it can be understood as selectivity [14]. In analytical     3.1 Selectivity
tests, it is considered as the capacity to unequivocally
consider the analyte in the presence of components, as in                  Unlike the analytical cases, in the kingpin fatigue
International Conference on Harmonisation of Technical             test, there is no simultaneous presence of more than one
Requirements for Registration of Pharmaceuticals for               measurand since the equipment is designed to apply the
Human Use [13].                                                    load on the kingpin at a time. However, it was observed
         Linearity is considered to produces outcomes              whether the methodology is indifferent to its application in
immediately proportional to a reference value, inside a            samples of distinct species (different kingpin models). Thus,
specified range [3]. The ICH Topic Q2 (R1) guideline [13]          ten cycles of four loads were analysed in varied kingpins
and the instruction on validation of analytical strategies of      (2.0 and 3.5 inches in diameter).
INMETRO [18] agree that linearity, in analytical methods,                  The F test was applied to verify sample variances
it is the capacity to produce consequences that are relative       that could be considered equal. At first, the value of Fcalculated
to the analyte in a given range.                                   was obtained according to Equation 1.
         Sensitivity establishes the variation of a response               Then, this value was compared with Ftabulated, achieved
                                                                   in the F distribution at a significance of α= 0.05 [20] for
as a characteristic of analyte concentration in analytical
                                                                   four measurements with n-1 repetitions (where n is the
tests [18]. In this sense, in Brito et al. [15], it was used
                                                                   sample size).
to define that a small distinction in analyte concentration
motives a significant variation in the value of the measured                                 S12
analytic signal in touchy methods.                                           Fcalculated =                                          (1)
                                                                                             S22
         Working range is the value for the method application.
At its decrease limit, the elements are the limits of detection    where S12 and S22 are the variances of each sample, with the
and quantification. At its upper limit, the limits depend on       greatest variance in the numerator. The criteria for interpreting
the response of the measuring tools [3]. Once the system           the results are the following [3]:
has tested its accuracy, precision and linearity, the interval
between the lowest and the best analyte awareness is viewed            •    If Fcalculated < Ftabulated: the variances can be considered
as an excellent working range [13]. Also, in Brito et al. [15],             equal, the variety of different specimens of samples
it was mentioned that the first assignment must be to pick                  has no significant effect on the precision of the
the working to vary and determine whether the signal-to-                    method.
concentration ratio is linear.                                         •    f Fcalculated > Ftabulated: the variances are not equal and
         Precision is the estimation of consequences dispersion             the variety of different specimens has an essential
between repeated independent tests, samples or similar                      effect on the accuracy.
patterns underneath defined prerequisites and can be further
described through reproducibility and repeatability [13,18].              Appendix 1 shows the nominal values of forces for each
According to Zoonen et al. [12], both usually depend on the        model and the values measured in ten repetitions. Appendix 2
analyte concentration.                                             shows the calculated values of the mean, standard deviation,
         Accuracy is the degree of agreement related to the        and variances. When Fcalculated < Ftabulated, the variances can
result of size and the reference value (accepted as valid) [19].   be considered equal, and it is interpreted that the variety of
In this context, the accuracy of an analytical test indicates      different specimens has no significant effect on the accuracy
levels of agreement between the measured cost and what is          of the method, as noted here in Equation 4.
conventional as an actual conventional value [13].                        F test:
         Stability is the capability of the approach not to                                  0.003435
demonstrate developments that slash its degree of self-belief                F=
                                                                              calculated      = 1.887                               (2)
                                                                                             0.001826
over the time [19]. It must be verified by way of simulating
the stipulations under which the laboratory submits the                                (α ; v1; v2 )
                                                                           Ftabulated F=
                                                                           =                             (0.05; 9; 4 ) 5.999
                                                                                                        F=                          (3)
samples and standards [8].
         Evaluating the robustness should examine the ability
                                                                             Fcalculated < Ftabulated                               (4)
to remain unchanged given small but controlled variations
surrounding it [10,14,18]. Some authors mentioned that the
robustness can be beneficial during the development phase [13],    3.2 Linearity
that is, in the process of previewing the method [10,15]. In
a validation process, the robustness makes available the                   The linearity was evaluated by the range of the applied
dimension of the problems that can occur when the method           loads. Thus, three cycles of six different forces were analysed.
is repeated in different conditions [15].                          The linearity of the nominal force vs applied force curve
Tecnol Metal Mater Min. 2021;18:e2473                                                                                              4/12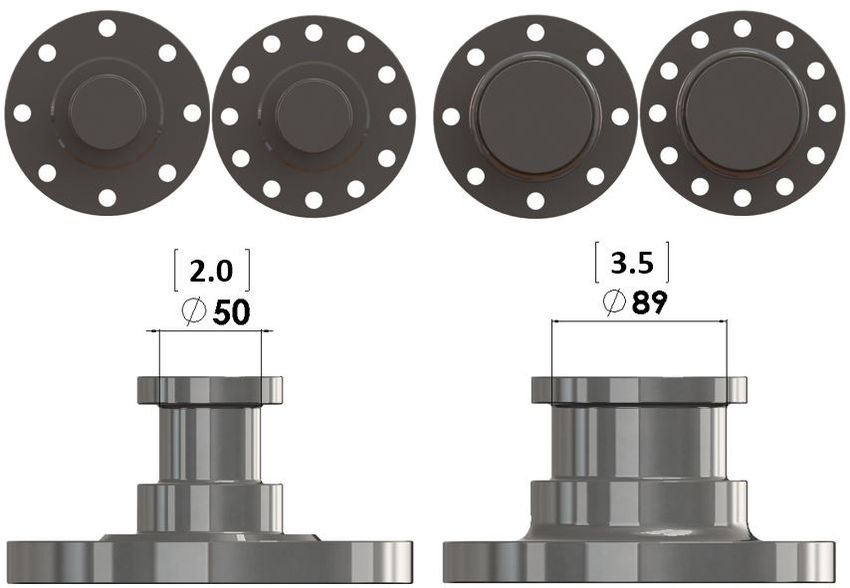
Method validation for fatigue testing in kingpins

was assessed, besides the randomness of the residual profile              the calculated value of the residuals. In Figure 5a), nominal
(Figure 5b). The Equation 5 relates the variables as follows:             force vs average of applied forces can be observed, where
                                                                          the R2 value is greater than 0.99, which is considered ideal.
         y ax + b
         =                                                       (5)      In Figure 5b), the residuals had a relatively homogeneous
                                                                          dispersion. Finally, the linearity has been proven through
Where y represents the measured response (applied force), x
                                                                          the ability to produce results directly to a reference value.
is the nominal force; a is the sensitivity and b the intersection
with the y-axis (when x= 0). For acceptance, the criterion [3]            3.3 Sensitivity
used was:
                                                                                  The sensitivity was based on the equipment resolution
    •   Ideal when r > 0.9 and R2 > 0.99                                  during the loads. To that, the technical manuals of the
    •   Waste profile should indicate no trends.                          transducer and the controller were consulted.
                                                                                  This resolution is subject to the arrangement between
        Appendix 3 shows the nominal forces and three                     its capacity and the system adopted to read the acquired data
repetitions for each value, the mean of these repetitions and             (ABNT NBR ISO 376 [19]).

Figure 5. Linearity: (a) Average of applied forces vs nominal forces; (b) Dispersion of residuals.

Tecnol Metal Mater Min. 2021;18:e2473                                                                                              5/12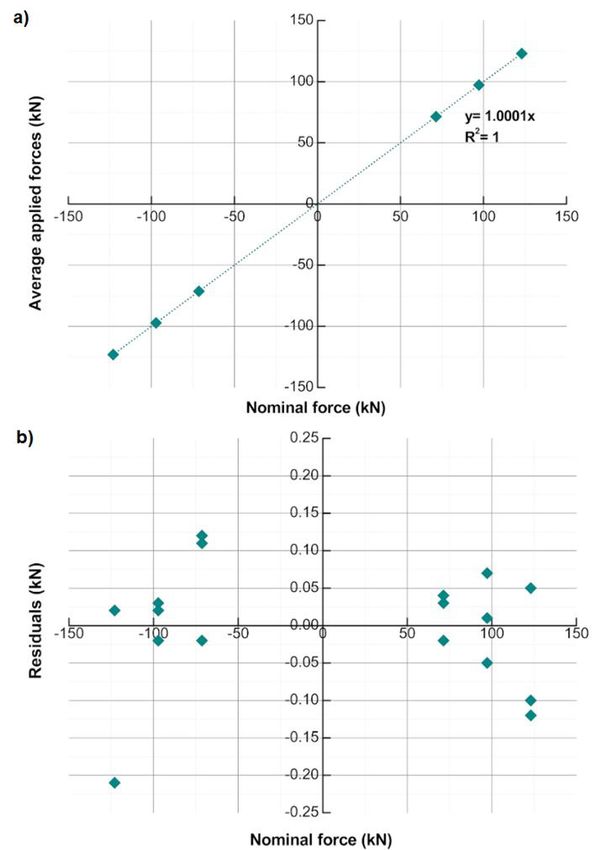
Buzzatti et al.

        According to the technical manual [21], the equipment                                        R &R       0.11
resolution is finite. The resolution is considered as the transducer
                                                                                R & R% =
                                                                                       100 ×
                                                                                                      VT
                                                                                                          100 x
                                                                                                          =
                                                                                                                1.2
                                                                                                                     9.17%
                                                                                                                     =                (10)
range (250kN) divided by the lowest reading number (216
bits). The standard for calibration of the force transducer                   In order to evaluate the R&R, what should be
determines that the resolution for digital readers must be an          considered is Associação Brasileira de Normas Técnicas [1]:
increment of the last active digit of the numerical indicator.
                                                                           •   If R&R% < 10%: the method would be considered
In the present study, the maximum resolution was 0.004 kN.
                                                                               acceptable;
3.4 Working range                                                          •   If 10% < R&R% < 30%: it would be considered
                                                                               acceptable but needs improvements;
        For the working range, the lower limit of the force
                                                                           •   If R&R% > 30%: it would be considered unacceptable.
transducer according to ABNT NBR ISO 376:2012 [19]
(Equation 6) and the maximum load capacity supported by                       Since the R&R% was less than 10%, the method is
the transducer were taken into account.                                acceptable. In addition to the repeatability and reproducibility,
                                                                       the T-test compared the performance of the two analysts.
          F=   0.02 × F f                                       (6)
           min
                                                                       The test was executed using Excel and considered α= 0.05.
Where Ff is the maximum capacity of the force transducer,              The interpretation was done considering the following [15]:
in Newton.
                                                                           •   Stat t < tcritical: analysts do not have significant
       The technical specification of the Honeywell force
                                                                               differences in their results.
transducer (3156-50K model) is 200 kN for fatigue tests [21].
Thus, the lower limit of work was (Equation 7):                            •   Stat t > tcritical: evidences that analysts have significant
                                                                               changes in their results.
               0.02 × 200000 =
          Fmín =             4000 N =
                                    4 kN                        (7)
                                                                                Table 1 presents the T-test result. The dispersion between
       All the forces applied were kept within the stipulated          analysts characterised the method as being accurate, since
limits; therefore, the method maintained an adequate                   |Stat-t| < tcritical showed that analysts do not have substantial
working range.                                                         differences between their results.

3.5 Precision                                                          3.6 Accuracy

       The performance of two analysts was used to evaluate                    To accuracy, the performance of two analysts was
the accuracy. Therefore, ten cycles of force applications              compared to the standard analyst (indicated by the signatory
were studied by two different analysts. Repeatability and              of the laboratory). Ten cycles of forces performed by two
reproducibility were observed, and the T-test was also                 analysts were compared to ten cycles of force done by the
applied. The values of the ten replications performed for              standard analyst. The evaluation considered the Z-Score
each analyst, as well as the amplitude between these values,           test. The test was carried out for each analyst individually
are presented in Appendix 4.                                           and also considered the general average of the two analysts.
       For repeatability and reproducibility (R&R%), the               Therefore, the Equation 11 for the Z-Score test was:
Equation 8 was used:
                                                                                Z=
                                                                                     ( X analyst − X standard )                       (11)
           R( average ) 0.024
        σm
        =       = = 0.021                                       (8)                              S
               d2       1.16

                                                                       Table 1. T-test
Where R (average) is the mean of the amplitude and d2 is a
parameter taken from Brasil [14], considering ten samples                                                         Analyst 1   Analyst 2
                                                                                                                     (kN)        (kN)
and two analysts.
                                                                       Mean (kN)                                   123.005     123.013
       The value of σm was multiplied by the constant 5.15 [3],
                                                                       Variance (kN2)                              0.00324     0.00334
as shown in Equation 9.
                                                                       Observations                                   10          10
          R & R = 5.15 × σ m = 5.15 * 0.021 = 0.11              (9)    Pearson correlation                          0.870
                                                                       Hypothesis of the mean difference               0
        After calculating the variation due to R&R, this (R&R)         gl                                              9
was verified by dividing its value by the total variability            Stat-t                                      -0.922
(VT) (Equation 10).                                                    P(T
Method validation for fatigue testing in kingpins
Where Xanalyst is the average obtained by the analysts (or the
general average of the two analysts), Xstandard is the average
obtained by the standard analyst, and S is the deviation
achieved by the standard analyst. This evaluation was done
according to the criteria below (Equation 12, 13 and 14):
• |Z| < 2: Satisfactory result; (12)
• 2 < |Z| < 3: Questionable result; (13)
• |Z| > 3: Unsatisfactory result. (14)
Ten measurements of the standard analysts and two
analysts are shown in Appendix 5. Based on these values,
the overall Z-score was calculated for each analyst. The Figure 6. Control chart for means.
Z-score values verified for the two analysts separately and
simultaneously, showing agreement between the measured
and standard values, confirming the accuracy of the method
(Equation 15, 16 and 17).
Z-score:
97.14 − 97.22
Z general = = −0.79 (15)
0.10
97.16 − 97.22
Z analyst 1 =
0.10
= −0.52 (16)
97.11 − 97.22
Z analyst 2 =
0.10
= −1.06 (17)
−0.79 < 2 : satisfactory result
−0.52 < 2 : satisfactory result Figure 7. Control chart for deviations.
−1.06 < 2 : satisfactory result
All Z-scores were lower than the acceptance limit Control charts for means (Equation 18, 19 and 20):
|Z| < 2. Thus, according to Z-score, this method is accurate.
=LC average
= of means 97.205 (18)
3.7 Stability
= 97.21 + ( 3 × 0.0058=
UCL ) 97.222 (19)
Twenty tests were selected, where the nominal force
was the same (97.2 kN). From each test, three values of = 97.21 − ( 3 × 0.0058=
LCL ) 97.188 (20)
applied force were taken to calculate means and deviations.
These values can be seen in Appendix 6. The evaluation was Control chart for deviations:
done by control charts for averages and deviations.
The criteria for evaluating the results were [20]: = LC mean
= of deviations 0.037 (21)
i. A value above the upper limit indicates that the UCL= 0.037 × B4= 0.037*2.57= 0.094 (22)
process is out of control;
ii. Seven consecutive values creating trend (above or B4 taken from Montgomery and Runger [20].
below the centre line) indicate that the process is out
of control. LCL= 0.037 × B3= 0.037*0.00= 0.00 (23)
Appendix 7 shows the calculated values of means and B3 also taken from Mendes [7].
deviations. The constants for the boundary calculations are
found in Montgomery and Runger [20]. The control charts 3.8 Robustness
(Figure 6 and Figure 7) did not show trends outside of their
limits that diminish the degree of confidence, both in the The robustness was analysed by two factors: factor
study of means and deviations, thus proving the stability. 1 – model of the item tested; factor 2 – analyst. Next, six
Tecnol Metal Mater Min. 2021;18:e2473 7/12Buzzatti et al.
replicates of forces applied by two analysts were selected Deviation from reproducibility:
in two kingpin models, with force applied as a response. Model 2.0 tested by two analysts (A and B):
The evaluation was done by comparing the robustness
deviation with the variation due to R&R. To calculate the = .0384 / 1.1600 0.0331 (33)
σ m 2.0 0=
robustness deviation, factors to be examined (e.g. factor A
and factor B) and two quantitative levels for each factor (A1 Model 3.5 tested by two analysts:
= σ m 3.5 0=
.0303 / 1.1600 0.0262
and A2 or B1 and B2) were considered. After six replicates Analyst “A” testing two models (2.0 and 3.5):
combining each factor (A1B1 and A1B2, A2B1 and A2B2)
and calculating their means, the factor analysis was done
=σ m A 0=
.0343 / 1.1600 0.0295 (34)
by Equations 24 and 25. Analyst “B” testing two models (2.0 and 3.5):
A1 B1 + A1 B2 A2 B1 + A2 B2 (24) = .0295 / 1.1600 0.0255 (35)
σ m B 0=
=DA −
2 2
B1 A1 + B1 A2 B2 A1 + B2 A2
0.0067 < 0.0331 (36)
=DB − (25)
2 2
Later, deviations were squared and summed to average, 0.0067 < 0.0262 (37)
as shown in Equations 26 and 27.
0.0067 < 0.0295 (38)
2
D DA + DB
= 2 2 (26)
0.0067 < 0.0255 (39)
D2
M =
2
(27)
The robustness deviation value (Sr) was lower than
The robustness deviation is calculated by Equation 28. all R&R deviation (Equation 36, 37, 38 and 39). Therefore,
S= 2× M (28) the test method is robust.
r
The deviation of the reproducibility was calculated 4 Conclusions
by Equation 5 for each factor.
This work presented the method validation for fatigue
i. Two analysts testing 2.0-inch model tests in kingpins. The findings can be summarised as follows:
ii. Two analysts testing 3.5-inch model • The validation criteria were applied in a method
iii. Two models being tested by analyst A involving mechanical forces. The interpretation of
each criterion showed excellent performance of the
iv. Two models being tested by analyst B
method and guaranteed its validation;
The comparison of the robustness deviation with • In the selectivity evaluation, Fcalculated (1.887) < Ftabulated
R&R variation was made as follows [1,22,23]: (5.999), which is satisfactory;
If Sr < σm, the method is considered robust.
• Concerning linearity, R2 was greater than 0.99, which
Ten repetitions with two varied analysts applying
the load on two different kingpin models, and their is suitable;
means are shown in Appendix 8. The amplitude measured • In the accuracy evaluation, R&R% value was 9.17%
for each analyst and model is presented in Appendix (below the 10% minimum). In addition, it can also
9. Thus, the robustness deviation (S r) is lower than be approved for accuracy because all Z-scores were
reproducibility deviation in the four cases, showing that less than 2;
the results are not sensitive to alterations of analysts and • The control charts for means and variables showed
kingpin models, demonstrating satisfactory robustness that there were no out-of-control points, thus the test
of the method. is stable;
Analyses of effects (Equation 29, 30, 31 and 32):
• Since Sr values were lower than σm, the method is
Dmodel =
( 97.1876 + 97.1948 ) − ( 97.1805 + 97.1886 ) = 0.0067 2
Dmodel = 0.0067 (29) robust;
2 2
• Sensitivity and range were not evaluated. Both criteria,
Danalyst =
( 97.1876 + 97.1886 ) − ( 97.1805 + 97.1948 ) = 0.0005 2
Danalyst = 0.0005 (30) which take into account the limit of detection of the
2 2
equipment, can be based on the result of the force
transducer;
=M
0.0067 + 0.0005
= 0.000024 (31)
2 • Considering all analysed criteria (selectivity, linearity,
sensitivity, precision, accuracy, and others), the test
2 × 0.000024 =
Sr = 0.0067 (32) method can be considered validated.
Tecnol Metal Mater Min. 2021;18:e2473 8/12Method validation for fatigue testing in kingpins References 1 Associação Brasileira de Normas Técnicas. NBR ISO/IEC 17025: 2017. Requisitos gerais para competência de laboratórios de ensaio e calibração. Rio de Janeiro: ABNT; 2017. 2 Associação Brasileira de Normas Técnicas. NBR NM-ISO 8716: 2001. Veículos rodoviários comerciais – Pino rei para quinta roda – Ensaio de resistência. Rio de Janeiro: ABNT; 2001. 3 Albano F, Raya-Rodriguez MT. Validação e garantia da qualidade de ensaios laboratoriais. Porto Alegre: Rede Metrológica RS; 2009. 4 Roiffé R, Ribeiro WD, Sardela VF, Cruz MNS, Souza KR, Pereira HMG, et al. Development of a sensitive and fast method for detection of catecholamines and metabolites by HRMS. Microchemical Journal. 2019;150:104173. 5 Yanamoto S, Matsumoto S, Shimizu H, Hirabayashi H. Quantitative application of flow cytometry for the analysis of circulating human T cells: a preclinical pharmacokinetic study. Drug Metabolism and Pharmacokinetics. 2020;35(2):207-213. 6 Khamis MM, Adamko DJ, El-Aneed A. Development of a validated LC- MS/MS method for the quantification of 19 endogenous asthma/COPD potential urinary biomarkers. Analytica Chimica Acta. 2017;989:45-58. 7 Mendes EB. Ensaios de avaliação da conformidade de produtos em visitas à certificação [dissertação]. Porto Alegre: Universidade Federal do Rio Grande do Sul; 2010. 8 Miller JN. Statistics and chemometrics for analytical chemistry. Londres: Pearson Education; 2010. 9 Oliveira CC, Granato D, Caruso MSF, Sakuma AM. Manual para elaboração de cartas de controle para monitoramento de processos de medição quantitativos em laboratórios de ensaios. São Paulo: Secretaria da Saúde; 2013. 10 Tiwari G, Tiwari R. Bioanalytical method validation: an updated review. Pharmaceutical Methods. 2010;1(1):25-38. 11 U.S. Department of Health and Human Services. Analytical procedures and methods validation for drugs and biologics-guidance for industry. Washington: U.S. Department of Health and Human Services; 2015. 12 Zoonen VP, Klooster VT, Hoogerbrugge R, Grot SM, Wiel HJV. Validation of analitycal methods and laboratory procedures for chemical measurements. Arhiv za higijenu rada i toksikologij. 1998;49(4):355-370. 13 International Conference on Harmonisation of Technical Requirements for Registration of Pharmaceuticals for Human Use. ICH Q2(R1) Validation of Analytical Procedures: Text and Methodology. Complementary Guideline of Methodology. USA: ICH; 1996. 14 Brasil. Ministério da Agricultura, Pecuária e Abastecimento. Guia de validação e controle de qualidade analítica. Brasília: Ministério da Agricultura, Pecuária e Abastecimento; 2011. 15 Brito NM, Amarante OP Jr, Polese L, Ribeiro ML. Validação de métodos analíticos: estratégia e discussão. Pesticidas: Revista de Ecotoxicologia e Meio Ambiente. 2003;13:129-146. 16 AOAC International. AOAC Official methods of analysis. Appendix D: guideline for collaborative study procedures to validate characteristics of a method of analysis. Rockville: AOAC International; 2002. p. 1-12. 17 Huber L. Validation and qualification in analytical laboratories. Boca Raton: CRC Press; 2007. 18 Instituto Nacional de Metrologia. Qualidade e tecnologia. Orientação sobre validação de métodos analíticos. Brasília: INMETRO; 2011. 19 Associação Brasileira de Normas Técnicas. ABNT NBR ISO 376: 2012. Metallic materials – Calibrations of force- proving instruments used for the verification of uniaxial testing machines. Rio de Janeiro: ABNT; 2012. 20 Montgomery DC, Runger GC. Estatística aplicada e probabilidade para engenheiros. 5. ed. Rio de Janeiro: LTC; 2012. 21 Honeiwell. Model 3156 canister load cell datasheet. Honeywell; 2008 [cited 2020 Nov 11]. Available at: https://sensing. honeywell.com/honeywell-test-and-measurement-model-3156-canister-load-cell-product-sheet-008645-1-en.pdf 22 Instituto Nacional de Metrologia. Coordenação Geral de Credenciamento. Introdução à validação de método. Brasília: INMETRO; 2006 [cited 2020 Nov 11]. Available at: http://www.inmetro.gov.br/metcientifica/palestras/ renata%20borges.pdf 23 Instituto Nacional de Metrologia, Qualidade e Tecnologia. Vocabulário Internacional de Metrologia. Conceitos fundamentais e gerais e termos associados. Brasília: INMETRO; 2011. Received: 21 Aug. 2020 Accepted: 17 Dec. 2020 Tecnol Metal Mater Min. 2021;18:e2473 9/12
Buzzatti et al.

Appendix 1. Nominal force values and kingpin models

              Nominal
  Model                  1 (kN)     2 (kN)        3 (kN)     4 (kN)    5 (kN)    6 (kN)    7 (kN)     8 (kN)    9 (kN)   10 (kN)
               Points
   2.0”         97.20     97.13      97.19         97.17      97.23     97.19     97.13     97.16      97.14     97.10     97.20
                71.40     71.43      71.44         71.38      71.39     71.43     71.41     71.44      71.38     71.39     71.41
               -71.40    -71.42     -71.28        -71.29     -71.41    -71.39    -71.34    -71.40     -71.48    -71.43    -71.32
               -97.20    -97.19     -97.14        -97.14     -97.17    -97.14    -97.15    -97.17     -97.22    -97.13    -97.14
   3.5”        123.00    123.05     122.90        122.88     123.07    123.03    122.96    123.00     123.01    122.95    122.94
                97.20     97.27      97.15         97.21      97.15     97.19     97.14     97.23      97.17     97.17     97.21
               -97.20    -97.18     -97.22        -97.17     -97.23    -97.23    -97.15    -97.20     -97.16    -97.17    -97.22
              -123.00   -122.98    -122.98       -123.21    -123.06   -123.04   -123.08   -123.02    -122.91   -122.95   -123.00

Appendix 2. Calculation and mean of variances

                                  Nominal Points           Measurements Average      Standard Deviation           Variance
            Model
                                      (kN)                         (KN)                      (kN)                   (kN2)
             2.0”                     97.20                        97.16                   0.038114               0.001453
                                      71.40                        71.41                   0.024907               0.00062
                                     -71.40                       -71.38                   0.066016               0.004358
                                     -97.20                       -97.13                   0.029521               0.000871
                                                                Mean of the variances (kN2) 0.001826
             3.5”                     123.00                      122.98                   0.064612               0.004175
                                       97.20                       97.149                  0.040524               0.001642
                                      -97.20                      -97.19                   0.03147                0.00099
                                     -123.00                     -123.02                   0.083502               0.006973
                                                                Mean of the variances (kN2) 0.003445

Appendix 3. Values of the nominal forces, its three repetitions, calculated values of means and residuals

            Points                Nominal Force                Applied Force       average applied forces        Residuals
                                      (kN)                         (kN)                     (kN)                   (kN)
               1                     123.00                       123.05                   122.95                   0.05
               2                                                  122.90                                           -0.10
               3                                                  122.88                                           -0.12
               4                        97.20                      97.27                    97.21                   0.07
               5                                                   97.15                                           -0.05
               6                                                   97.21                                            0.01
               7                        71.40                      71.43                    71.42                   0.03
               8                                                   71.44                                            0.04
               9                                                   71.38                                           -0.02
              10                        -71.40                    -71.42                   -71.33                  -0.02
              11                                                  -71.28                                            0.12
              12                                                  -71.29                                            0.11
              13                        -97.20                    -97.18                   -97.19                   0.02
              14                                                  -97.22                                           -0.02
              15                                                  -97.17                                            0.03
              16                     -123.00                     -122.98                  -123.06                   0.02
              17                                                 -122.98                                            0.02
              18                                                 -123.21                                           -0.21

Tecnol Metal Mater Min. 2021;18:e2473                                                                                        10/12
Method validation for fatigue testing in kingpins
Appendix 4. Replication values of the two analysts and amplitude
Cycles Analyst 1 (kN) Analyst 2 (kN) Amplitude (kN)
1 123.026 123.051 0.025
2 123.007 122.982 0.025
3 123.018 122.988 0.030
4 122.996 123.019 0.023
5 122.871 122.896 0.025
6 123.091 123.116 0.025
7 123.035 123.039 0.004
8 122.968 123.018 0.050
9 123.032 123.022 0.010
10 123.002 122.979 0.023
Average amplitude 0.024
Appendix 5. Repetitions of the group coordinator as standard, of analyst 1 and analyst 2
Sample Standard (kN) Analyst 1 (kN) Analyst 2 (kN)
1 97.40 97.13 97.12
2 97.25 97.19 97.16
3 97.32 97.17 97.06
4 97.18 97.23 97.09
5 97.18 97.19 97.10
6 97.18 97.13 97.12
7 97.21 97.16 97.09
8 97.21 97.14 97.12
9 97.22 97.10 97.13
10 97.00 97.20 97.09
Averages 97.22 97.16 97.11
Deviation 0.10 0.04 0.03
Analysts general average 97.14
Appendix 6. Values of forces acquired during twenty different trials
1 (kN) 2 (kN) 3 (kN) 4 (kN) 5 (kN) 6 (kN) 7 (kN) 8 (kN) 9 (kN) 10(kN)
97.18 97.26 97.21 97.22 97.20 97.16 97.18 97.18 97.17 97.21
97.22 97.20 97.20 97.21 97.22 97.23 97.13 97.20 97.20 97.15
97.21 97.18 97.19 97.17 97.19 97.24 97.27 97.23 97.22 97.27
11 (kN) 12 (kN) 13 (kN) 14 (kN) 15 (kN) 16 (kN) 17 (kN) 18 (kN) 19 (kN) 20 (kN)
97.28 97.13 97.19 97.19 97.20 97.12 97.23 97.14 97.19 97.24
97.19 97.28 97.23 97.21 97.19 97.21 97.19 97.26 97.21 97.18
97.17 97.22 97.19 97.21 97.22 97.28 97.20 97.21 97.23 97.21
Appendix 7. Means and deviations acquired during twenty different trials
1 2 3 4 5 6 7 8 9 10
Means 97.20 97.21 97.20 97.20 97.20 97.21 97.19 97.20 97.20 97.21
Deviations 0.019 0.044 0.011 0.029 0.015 0.044 0.072 0.027 0.022 0.060
11 12 13 14 15 16 17 18 19 20
Means 97.21 97.21 97.20 97.20 97.20 97.20 97.21 97.20 97.21 97.21
Deviations 0.055 0.072 0.022 0.014 0.016 0.082 0.018 0.058 0.023 0.029
Tecnol Metal Mater Min. 2021;18:e2473 11/12Buzzatti et al.
Appendix 8. Ten repetitions of loads applied by two different analysts in two distinct models of kingpins
Repetitions 2.0 – analyst A (kN) 3.5 – analyst B (kN) 2.0 analyst B (kN) 3.5 analyst A (kN)
1 97.1290 97.1485 97.1601 97.1744
2 97.1857 97.2116 97.1447 97.1743
3 97.1676 97.1470 97.1995 97.2107
4 97.2256 97.1938 97.1982 97.2024
5 97.2214 97.1856 97.2048 97.1863
6 97.1925 97.1745 97.2301 97.1984
7 97.2198 97.1935 97.1847 97.1427
8 97.2137 97.1827 97.2214 97.1941
9 97.1896 97.1410 97.1537 97.1994
10 97.1316 97.2264 97.2513 97.2037
Means 97.1876 97.1805 97.1948 97.1886
Appendix 9. Factor amplitudes compared separately
Model 2.0 / Model 3.5 / Analyst A / Analyst B /
Repetitions
analyst A and B analyst A and B model 2.0 and 3.5 model 2.0 and 3.5
1 0.0312 0.025969 0.045453 0.011672
2 0.0410 0.037266 0.011383 0.066891
3 0.0319 0.063726 0.043054 0.052578
4 0.0274 0.008555 0.023218 0.004375
5 0.0166 0.0007 0.0351 0.0192
6 0.0376 0.0239 0.0059 0.0556
7 0.0351 0.0508 0.0771 0.0088
8 0.0077 0.0114 0.0196 0.0387
9 0.0360 0.058375 0.009789 0.012625
10 0.1197 0.02275 0.072086 0.024867
Means 0.0384 0.0303 0.0343 0.0295
Tecnol Metal Mater Min. 2021;18:e2473 12/12You can also read