METHODOLOGICAL AND DATA INFRASTRUCTURE REPORT ON ROMA POPULATION IN THE EU - Anikó Bernát & Vera Messing
←
→
Page content transcription
If your browser does not render page correctly, please read the page content below

METHODOLOGICAL AND
DATA INFRASTRUCTURE
REPORT ON ROMA
POPULATION IN THE EU

Anikó Bernát & Vera Messing

August, 2016

Abstract
This paper aims to contribute to the policy discussion on the challenges of mapping the realities of
Roma living conditions, and attempts to propose cross-country comparative, relevant indicators of
Roma inclusion, which are acutely needed for evidence-based policy making. The reason for the
special attention devoted to the situation of the Roma population is clear: a large group of EU
citizens, 10-12 million people is living in much worse conditions, and with fewer opportunities for
upward mobility, than their peers or neighbours. If these people remain excluded, uneducated, jobless
and mired in deep poverty, it not only blights their own lives and determinates the possibilities of the
next generations, but also has a significant impact on life for the majority, through burdens imposed
on the welfare system and the reduced capacity of the local labour markets. Social indicators based
on statistical and survey data are essential to provide clear and comprehensive evidence for policy
makers. At present, evidence-based policy making aimed at Roma inclusion faces serious limitations,
because basic information is lacking about Roma people’s social and economic situation. The paper
addresses issues related to measuring Roma inclusion and the outcomes of EU wide and national
policies aiming at this population. In this effort the paper first outlines the political and conceptual
framework and describes availability and limitations of data on Roma populations. In a next section
it comparatively overviews indicators of Roma inclusion applied by National Roma Inclusion Strate-
gies in 16 EU Member States and critically assesses them. Finally, it proposes alternative indicators
that reflect challenges of Roma inclusion in a comprehensive, multidimensional way and discusses
the possible data sources as well as gaps in available data.

    This report constitutes Milestone 20.3, for Work Package 20 of the InGRID project.

    August 2016

    © 2016 – InGRID, Inclusive Growth Research Infrastructure Diffusion – project number 312691

    General contact: inclusive.growth@kuleuven.be
    p.a. InGRID
         HIVA - Research Institute for Work and Society
         Parkstraat 47 box 5300, 3000 LEUVEN, Belgium

    For more information bernat@tarki.hu; messingv@socio.mta.hu

    Please refer to this publication as follows:
    Bernát, A., & Messing, V. (2016). Methodological and data infrastructure report on Roma population in the
    EU (InGRID Working Paper MS20.3). Budapest: TÁRKI, Hungarian Academy of Sciences.

    Information may be quoted provided the source is stated accurately and clearly.
    This publication is also available via http://www. Inclusivegrowth.be/project-output

    This publication is part of the InGRID project, this project has received funding from the European Union’s
    Seventh Programme for Research, Technical Development and Demonstration under Grant Agreement
    No 312691.
    The information and views set out in this paper are those of the author(s) and do not necessarily reflect
    the official opinion of the European Union. Neither the European Union institutions and bodies nor any
    person acting on their behalf may be held responsible for the use which may be made of the information
    contained therein.

                                                          European policy-oriented research can and must deliver useful
                                                          contributions to tackle the Europe 2020 challenges of Inclusive
                                                          Growth. Key tools in this social sciences research are all types of
                                                          data earning statistics, administrative social data, labour market
                                                          data, surveys on quality of live or working conditions, policy
                                                          indicators. The project aims to integrate and optimise these
                                                          existing European data infrastructures and accompanying
Contents

1.    Introduction                                                                        5
1.1   Why monitor specifically the Roma people and their social inclusion?                5

2.    Political and conceptual framework on inclusion of the Roma                         6
2.1   European Political Framework                                                        6
      2.1.1  Decade of Roma Inclusion (2005–2015)                                         6
      2.1.2  Europe 2020 Agenda (2010–2020)                                               7
      2.1.3  EU Framework Strategy for National Roma Integration Strategies (2011)        7
2.2   The concept of integration and the Roma – clarifications in brief                   8
      2.2.1  Understanding and defining integration/inclusion                             8
      2.2.2  Who is a Roma?                                                              10

3.    Overview of existing indicators and data sources                                   12
3.1   Potential data sources and problems with them                                      12
3.2   Indicators applied by National Roma Inclusion Strategies                           14
3.3   An example of Roma-focused indicators: The Roma Inclusion Index of the Decade of
      Roma Inclusion Secretariat Foundation                                              17

4.    Proposed Indicators: potential and limitations                                     19
4.1   General remarks                                                                    19
4.2   Demography                                                                         20
4.3   Education                                                                          21
      4.3.1    Indicators for adults                                                     21
      4.3.2    Indicators for minors                                                     22
4.4   Employment                                                                         22
4.5   Housing                                                                            23
4.6   Health                                                                             24
4.7   Income and Poverty                                                                 24
4.8   Inclusive/discriminatory environment                                               24
4.9   Empowerment                                                                        25

appendix 1 Number of indicators in National Roma Inclusion Strategies in
20 Member States                                                                         26

Bibliography                                                                             27

                                                 3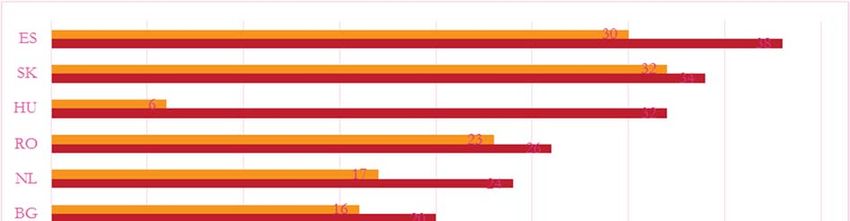
1. Introduction
1.1 Why monitor specifically the Roma people and their social inclusion?
The Roma minority is the most vulnerable ethnic minority group in Central and Eastern Europe, and
it also experiences multiple disadvantages across Southern and Western Europe. Most of the
1012 million Roma (or Gypsies)1 in Europe (European Commission, 2011b), suffer discrimination
and social exclusion, resulting in a poverty trap that is extremely hard to break and that is then inher-
ited by younger generations. This cycle covers all the important spheres of life: a low level of educa-
tion, employment characterised by unstable and informal jobs, bad housing and poor health. Roma
people face multiple disadvantages that reinforce one another.
This paper aims to contribute to the policy discussion on the challenges of mapping the realities of
Roma living conditions, and attempts to propose cross-country comparative, relevant, valid and
timely indicators of Roma inclusion, which are acutely needed for evidence-based policy making.
Data collections covering Roma people are very scarce in some countries, yet are available in others.
Both the quantity and the quality of information and data on the living conditions of the Roma
population have improved in many countries. A few surveys conducted in this field have been carried
out in a systematic way, using a methodology (sampling technique and questionnaire) that could serve
as a basis for constructing indicators on Roma inclusion. Moreover, survey data on the Roma are
now available at the cross-country level, although the validity (and comparability) of these data is not
always reassuring from an evidence-based policy aspect.
Moreover, the Roma are typically a hard-to-reach group, which implies a number of methodological
challenges when it comes to surveying the group (Messing, 2014). The collection of sensitive personal
information, including data on ethnic minorities, is regulated all across Europe. The multiple nature
of Roma ethnic identity and centuries of prejudice and exclusion impel many Roma to hide their
identity in official situations (such as the census), which makes sampling of a Roma survey uncon-
ventional, due to the lack of a reliable sampling frame. Besides sampling, there are other special
methodological issues to consider, such as the definition of ‘Roma’: who decides who Roma is, and
how does one measure discrimination, so as to ascertain whether the vulnerable situation of the Roma
is due to structural reasons or to the discriminatory attitudes of the mainstream environment (or to
both)?
The reason for the special attention devoted to the situation of the Roma population is clear: a
large group of EU citizens is living in much worse conditions, and with fewer opportunities for
upward mobility, than their peers or neighbours. If these people remain excluded, uneducated, jobless
and mired in deep poverty, it not only blights their own lives and future chances, but also has a
significant impact on life for the majority, through burdens imposed on the welfare system. Hence,
the social inclusion of Roma is of the utmost interest to the whole of society. Social indicators based
on statistical (and survey) data are essential to provide clear and comprehensive evidence for policy
makers. At present, evidence-based policy making aimed at Roma inclusion faces serious limitations,
because basic information is lacking about Roma people’s social and economic situation, and the
extent to which policies reach out to them is hard to measure in a valid and comparable way.
Improving these tools is very topical, as recent decades have seen an increased risk that the Roma
could lag behind even further.
1 We use the term Roma as an umbrella category embracing a variety of highly heterogeneous groups in terms of language, cultural
heritage and identity (European Commission, 2011c).
5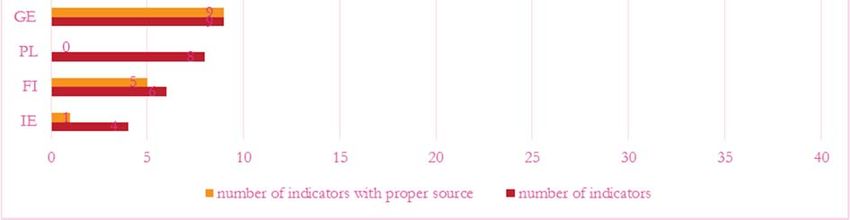
2. Political and conceptual framework on inclusion
of the Roma
2.1 European Political Framework
Although the disadvantaged situation of the Roma has been apparent at the European policy level
for decades, it was always regarded as a domestic issue for those countries with a large Roma popu-
lation, and the EU paid scant attention to the issue before its enlargements in 2004 and 2007. Alt-
hough the majority of Roma citizens in many old Member States also lived in a vulnerable situation,
it did not warrant any major policy measure at the EU level before the mid-2000s. This situation has
changed step by step, following the accession of post-communist countries: the EU has been more
and more attentive to the promotion of Roma integration, as most European Roma live in the new
EU Member States of Central and Eastern Europe. The EU was among the many founding organi-
sations that launched the first European Roma integration initiative - the Decade of Roma Inclu-
sion - as it recognised the importance of the initiative. Later, the EU introduced more initiatives
aimed at Roma integration, both directly via the EU Roma Framework Strategy and indirectly via the
Europe 2020 Agenda. Here, we briefly introduce major policy initiatives that have aimed at support-
ing Roma inclusion in the EU Member States.
2.1.1 Decade of Roma Inclusion (2005–2015)
The Decade of Roma Inclusion originally presented a ten-year policy framework that focused specif-
ically on Roma minorities. This was a political commitment by both EU and non-EU European
governments (Albania, Bosnia and Herzegovina, Bulgaria, Croatia, Czech Republic, Hungary, Mace-
donia, Montenegro, Romania, Serbia, Slovakia and Spain) to eliminate discrimination against Roma
people and to close the gap between them and the rest of society. Prioritising the areas of education,
employment, health and housing, the framework committed governments to take account of the
comprehensive nature of poverty, discrimination and gender mainstreaming (Decade of Roma Inclu-
sion, 2005). It was reinforced by other EU frameworks (presented below).
The Decade was supported by a number of international organisations, including the World Bank,
and by a number of programmes of the United Nations, the Council of Europe, the Council of
Europe Development Bank, and the Organisation for Security and Co-operation in Europe (OSCE)
Office for Democratic Institutions and Human Rights. It operated in partnership with nongovern-
mental organisations, such as the Open Society Foundations and the European Roma Rights Centre.
As the original term of the Decade drew to an end.
Among other activities, the Decade sought to draw up a relevant and valid framework for tackling
discrimination and poverty among the Roma population, complementing this with awareness raising.
The Decade’s other important aim was to contribute to the empowerment of Roma minorities by
involving representatives of Roma communities in policy discussions that affect their everyday life
and social inclusion. It spurred the creation of specialised facilities and the mobilisation of new
resources for Roma inclusion. Besides the above, the Decade also initiated, documented and dissemi-
nated good practices in the priority areas of education, employment, health and housing. In 2012, the
Decade of Roma Inclusion Secretariat Foundation and the Open Society Foundations launched a
shadow report project - ‘Civil Society Monitoring Reports’ - by supporting country teams that work
6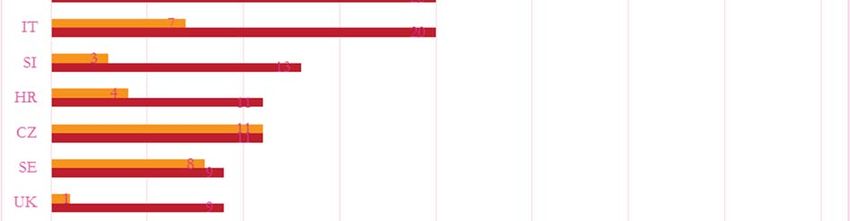
in civil society in eight countries (Albania, Bulgaria, the Czech Republic, Hungary, Macedonia,
Romania, Slovakia and Spain) and also, in 2013-2014, coalitions in a further eight countries (Bosnia
and Herzegovina, Croatia, France, Germany, Italy, Montenegro, Serbia and the United Kingdom).
These country teams drew up monitoring reports on the implementation of National Roma Integra-
tion Strategies (NRIS) and Decade Action Plans. These monitoring reports are often more evidence
based than the actual NRISs, and use better indicators (Decade of Roma Inclusion, 2013; 2014b)
  There are, however, a number of shortcomings identified in the activity of the Decade. These have
to do with the overly ambitious mission and vaguely defined priorities that are often reflected in the
National Roma Integration Strategies. Another recurring problem is inadequate resourcing, in terms
of human capital and financial sources. This is reflected in the weakness of the programmes, as well
as in the lack of an enforcement mechanism, which results in poor monitoring and evaluation, a
failure to address structural discrimination, and consequently poor targeting of the minorities (Decade
of Roma Inclusion, 2014).

2.1.2      Europe 2020 Agenda (2010–2020)
The Europe 2020 Agenda was developed by the European Commission as the EU’s strategy for
smart, sustainable and inclusive growth (European Commission, 2014) and has a relevant but indirect
impact on the Roma as a vulnerable social group. Five headline targets have been set for achievement
by 2020. These are politically binding and serve as policy anchors: employment; research and devel-
opment (R&D); climate change and energy; education; and the fight against poverty and social exclu-
sion. Roma people could profit from the achievement of these, especially from those targeting em-
ployment, poverty and social exclusion. The agenda also acknowledges that improved educational
qualifications would help with employability and assist in boosting the employment rate among
Roma, and so would reduce poverty (European Commission, 2010). The European Social Fund
(ESF) has also been made available to support the most vulnerable, among them Roma, in an effort
to ensure that they are not disproportionately hit by the crisis (European Commission, 2010).2
   The central aim of the Europe 2020 agenda is to confront the economic crisis by ensuring eco-
nomic, social and territorial integrity, to increase awareness and recognise the fundamental rights of
those who live in poverty and face social exclusion. It seeks to enable such people to live a dignified
life and to ensure their active participation in society, using targeted support from structural funds,
mainly the ESF. Part of its remit was to develop National Roma Integration Strategies (European
Commission 2011c), in order to bring a more comprehensive and evidence-based framework linked
to the Europe 2020 strategy.

2.1.3      EU Framework Strategy for National Roma Integration Strategies (2011)
The EU Framework Strategy for National Roma Integration Strategies (European Commission,
2011b) presents an unprecedented commitment by the EU and participating national governments
to focus on Roma minorities and their social inclusion, as well as on contesting the centuries-long
discrimination and prejudice that the Roma face in Member States. The Strategy was born from a
recognition that the Roma are a large and trans-European minority that has experienced social exclu-
sion for centuries in most of Europe’s countries.
  Social inclusion is based on ten principles developed by the EU to guide EU institutions and Mem-
ber States on social development policies, including policies related to the social inclusion of Roma
(European Commission 2011a). Although the principles are not legally binding, several Member
States have committed themselves to adopting them in their national strategies. The ten fundamental

2   Several Member States have defined this group to include vulnerable migrants, refused asylum seekers, illegal immigrants, economic
    migrants and ethnic minorities, especially Roma people (e.g. the Czech Republic, Ireland, Cyprus, Malta, Poland, Portugal and the
    United Kingdom).

                                                                  7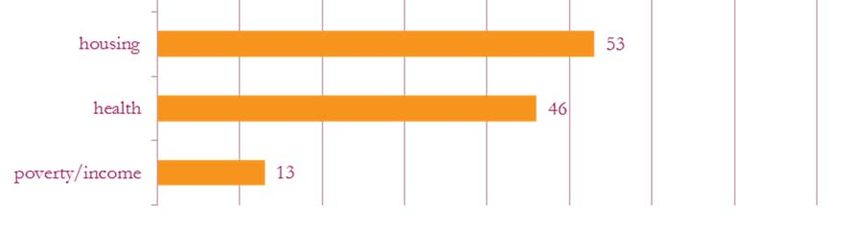
principles include: feasible, pragmatic and non-discriminatory policies; policies that explicitly but not
exclusively target Roma population; intercultural approach; general integration; awareness of gender
mainstreaming; dissemination of evidence-based policies; use of EU instruments; involvement of
regional and local authorities; involvement of civil society; and effective participation of the Roma
communities. These principles will be applied in the protection of fundamental rights, in order to
combat discrimination, poverty and social exclusion, while supporting gender equality and ensuring
access to education, housing, health, employment, social services, justice, sports and culture. How-
ever, there is little sign that the fulfilment of these principles is monitored in countries of the NRIS;
to the best of our knowledge, no tool has been developed to measure or monitor these basic princi-
ples.
  The national strategies are tailored to each Member State, which coordinates its efforts to close the
gap between Roma and non-Roma in the major areas of life (education, employment, healthcare and
housing). Although the strategies are developed by individual Member States, a coordinated approach
and the engagement of the main EU bodies are critical to achieving success in the four main areas of
education, employment, healthcare and housing. The EU Framework creates this opportunity for
coordination at all levels (international, national, regional and even local), involving all interested
parties, including the Roma. Monitoring of the social inclusion of Roma is closely linked to the
National Roma Integration Strategies, which called for efforts to develop tools that enable govern-
ments and the EU to comprehensively and comparatively evaluate efforts and funds dedicated to
Roma inclusion. However, as we will demonstrate, data for evaluation, as well as indicators for moni-
toring, are scarce and are far from comprehensive (to say nothing of their questionable potential for
comparison across the EU). Section 3.2 will elaborate on the indicators used by the National Roma
Inclusion Strategies.

2.2     The concept of integration and the Roma – clarifications in brief

2.2.1    Understanding and defining integration/inclusion
In order to understand the difficulties related to measuring the social inclusion of Roma, we first
need to conceptualise certain categories that are key to this paper: ‘inclusion’, ‘integration’ and ‘Roma’.
   In this paper we use ‘inclusion’ and ‘integration’ as synonymous expressions, though inclusion is
broader, conceiving of the notion as a two-way process in which Roma minorities and the non-Roma
environment alike need to be actively involved. Such an understanding of inclusion is shared by the
broader academic arena, which identifies the major approaches to social inclusion: equal treatment,
positive discrimination and mainstreaming equality (Rees, 2006). Equal treatment refers to provisions
for ensuring that members of various disadvantaged or vulnerable groups are treated equally by the
law and have equal access to state institutions. Such policies, however, fail to produce equal outcomes
for these groups, because they fail to acknowledge the impact of hierarchies within society: the mere
application of an equal-treatment approach tends rather to reproduce disadvantages, as it reinforces
structural hierarchies. To give a very simple example: the mere right to public education for all does
not prevent children who come from families in the lowest social strata from being educated in the
poorest-quality schools and thus having less chance of getting a job, especially a meaningful job.
Positive discrimination was born from the acknowledgement that equal treatment in itself is insufficient:
its fundamental idea is that different treatment is needed according to different circumstances. Thus
people who experience some sort of disadvantage need to be supported more: i.e. Roma individuals,
who experience discrimination in the search for a job, need to receive additional support and prefer-
ential treatment by jobcentres. Positive discrimination by itself, however, will not lead to inclusion,
as it seeks to ‘correct’ the distribution of positions by defining quotas in an effort to create fairness;
but it does not tackle the structural causes behind the unequal distribution of positions. It is also

                                                    8
argued that positive discrimination fuels conflict between social groups, as it is essentially based on
unequal treatment. True social inclusion is described by the concept of mainstreaming equality. This
argues that inclusion is a longer-term social enterprise, since it needs to address the structural reasons
for inequality by fostering systemic, structural change, rather than by counterbalancing the unequal
distribution of positions. In this understanding, the social inclusion of the Roma may be achieved
only if the root causes of their low social position - historical and persistent social exclusion - are
addressed. True inclusion, thus, is a longer-term process, in which not only the Roma have a role: the
direct and wider non-Roma environment needs genuinely to accept the Roma. It needs to regard
them as members of society and allow them into social positions at all levels of the social hierarchy.
This understanding of inclusion is much broader than the one used by the European Commission
in its conclusion about the ‘EU Framework for National Roma Integration Strategies up to 2020’,
which describes integration and inclusion as synonyms, and which refers to measures aimed at
improving the situation of Roma living in EU Member States (European Commission, 2011b: 2).
The conclusion addresses the Roma: although it acknowledges that the situation of the Roma popu-
lation is largely a result of their historical and systematic exclusion from mainstream society, and
although it affirms that inclusion should be regarded as a process in which both Roma and the
majority society play an active role, the actual measures described focus exclusively on the Roma
population and omit the responsibilities of the majority society.
However, in relation to other vulnerable groups the European Union applies the wider definition
of inclusion. For example, migrant integration is generally defined as a process of mutual adaptation
between the host society and migrants. The most important EU policy document that drives migrant
integration policies at the national level – the ‘Common Basic Principles for Immigrant Integration
Policy in the EU’ - outlines integration as a dynamic, two-way process of mutual accommodation by
all migrants and residents of Member States.3
We believe that the practice of inclusion as applied by Roma inclusion strategies - regarding the
process as a responsibility of the Roma minorities - is inappropriate: without the wider nonRoma
environment’s recognition of the importance of the integration of Roma minorities (and without
determination on its part to see that through), Roma inclusion is doomed to fail. Presently, in the EU
sphere of Roma inclusion, most indicators that assess integration focus exclusively on the minority
group; there are very few (if any) that assess mainstream society’s role in integrating Roma people (or
other minority groups, for that matter). We think that the double-sided nature of integration needs
to be reflected in the indicators, by including some that measure the majority society’s willingness
and effort to achieve inclusion. Thus, in this paper, we use the wider understanding of Roma ‘inclu-
sion’, and propose indicators that refer both to the Roma minorities’ greater inclusion in the spheres
of the labour market, education, social and health services, housing, etc., and to the non-Roma envi-
ronment’s openness to coexistence, common activity and mutual recognition and communication.
Another issue that needs to be discussed with reference to inclusion is the interests of the social
partners involved. There needs to be an understanding that the inclusion of Roma minorities is not
merely a question of European values (still less a matter of charity), but is in the economic interests
of all societies. Moreover, integration is essential not only to help provide economic and cultural
benefits, but also to ensure the security and stability of society as a whole. In the long run, just the
economic effect (cost) of exclusion and discrimination is immense for society: the social and labour
market exclusion of the Roma leads to increased welfare dependency (and thus social expenditure)
and to a decrease in tax revenue. Several studies have attempted to calculate the costs of social exclu-
sion. Kézdi and Kertesi’s (2006) economic modelling of the costs and benefits of improved educa-
tional qualifications among the Roma in Hungary showed that the sheer budgetary benefits (increased
tax revenue) of higher educational qualifications would be very significant. The research’s starting
point was that the educational deficit of the Roma results in substantially lower employment rates
3 See http://www.eesc.europa.eu/resources/docs/common-basic-principles_en.pdf
9
and household income, and consequently a lower lifetime contribution to tax and social contribu-
tions. The researchers showed that the budgetary return of investing in Roma education would be
significant, even in the short term. In addition, social inclusion has a number of other positive con-
sequences for mainstream society: cultural benefits, security and stability. Meanwhile, not only is lack
of inclusion very expensive at the societal level, but societies run the risk of social instability and
unrest.

2.2.2      Who is a Roma?
‘Roma’ is another category that needs to be defined for the purposes of this paper.4 The European
Commission defines the Roma as follows: ‘The term “Roma” is used - similarly to other political
documents of the European Parliament and the European Council - as an umbrella which includes
groups of people who have more or less similar cultural characteristics, such as Sinti, Travellers, Kalé,
Gens du voyage, etc. whether sedentary or not’ (European Commission, 2011c). This definition is
formulated in the recognition of ‘Roma’ minorities as a highly heterogeneous group, living in a num-
ber of European Member States and having an immense diversity of language use, ethnic identity,
tradition, level of inclusion, history, etc. But this definition does not address many of the ambiguities
and difficulties that the category ‘Roma’ encompasses.
   Although the Roma population varies significantly according to various identity-constructing fac-
tors, such as language, tradition, or level of social inclusion, still the majority environment’s percep-
tion imagines ‘the Roma’ as a homogeneous and unified group, distinguished primarily by racial char-
acteristics (skin colour) and traits of destitute poverty (Szelényi & Ladányi, 2006). Some authors argue
that the concept of Roma is more a construct of the majority society, reflecting its perceptions, rather
than an actual ethnic community/group (McGarry, 2014). Such an approach is driven by the hypoth-
esis that societies translate the perceptions of ‘otherness’ into ethnic terms with deep cultural impli-
cations (Szalai, 2011), which leads to a misguided sense of ethnicity. A second issue with regard to
conceptualising the ‘Roma’ is the fact that a large proportion of them possess multiple identities and
describe their multiple ‘belongingness’ (Neményi 2007; Kézdi and Simonovits 2014). If asked about
their ethnic identity, many Roma – especially in Central Europe - describe themselves equally as
Hungarian/Slovak/Romanian and as Roma/Gypsy (or their subgroups). And this is not a theoretical
dilemma, but a consequence of centuries-long turbulent waves of assimilation, integration and racial
exclusion. This multiplicity and intersectionality in the construction of the ethnic identity of Roma
people is rarely recognised by policy documents.
   The third issue with regard to conceptualizing the category ‘Roma’ relates to the agent doing the
identification of the respondent: ‘Who defines who is a Gypsy?’ (Willems, 1997: 7). The question is
essential to monitoring policy outcomes and to the practical application of integration indicators
through data collection. There are two approaches to identifying Roma ethnicity, and these result in
only partially comparable findings. In the narrower interpretation, Roma surveys focus on those who
identify themselves as Gypsies/Roma (‘self-identified Roma’), while the broader concept embraces
all those who are regarded as such by outsiders (‘ascription-Roma’). This latter group is definitely
larger, due to reluctance on the part of Roma to reveal their ethnic belonging and the frequent absence
in questionnaires of any way of recording multiple identification. These two approaches have further
consequences in terms of who will be represented by the ‘data’: surveys that allow ethnic identification
by the environment will definitely include a larger share of low-status, poor and socially excluded
people - irrespective of how those people regard their own ethnic identity - simply because the per-
ception of mainstream society is that the Roma are marginalised and live in destitute poverty. How-
ever, data collected from self-identified Roma have to reckon with relatively low response rates and,

4   This section is based on Messing (2014).

                                                   10
in addition, with a higher share of Roma with a strong ethnic identity, and a low share of assimilated
(and thus non-marginalised) Roma.
This leads us to another set of questions: What data sources are available to construct indicators of
Roma inclusion? Whom do the most important data sources represent? And what are their limita-
tions?
113. Overview of existing indicators and data
sources
3.1 Potential data sources and problems with them
In proposing and constructing indicators, we need to consider what data are available, and also what
the advantages and limitations are of those datasets. In this section we look at the data that are availa-
ble for constructing indicators of Roma inclusion.
The most obvious source of data is the census. However, there are several limitations on the use
of national censuses. First, in several countries the category of ‘Roma’ or ‘Gypsy’ does not appear at
all (i.e. France, Greece, Italy and Portugal). In these countries, there is a major obstacle to the collec-
tion of any data on the Roma/Gypsy population as censuses serve as a baseline of representative
samples for subgroups of society.
In most EU Member States, however, censuses include information about the ethnic background
of the population, and Roma identity may be indicated by the respondent. Even in these countries,
though, census data should be treated with caution, as for various reasons they heavily underreport
the Roma (Ivanov, 2012). First of all, Roma people are reluctant to declare their ethnic identity
because of widespread experience of stigmatisation, discrimination and unequal treatment. Second, a
large proportion of Roma possess multiple identities: they identify both as Roma and as members of
the majority society (Hungarian, Slovak, German, etc.). Most censuses, however, allow only a single
identity to be declared. The Hungarian census of 2011 provides a good example of the impact that
allowing multiple identities has on the reporting of Roma identity. In this census, the question on
ethnic/national identity changed from the previous census (in 2001) to allow equal dual identification.
Partly due to this modification to the question, the number of Roma measured by the census
increased by 53% from one census (205,000 in 2001) to the other (315,000 in 2011) (Central Bureau
of Statistics, 2013). We would argue that census data per se are usually not suitable for constructing
comparative policy indicators of Roma inclusion because of these limitations, and also because the
census takes place only every ten years. However, census data on the Roma (where such data exist)
provide the best source of information about the geographical, gender and age distribution of the
Roma, and thus offer the best baseline against which surveys representing the Roma may be con-
structed (FRA, 2012).
Another - probably the most important - potential source of data for assessing the social inclusion
of Roma comes from the national surveys conducted in individual Member States and, in a com-
parative manner, across Europe. The practice of surveying their Roma populations varies greatly
across EU Member States: some countries have been conducting surveys since the early 1970s to
investigate the level of social inclusion and the experiences of Roma people, but in most countries
no such surveys were conducted at all. There is no account of Roma surveys available, but we know
of recurring representative surveys in Hungary (Kemény et al., 2004); a registry of the Roma popula-
tion in Slovakia; several surveys on the living conditions of the Gitano in Spain (Fundació Secredar-
iado Gitanol); a survey providing good coverage of Roma in Romania (Fleck and Rughinis 2008); and
a comparative non-representative survey in Spain, Bulgaria, Romania and Italy.5
5 EU Inclusive: Data transfer and exchange of good practices regarding the inclusion of Roma population between Romania, Bulgaria,
Italy and Spain (see Tarnovschi, 2012).
12There are, however, larger, cross-country comparative surveys available about the living condi-
tions of Roma populations. The first such surveys were conducted by the United Nations Develop-
ment Programme (UNDP) in two waves. The first was carried out in 2002 and a remarkable study
was published on its findings, entitled Avoiding the Dependency Trap (UNDP, 2002; also a downloadable
dataset). This covered five Central-Eastern and South-Eastern European countries (Bulgaria, the
Czech Republic, Hungary, Romania and Slovakia), each of which investigated the socio-economic
situation of its Roma population. The second wave was carried out in 2004 and 2005 and involved
more countries from the region (Bulgaria, Croatia, the Czech Republic, Hungary, Macedonia, Roma-
nia, Slovakia and Serbia; Montenegro and Kosovo are included separately). It resulted in a compre-
hensive analysis entitled Vulnerable Groups in Central and South Eastern Europe (see UNDP, 2005;
also a downloadable dataset).
The successors to these two surveys were two other similar surveys that were carried out at the
same time (2011) and had many identical features: the United Nations Development Pro-
gramme/World Bank/European Commission (UNDP/World Bank/EC) regional Roma survey, and
the Fundamental Rights Agency (FRA) Roma pilot survey. These surveys have made a great contri-
bution to analysis of the conditions and vulnerability of the Roma population. They were based on
updated data and compiled the largest set of data ever gathered on the Roma. Both surveys were
conducted in May–July 2011 on a random sample of Roma and non-Roma living in areas with a high
density of the Roma population. They covered partly the same set of countries: the UNDP/World
Bank/EC regional Roma survey involved 12 countries (the five EU Member States of Bulgaria, the
Czech Republic, Hungary, Romania and Slovakia; the then-candidate member Croatia; and six non-
EU countries in the Balkans: Albania, Bosnia and Herzegovina, the Former Yugoslav Republic of
Macedonia, Montenegro, the Republic of Moldova and Serbia); meanwhile the FRA Roma pilot sur-
vey covered 11 EU Member States (Bulgaria, the Czech Republic, Hungary, Romania, Slovakia,
France, Greece, Italy, Poland, Portugal and Spain) (Brüggemann, 2012: 14).
All the above-mentioned UNDP surveys (from 2002, 2004 and 2011) and the FRA survey of 2011
were carried out among Roma and the non-Roma people living in close proximity to them. This
sample design relied on the principle that the majority population living in the same neighbourhood
as a Roma population tends to experience the same socio-economic environment, and can therefore
serve as a benchmark against which to measure the situation of the Roma. However, this means that
relatively well-off Roma are underrepresented in the surveys, since Roma respondents were sampled
from areas where the proportion of the Roma population is at least the average level measured by
national censuses. The UNDP/World Bank/EC and the FRA datasets are relevant and inclusive in
terms of their themes, and five of the countries (the Czech Republic, Bulgaria, Hungary, Romania,
Slovakia) were covered in both surveys. In addition, the surveys took a sample of both households
and individuals and inquired about a wide range of themes (promoted by the Roma Decade and the
EU Roma Framework) that related to the social and economic situation of the Roma popula-
tion - specifically their living conditions, income, employment, education and schooling, housing and
health, and interaction with other ethnic groups and political representation (UNDP/World
Bank/EC 2012; FRA 2012). These are also the most up-to-date datasets available; however, a new
wave of these surveys is in preparation by the FRA within the framework of the project EU MIDIS
2.
Both the surveys, as well as Roma surveys in general, struggled with the following issues, and yielded
different answers:
- representativeness: constructing a representative sample of the Roma population. The key barrier is
the lack of a baseline against which representativeness can be defined. In several countries, even
the census does not include a category for ‘Roma’ or ‘Gypsy’ (to say nothing of any subgroups). In
any case, for various reasons explainedearlier, censuses typically underestimate the share of Roma
people, and are therefore generally imperfect sources for sampling. Depending on the method used
13to overcome the problem of how to construct a ‘Roma’ sample, the surveys may cover very
different population segments (Messing, 2014);
- the definition of who is considered ‘Roma’ depends on how surveys operationalise the category of ‘Roma’,
and they may arrive at very different results in terms of basic indicators, such as employment rate,
level of education, housing conditions, etc.;
- protection of sensitive data. Ethnicity is regarded as sensitive data, to which stricter professional stand-
ards apply. There is a large variety of legislation on data protection in the EU Member States, and
different institutions may also have varying interpretations of these regulations when it comes to
constructing a survey sample and collecting, managing and storing data on ethnic background.
Data for indicators on the social inclusion of the Roma population would potentially be available if
large-scale European-wide mainstream surveys (Labour Force Survey (LFS), EU Statistics on
Income and Living Conditions (EU-SILC), the European Social Survey (ESS) or the Programme for
International Student Assessment (PISA)) included data on the ethnic background of each respond-
ent. This would provide a very good and comparative source for inclusion indicators – not only across
European countries, but also between the Roma and non-Roma populations in individual countries.
Hungary has adopted this approach and is piloting a question in its LFS on the ethnic background of
the respondent, allowing also for dual identification. We regard this as an innovative but still isolated
practice in Europe.
3.2 Indicators applied by National Roma Inclusion Strategies
Apart from Malta, all EU Member States submitted National Roma Integration Strategies (NRIS) in
2011–2012. These strategies, however, vary considerably in their structure and contents (and conse-
quently in their length and level of elaboration), as well as in the quantity and quality of the data and
indicators they use. For this paper, we examined the NRISs of 20 EU Member States, in order to
explore and compare the quality and quantity of the data and indicators they used. One of the con-
clusions of our analysis of the National Roma Integration Strategies is that they are almost impossible
to compare. Although most of them focus on the key areas of integration defined by the
EU - education, employment, housing, health, poverty and discrimination - they are utterly divergent
in their content, as well as their quality. This conclusion also applies to comparison of the indicators
used in any part of the strategies; hence the possibility of comparing indicators applied to describe
the challenges facing Roma inclusion across the EU Member States is very limited.
Our comparison of indicators used by NRISs covers almost all EU Member States: only a few
countries that have no significant Roma population were excluded (although a number of countries
with very small Roma populations were included, in order to paint a comprehensive picture). The
countries involved were: Belgium, Bulgaria, Croatia, the Czech Republic, Finland, France, Germany,
Greece, Hungary, Ireland, Italy, the Netherlands, Poland, Portugal, Romania, Slovakia, Slovenia,
Spain, Sweden and the United Kingdom. We applied a rather broad definition of ‘indicators’: we
collected any information that adds in any meaningful way to our knowledge of the quality of Roma
people’s life or that is linked to past, current or proposed policy measures in various social domains
(demography, education, employment, housing, health, poverty/income, discrimination), so long as
that information has been or could be converted into statistical data. This approach, of course, is far
broader than a conventional ‘social indicator’ definition, but it allows us to gain a more complete
picture of how Member States approach policies that target their Roma populations.
Of the 20 countries examined, four (France, Germany, Belgium and Portugal) did not use indicators
in an assessable manner (they either did not use indicators at all, or provided a maximum of just two).
Thus, it was impossible to analyse these countries’ NRISs with respect to the indicators and data
sources they applied. Hence, we excluded the NRISs of these Member States from our study.
14The reason for the lack of indicators or any statistical data in the NRISs is similar for both France
and Germany, both of which identify Roma inclusion as part of general inclusion policies, and believe
that Roma integration should be achieved exclusively through mainstream programmes; thus they
implicitly reject the need for ethnically targeted programmes that address the Roma. France’s NRIS
is in fact not a strategy, but rather an integrated set of policy measures incorporated into the country’s
social inclusion policies, without the identification of any indicators. Similarly, the German NRIS
states that a specific Roma strategy is not required in Germany; and nor is a national strategy necessary
for those foreign Roma who arrive in Germany as immigrants or refugees and have the right to
permanent residence, since they have access to the same integration programmes as other groups of
foreign nationals. In addition, the German NRIS highlights the fact that no statements can be made
about the educational, housing or health status of German Sinti and Roma or foreign Roma, since
the relevant data are not collected in official statistics on the basis of ethnic origin. Portugal also
alludes to the scarcity of information on Roma communities; it intends to conduct a broad study, in
order to collect relevant information for defining and implementing suitable policies for Roma inclu-
sion. These strategies highlight a major challenge - lack of suitable data - to designing and monitoring
Roma integration policies that is not exclusive to these four countries.
The NRISs from the remaining countries that we could analyse are still extremely varied in terms
of the quantity and quality of the indicators they use. Altogether we identified 272 indicators in the
16 NRISs. Looking at the most essential aspect, the number of statistical indicators ranges from four
in Ireland and six in Finland, to over 30 apiece in Spain, Slovakia and Hungary; this clearly reveals
how different approaches were applied by the Member States in elaborating their Roma strategies.
Not surprisingly, countries with a larger Roma population use more indicators (Spain, Slovakia and
Hungary: at least 30; Romania, Bulgaria and Italy: at least 20), but there are notable exceptions. On
the one hand, the Netherlands should be highlighted because of the high number of indicators that
its NRIS used (24), despite the low number and share of its Roma population (compared to other
Eastern and Southern European countries). At the other end of the scale we find the Czech Republic
and Greece utilising fewer indicators (11 and 9, respectively) when detailing their Roma inclusion
strategies, despite the rather significant Roma population in these countries (Figure 3.1 and Appen-
dix 1).
Although the number of indicators used in an NRIS could be seen as a proxy that suggests the level
of elaboration and the attention paid to the issue of Roma inclusion in a particular country, these
pure numbers conceal a lot of qualitative differences among countries. Most of the countries pub-
lished exact numeric figures as indicators, but in a number of cases only rough figures (in percentages)
or proportions were presented. The most extreme in this regard is Sweden, which mentions only
rough proportions, instead of exact numeric figures, in connection with all the indicators that appear
in the Swedish NRIS.
15Figure 3.1 Number of indicators used in National Roma Inclusion Strategies (2011) in 16 EU Member States
Source own compilation from National Roma Inclusion Strategies (2011–2012)
One of the issues we studied concerning the quality of indicators used in NRISs was whether proper
references to data sources were provided. Slightly more than half of the indicators (57%) in the
16 NRISs had a more or less proper reference;6 for the remaining 43%, only very unclear or no data
sources were mentioned. In this regard the Czech and Greek NRISs performed best: these two coun-
tries included references for all the indicators they used; however, the total number of indicators was
low in those countries. The Slovak, Bulgarian, Finnish, Swedish and Spanish NRISs published at least
80% of their indicators with a proper reference to its data source. Poland should be highlighted, as it
has no proper sources indicated for any of the indicators mentioned in the Polish NRIS; but certain
other countries (such as the UK, Ireland, Slovenia and Hungary) are in a similar position, having
published their indicators with at most 25% having a proper reference or source.
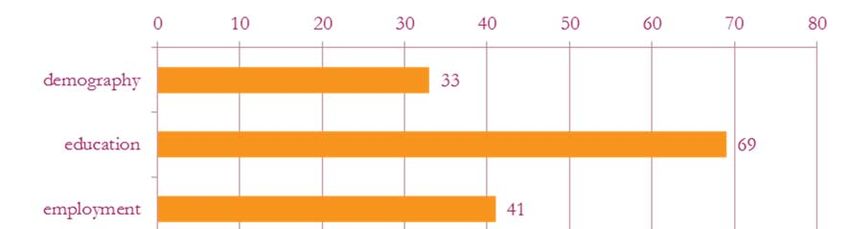
The number of indicators by domain also varies significantly (Figure 3.2). Most indicators cover
the field of education: every fourth indicator (N=69) focuses on this domain. It is followed by hous-
ing (N=53), health (N=46) and employment (N=41) - i.e. approximately every fifth or sixth indicator
covers one of these fields. Other indicators, representing domains like demography, poverty or dis-
crimination, are less frequently referred to.
In sum, these documents use indicators in an unsystematic fashion: the data sources and the relia-
bility (and actual content) of the indicators are not always explicit and transparent, and they are not
6 Here we applied a less strict method in deciding which references are ‘proper’: not only those with complete publishing information
(name of the dataset/survey or the title of the report/book, etc.; name of the author(s), if any; date; publisher; link, etc.), but also
those with enough information given to find them.
16comparable across countries at all. We might also look at whether they refer to the source of the data;
whether they use the data in a critical way (validity); and whether the indicators are suitable for
designing inclusion policies at all. In the domain of employment, many of the forms of work per-
formed by the Roma (informal, irregular, unreported, in kind, etc.) are not captured by classic
employment indicators; these need to be broadened out in order to measure Roma inclusion.
On the basis of the lessons learned from the indicators used in these policy documents, we can say
that better and more transparent (and valid) data are needed. More precisely, the indicators should
be constructed in a way that reflects the actual issues and challenges that policies should respond to.
Also, we may conclude that although there are huge discrepancies and considerable doubts about the
validity of data sources for indicators, this should not justify the lack of effort invested in constructing
better - i.e. more reflective, more valid and more comparable - indicators.
Figure 3.2 Number of indicators by domains used in National Roma Inclusion Strategies (2011) in 16 EU
Member States
Source Own compilation from National Roma Inclusion Strategies (2011–2012)
3.3 An example of Roma-focused indicators: The Roma Inclusion Index of the Decade
of Roma Inclusion Secretariat Foundation
The Decade of Roma Inclusion Secretariat Foundation drew up a set of indicators to measure the
progress of Roma inclusion according to the priorities of the Roma Decade (Decade of Roma
Inclusion Secreteriat Foundation, 2015). The aim of this project is similar to ours; but there are some
notable differences, too.
The similarity is that both the Roma Inclusion Index and our project aim to identify relevant indica-
tors regarding Roma inclusion that are comparable across countries. One major difference between
the two indicator initiatives is that, aside from drawing up indicators, the Roma Decade intends to
gather data and present the values of the indicators, by country, from existing datasets, which is not
the aim of our current work. Another difference is that while the Roma Decade project is built solely
on existing data, as well as those existing datasets we propose additional data sources that (while they
also exist) are not yet appropriate for indicator building in the field of Roma inclusion. By extending
these large-scale data collections (such as EU-SILC or LFS) using variables on the ethnicity of the
17respondent, it should be possible to end up with more reliable data sources that can serve as a basis
for elaborating Roma indicators. Finally, the coverage of the topics also represents a difference
between the two similar initiatives, as the Roma Inclusion Index follows the progress of the Roma
along the areas highlighted in the Roma Decade (employment, education, health and housing, with
the cross-cutting areas of non-discrimination, gender equality and poverty reduction), whereas our
project covers these topics, but also other important domains, such as demography, inclusive envi-
ronment and empowerment, with the cross-cutting areas of gender, age and settlement type.
Since the aims and the coverage of the domains of the two indicator projects overlap, a number of
the proposed indicators are the same. Clearly, both projects also aim to take account of those social
indicators that are currently widely used in the EU.
184. Proposed Indicators: potential and limitations
4.1 General remarks
As mentioned above (Section 3.1), there are some inherent challenges related to statistical data col-
lection on the Roma population all over Europe. The main barrier to statistically appropriate Roma
surveys is the lack of proper baseline statistics adequate to construct representative samples for each
Member State; thus Roma surveys in general cannot meet all the requirements of representativeness.
One of the main reasons for the lack of such baseline statistics is the protection of sensitive data,
including data on ethnicity in EU countries in general. Furthermore, the lack of consensus among
scholars, politicians and lawyers on the central question of ‘Who are the Roma?’ also hampers the
elaboration of proper Roma surveys. In general, potential data sources of proper indicators, based on
statistical data in the field of Roma inclusion, should meet the followings requirements:
- they should be based on representative sampling;
- they should be comparable across countries;
- they should be comparable with non-Roma/total population;
- the sample size should be sufficient for the Roma subsample;
- they should be available in all/most Member States.
Ideal data sources are national censuses, cross-country Roma surveys like the FRA/UNDP surveys
(but only if it is possible to create from these Roma surveys general, widely used indicators that are
designed for the overall population) and large-scale comparable EU surveys such as LFS or EU-SILC
(if a variable on (multiple) ethnicity or Roma identity is available). The main reason why the Roma
should be included in such large-scale EU surveys is that they are the only minority group that can
be found in almost all EU Member States, and most of them - in whatever country - live in poor and
vulnerable conditions; therefore involving them in these surveys would be meaningful.
Moreover, ideal datasets provide both individual and household data: some of the relevant domains
require household-level information, and in some cases, such as income or work intensity, individual
information on all household members (or just those of active age) is also required.
In what follows, the proposed Roma inclusion indicators will be presented by domain. In this paper,
we consider only those indicators that can be produced from population surveys and the census. We
have excluded data sources collected by state authorities (ministries, government bodies), because
these vary greatly across countries in terms of their structure, their quality and their content. These
data, although they could be very useful sources, follow the logic and principles of the given authority,
and can rarely be compared to other types of data. In addition, they are seldom (if at all) available for
purposes of research.
In the following sections, the cross-cutting categories for indicators in each domain are gender, age
and settlement type of the individual or the household. It should be noted that the set of indicators
below are only proposals and merely constitute an ideal for Roma indicators, taking the actual con-
ditions and available datasets into account as far as possible.
194.2 Demography
Indicators proposed:
DEM1: number and share of Roma population
There are a number of problems related to this essential indicator. One important limitation relates
to the issue of how ‘Roma’ category is conceptualised and who is regarded as Roma. Do the data
reflect self-identified Roma, or do they also include those people regarded by the direct environment
as Roma? Ethnically, the first approach is more acceptable; but if we are concerned with policies that
target discrimination and racism, then the actual target of such policies should be those that are
regarded as Roma by the out-group. These two distinct approaches to conceptualising the category
of ‘Roma’ may lead to highly divergent indicators with reference to the number/share of the Roma
population.
A further dilemma - also described above - relates to the multiple identities of Roma in many coun-
tries. Data should reflect the historical fact that many of Europe’s Roma identify as much with the
mainstream society’s national identity as with their Roma ethnic background. Applying multiple iden-
tity questions in surveys or censuses is a proper method to resolve this issue.
A third dilemma regarding the conceptualisation of the category of ‘Roma’ relates to the fact that
identity is rooted in various intersecting factors, such as language, tradition, cultural identity and race.
Which of these constituents (or their intersection) serves as the basis of defining ‘who is Roma’, and
consequently how many Roma live in a country?
Based on these dilemmas, several scholars question whether the ‘Roma’ population in Europe can
actually be counted.
Other demographic data may be derived from censuses, because even though they significantly
underestimate the Roma population, still the distribution by age, gender and other demographic traits
reflects the reality quite well.
Potential data source: census where ethnic data are collected; in other countries: large-scale surveys.
DEM2: age structure
The importance of this indicator lies in the fact that the age pyramid of the Roma and of the non-
Roma populations differs greatly in most countries. One issue for consideration concerning the age
structure is the categories for use. We propose to include a more detailed categorisation for children
than the 0–6 and 7-16 (or 18) generally used. We argue for the need to split children into several age
groups (0-3; 4-6; 7-12; 13-18) because of the relatively high proportion of young children within the
Roma. Moreover, a more detailed categorisation is essential for policy-making purposes. A vital
sphere of policies relating to Roma inclusion has to do with children - more specifically, early child-
hood development and the empowerment of mothers with young children. Other policies aim at the
inclusion of socially disadvantaged children in early childhood education and the ‘shepherding’ of
children from Roma families into kindergarten and pre-school as early as possible. Primary and lower
secondary schools are also key areas for Roma inclusion policies, while a focal point of inclusion
policies relates to the reduction in early school leaving. Young people (16-24) should be treated sepa-
rately in terms of effects on policy design on youth unemployment and active labour market policies
that target early-career youth. These aspects need to be taken into account when age categories for
indicators are defined.
Potential data source: census where ethnic data are collected; in other countries: large-scale surveys.
DEM3: Number and share of migrant (non-citizen) Roma
Roma migration from the new EU Member States to older Member States has become an issue in
the past decade, especially since the EU accession of Romania and Bulgaria. It is important to have
20You can also read


