Methodological elements for the comparative analysis of the first wave of the Covid-19 epidemic in France, Italy, and Spain
←
→
Page content transcription
If your browser does not render page correctly, please read the page content below
Investigaciones Geográficas
ISSN: 0213 - 4691. eISSN: 1989 - 9890.                                                                               Interuniversity Institute of Geography
DOI: 10.14198/INGEO.19060                                                                                                             University of Alicante

To cite this article: Aldea-Ramos, N. (2021). Methodological elements for the comparative analysis of the first wave of the Covid-19 epidemic
in France, Italy, and Spain. Investigaciones Geográficas, in press. https://doi.org/10.14198/INGEO.19060

  Methodological elements for the comparative
analysis of the first wave of the Covid-19 epidemic
             in France, Italy, and Spain
 Elementos metodológicos para el análisis comparativo de la primera ola
        de la epidemia de Covid-19 en Francia, Italia y España

                                                          Néstor Aldea-Ramos1

Abstract
     The three European countries included in the northwest littoral of the Mediterranean region –
Italy, France and Spain – reported their first cases of the SARS-CoV-2 coronavirus early in 2020. The
subsequent epidemic strongly impacted these countries, challenging the healthcare systems efficiency,
and the capacity and transparency of their public statistics structures. Because public statistics were
not fully adapted to such a new health situation, the available official data could not wholly describe
the epidemic correctly. This paper developed an indicator derived from the prevalence of SARS-CoV-2
aiming to describe the time and spatial dynamics of the epidemic. Although the analysis was not applied
to France due to the lack of data available, the comparative analysis among Spain and Italy highlighted
some similarities and certain divergences, partially attributable to the features of each country‘s national
demographic patterns and the peculiarities of applied health protocols. Finally, mortality during the first
wave of the epidemic has been analysed for the three countries, demonstrating higher mortality index in
Spain, although the reported number of SARS-CoV-2 declared deaths does not explain a portion of this
mortality excess.
     Keywords: Covid-19; epidemiology; demography; mortality; health.

Resumen
    Los tres países europeos que conforman el litoral noroeste del Mediterráneo —Italia, Francia y
España— notificaron sus primeros casos del nuevo coronavirus SARS-CoV-2 al comienzo del año 2020.
La consiguiente epidemia impactó intensamente estos países, desafiando la eficiencia de sus sistemas
de atención sanitaria, así como la capacidad y transparencia de sus estructuras de estadística pública.
Dado que la estadística pública no estaba completamente adaptada a la nueva situación sanitaria, los
datos oficiales disponibles no pudieron describir en su totalidad la epidemia de manera correcta. Esta
contribución ha desarrollado un indicador derivado de la prevalencia del SARS-CoV-2 con el objetivo de
analizar la dinámica espacio-temporal de la epidemia. Aunque el análisis no se ha aplicado en Francia
debido a la falta de datos, el análisis comparativo entre España e Italia destaca ciertas similitudes y algunas
diferencias, parcialmente atribuibles a las características demográficas propias de cada país, así como a los
protocolos sanitarios puestos en marcha. Por último, la mortalidad durante la primera ola de la epidemia
en los tres países ha sido analizada, mostrando una mayor tasa de mortalidad en España, si bien parte de
ese exceso de mortalidad no se explica por el número de defunciones declaradas por causa de SARS-CoV-2.
    Palabras clave: Covid-19; epidemiología; demografía; mortalidad; salud.

1 Institute of Demography, University Paris 1 Panthéon-Sorbonne (Paris, France). Nestor.Aldea.Ramos@gmail.com

Received: 02/15/2021.                                      Accepted: 05/24/2021.                                                   Published in press: 09/24/2021.
                                      This work is published under a license Creative Commons Attribution 4.0 International License.
                                                                   © Néstor Aldea-Ramos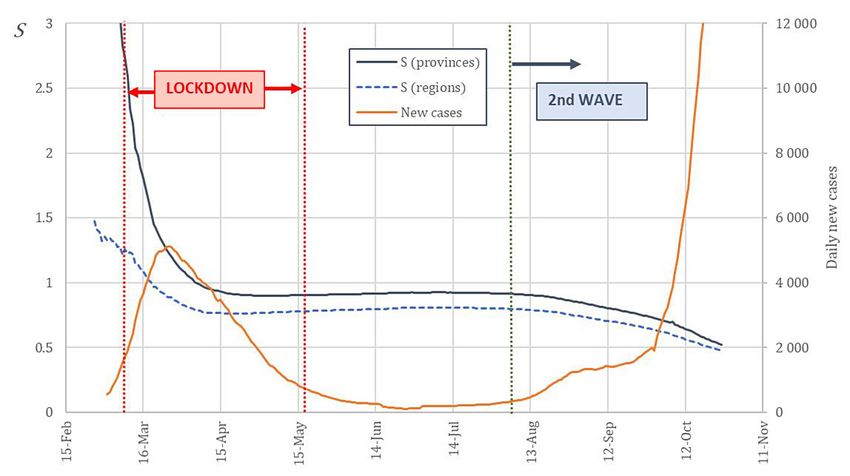
Aldea-Ramos, N.

1. Introduction
    The Covid-19 epidemic has entailed, since its outbreak, a public health concern and a major mortality
event in France, Italy and Spain, the countries forming the north-west littoral of the Mediterranean. In
those countries, the first detected cases of the disease took place early in 2020, as noted by Spiteri, et al.
(2020) and Bernard Stoecklin, et al. (2020).
     Since, their offices for public statistics have published different data concerning the epidemiological
features of the epidemic, mainly the number of deaths and identified cases, as well as some data about the
patients in hospitals and intensive care services. The amount and quality of available official public data
increases with time and, for the first wave of the epidemic (until summer 2020), available data remains
poor and inaccurate, making the analysis of the epidemic difficult.
    In Italy, the data published by Protezione Civile since the beginning of the epidemic includes the
daily number of new Covid-19 cases by region and province, as well as the number of deaths officially
attributed to Covid-19 by region. In Spain, the Carlos III Health Institute publishes the number of new
Covid-19 cases by province, and the Ministry of Health publishes the number of daily fatalities attributed
to Covid-19 by region. In the case of France, the number of Covid-19 cases by department, published by
Santé Publique France, is only available starting from May 13. In addition, the daily number of hospital
deaths attributed to Covid-19 by department is published since the beginning of the epidemic. However,
fatalities taking place in nursing homes are only published at a national level and bit by bit, by the Min-
istry of Health (see Appendix 1 for details on data sources).
     Besides, a serological study named ENECOVID has been performed in Spain in an effort to stablish
the proportion of the population having Covid-19 antibodies. Though controversial in some aspects, as
shown by Hoffmann & Wolf (2020), the results of the first wave of this study, published by Pollán, et al.
(2020), suggest that the number of detected cases in the country during the first wave of the epidemic
enormously underestimated the actual number of people infected by a factor around 10. Also concerning
the first wave of the epidemic, a great underestimation of the number of infections has been estimated
by Roques, Bonnefon, Baudrot, Soubeyrand & Berestycki (2020) for the case of France and measured by
Stefanelli, et al. (2020) for a specific area in northeastern Italy.
    This important underestimation can also apply to other countries during the first wave, and the
relation between confirmed cases and actual infections is not well known, as it mostly depends on the
screening strategies that have been put in place in each country. Therefore, the actual number of people
infected by Covid-19 remains unknown and the confirmed cases data cannot be, in any case, a substitute
of this magnitude.
    Consequently, a classical description of the disease by its incidence, prevalence and lethality must be
dismissed, and those indicators must only be used in restricted ways. In this context, the production of
indicators that are able to describe the dynamics and mortality of the epidemic, while being little depen-
dent on the accuracy of public data about Covid-19 cases and fatalities, is crucial.
    Concerning the number of Covid-19 infections, the inaccuracy of public data makes it unable to
describe properly the epidemic by itself, and the potential screening differences between countries for
this period make any international comparison based on this data inaccurate. Moreover, the effect of the
lockdown policies implemented during the spring 2020 in Italy, France and Spain cannot be apprehended
by this row data, as the study of the spatial spreading of the virus needs a more complex indicator.
    Proposed indicators for the description of the mortality during the epidemic are often strictly
dependent on the accuracy of data in the allocation of the cause of death as Covid-19. If we could assume
a certain accuracy in the assignation of Covid-19 as the death cause when it takes place in a hospital, this
accuracy can be lower for deaths taking place elsewhere. In addition, the three countries under study have
employed different methods when assigning deaths to Covid-19, depending on if the person has been
tested for the coronavirus and how, as reported by The Health System Response Monitor (HRSM) (2020).
In France, the WHO guidelines for the definition of Covid-19 deaths have been followed, considering
any “clinically confirmed or probable Covid-19 case” and therefore “not dependent on the availability
of a laboratory test” (HRSM, 2020). By contrast, Spain and Italy would only consider a Covid-19 death
under a positive laboratory test (HRSM, 2020). Thus, a clear analysis of Covid-19 deaths will only be
possible with individual mortality data including a cause, which is not yet available for this first wave of
the epidemic.

2                                                                              Investigaciones Geográficas, in press.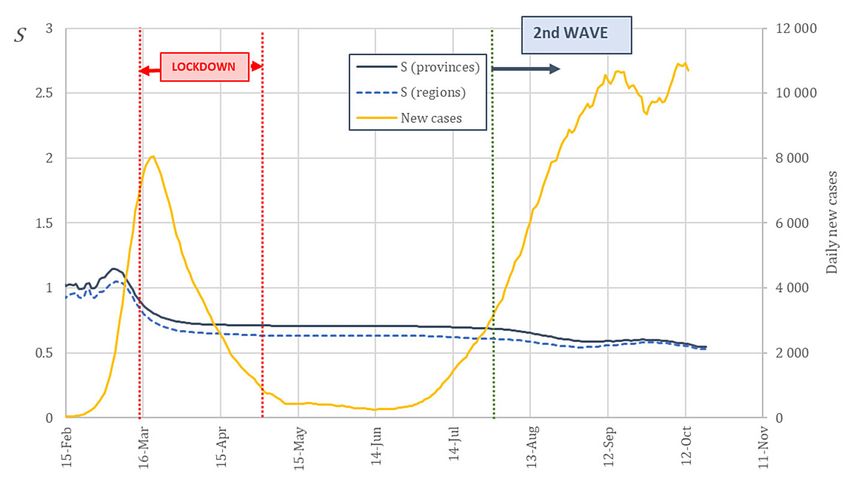
Methodological elements for the comparative analysis of the first wave of the Covid-19 epidemic in France, Italy, and Spain

     This paper will then focus on the first wave of the epidemic in Italy, France and Spain, lasting until
summer 2020. The first purpose, concerning the dynamics of the epidemic, is to define an indicator being
able to describe properly the spatial and time evolution of the epidemic, being also suitable for compar-
ing this evolution in different countries, which is a key to understanding the epidemic, as highlighted by
Pearce, Lawlor & Brickley (2020). There is a limitation to this approach: the necessary regional data for the
description of the dynamics of the epidemic is not available in France for the first wave, as Santé Publique
France has only published regional data on cases starting from May 13, 2020. Consequently, this analysis,
as it is detailed in 2.1, will be here limited to Italy and Spain.
     Moreover, a clear description of the mortality during the epidemic is here intended using only all-
cause non-individual mortality data by age in the three countries, collected and published by the Human
Mortality Database (see Appendix 1 on data sources).

2. Methodology
    The dynamics of the epidemic will be analyzed here for the first wave of the Covid-19 epidemic. Con-
sidering the three countries under study, this period starts in February 2020 and lasts until the summer.
The choice of such a short period instead of the whole epidemic rely on the considerable evolution of
testing policies and its efficiency: we can assume that the number of new Covid-19 cases gets closer and
closer to the actual number of infections, and therefore the first and the second wave should be studied
separately when using Covid-19 cases as data.
    In a general and rough way, a disease spreading could be described with only four parameters:
    1. its prevalence, as a ratio of the number of alive patients to the population exposed to risk;
    2. its incidence, as a ratio of the new cases of the disease recorded during a certain period of time to
       the risk-exposed population;
    3. its lethality, as a proportion of those who died in a specific cohort of patients;
    4. the mean length of the disease, starting from the infection until death or convalescence.
    In the case of an infectious, transmissible and non-fatally mortal disease providing immunity, two
other parameters need to be taken into consideration: 1) the duration of immunity (and, subsequently,
the period of virus mutation); and 2) the transmissibility of the infection from a sick individual to a
healthy, vulnerable one.
    However, given the type and accuracy of public data on the epidemic, some of those parameters are
unknown or cannot be computed, as it will be discussed below, forcing us to an alternative description of
the Covid-19 dynamics and mortality.

2.1. The dynamics of the epidemic
    The state of propagation of a disease is often described by its incidence and prevalence. The incidence
of a disease in a population x at a time t for a period τ is defined as the proportion between the number
of new cases c of the disease during the period τ immediately prior to t and the size of the population.

                                                                                                                              (1)

    Statistically, the number of new cases is given by day, so the continuous equation (1) becomes then
discrete.

                                                                                                                              (2)

   This incidence can be written, alternatively, as the mean number of daily cases during the period τ
multiplied by the period length:

                                                                                                                              (3)

   As for prevalence, in its most used definition (i.e. point prevalence), it represents the proportion of a
population suffering from the disease at a certain moment. However, this point prevalence is impossible

Investigaciones Geográficas, in press.                                                                                         3
Aldea-Ramos, N.
to measure or compute in the case of Covid-19, as the duration of the disease seems extremely variable
and there is not available data about the recovery of all reported cases. A different meaning of prevalence
must be thus adopted, in order to match with the current knowledge of the disease and the available data.
Two alternative definitions of prevalence exist: period prevalence (i.e. proportion of a population
having suffered from the disease at any moment of a given period) and lifetime prevalence (that is, pro-
portion of a population having suffered from the disease at any moment of their lives). Given the fact
that our period of study starts at the very first Covid-19 case reported, and that there is no evidence of an
individual having contracted the disease twice during the first wave, those two definitions become one
and the same, and that is precisely what will be subsequently called prevalence. Hence, the prevalence
of Covid-19 in a population x at a time t can be expressed – in terms of the sum of new daily cases – as:
(4)
It is self-evident that equations (2) and (4) become the same when τ = t, that is: the incidence of
Covid-19 is equal to its prevalence when the former is set for a period beginning at the very first Covid-19
case reported in the population. Given the period on which this paper aims to focus (i.e. the first wave of
the epidemic, until summer 2020), the irregularities and measure-induced fluctuations present in public
data for that term could generate an immoderate, undesirable variability on incidence, if it is set for a
short period. The cumulative character of prevalence makes it less likely to be affected by potential short-
term variability in the time series of reported Covid-19 cases, and thus prevalence will be taken on as a
more suitable indicator for this case.
However, as stated before, the different testing policies and strategies adopted for each population
need to be taken into account when performing and using prevalence. This fact, alongside the evidence
that a large part of Covid-19 infections has not been detected and reported as cases during the first wave,
impose two constraints. Firstly, reported cases – and their corresponding incidence and prevalence – can-
not fully describe the magnitude of the epidemic. In addition and consequently, prevalence itself cannot
be the ground for any comparison between countries for this period.
The objective here is limited to the study of the spatial spread of the virus within a large population X
(e.g. a country), here Italy, France and Spain. For that matter, prevalence data need to be available for k
exhaustive, non-overlapping subpopulations (e.g. provinces, regions) such as . As the in-
dividuals within each subpopulation will not be distinguished, each subset or subpopulation can be
treated, in practice, as a sole element with attributes – its population size – and – its preva-
lence –, at any time. They can therefore be written as .
With the purpose of avoiding leaning on the accuracy of the Covid-19 screening, the relative preva-
lence of a subpopulation to the whole population X will be defined. The construction of this relative
prevalence is based on the assumption that the accuracy of Covid-19 screening is comparable, to a large
extent, in every subpopulation . This means that, if, in the subpopulation , only a certain proportion
of infections is diagnosed and reported as cases, that proportion will be similar for the rest of the subpop-
ulations .
In practice, this assumption will be made for subpopulations within the same country, as testing policies
can be considered rather homogenous inside that country. Accordingly, in this case, the population X
will be that one of a country (here Italy, Spain or France) and its corresponding administrative
subpopulations (provinces or regions for Italy and Spain and departments or regions for France).
Therefore, the relative prevalence of a subpopulation within a population (country) X can be ex-
pressed as:
(5)
This relative prevalence is thus equal to one for the population X itself. At this point, an
indicator describing the spatial distribution of the epidemic within the territory of a country
– population X– can be constructed from this relative prevalence. The use of the relative prevalence, added
to the testing policies homogeneity hypothesis, will make this indicator independent of the screening
4 Investigaciones Geográficas, in press.Methodological elements for the comparative analysis of the first wave of the Covid-19 epidemic in France, Italy, and Spain
accuracy and hence suitable for a comparison of the spatial dynamics over time of the epidemic in
different populations (i.e. countries).
The aforementioned indicator will be defined, for a population X and at an instant , as:
(6)
This , that will be also referred to as “spreading indicator”, has the shape of a “weighted” standard
deviation. Indeed, it expresses the standard deviation of each subpopulation’s relative prevalence, weighted
by the size of that subpopulation. It can thus be deducted that and that, the smaller its value, the
closer the relative prevalence’s values of each subpopulation are. In the limit case, could be equal to zero
if every subpopulation has the same prevalence, that is, every relative prevalence is equal to one.
Yet, it is clear that this spreading indicator depends on how a territory is administratively divided and
how its population is split within those divisions. Likely, the smaller the divisions, the higher will be.
Thus, will be tested with two different levels of division – regions and provinces – in order to prove its
validity beyond a specific segmentation of the territory or the population.
In practice, this method will only be applied for Italy and Spain, as the number of Covid-19 cases by
region and department in France is only available starting from May 13, 2020 (SIDEP data on laboratory
tests).
2.2. Mortality during the epidemic
Mortality will be studied for a period of twelve weeks covering the higher mortality term of the first
wave of the epidemic. Those weeks are 11 to 22 (from March 9 to May 31, 2020) for Spain and France,
and weeks 10 to 21 (from March 2 to May 24, 2020) for Italy.
As the actual number of people infected by Covid-19 is unknown, the lethality of the disease (i.e.
number of deaths caused by Covid-19 divided by the number of people infected during a certain period)
cannot be estimated. Therefore, fatalities derived from Covid-19 must be imperatively expressed by crude
or specific mortality rates.
The number of deaths officially attributed to Covid-19 for an age group A of a population X within
a period can be expressed as a sum of daily deaths d, and thus its corresponding specific
mortality rate can be put as:
(7)
As for the whole of mortality (all causes), the excess mortality – and its corresponding rate – will
be here employed as a way to measure the impact of the first wave of the epidemic on mortality. Excess
mortality for a certain period is defined as the difference between the observed and the expected deaths
for that period. Considering variations of death rates and population negligible for the last five years in
the three countries under consideration, the number of expected deaths in an age group A within a pop-
ulation X for a period T in 2020 can be reckoned as the mean of the past five years for that same period,
that is:
(8)
Then, the excess mortality rate for that age group A, population X and period T will be:
(9)
Furthermore, the difference between the number of excess deaths and the number of deaths officially
attributed to Covid-19 can be expressed by what will be – from this point on – referred to as “balance
mortality”. Its correspond rate for an age group A, population X and period T will be:
Investigaciones Geográficas, in press. 5Aldea-Ramos, N.
(10)
However, the generalization to the whole population of the three mortality rates from equations
(7), (9) and (10) (i.e. crude rates) could be misleading, as the three countries under consideration show
moderate disparities in the age structure of their population. Given the great age gradient of general and
Covid-19 mortality – as shown by Kaeuffer, et al. (2020), Giorgi Rossi, et al. (2020) and Working group
for the surveillance and control of COVID-19 in Spain (2020) –, it is thus necessary to standardize mor-
tality rates by age in order to avoid undesirable effects of different age structures.
Therefore, for a population X with m exhaustive, non-overlapping age groups whose m
corresponding proportions in a reference population Y are , any of the former mortality rates
( , , ) can be standardized for the population X over the age structure of the population Y
as follows:
(11)
In practice, five age groups will be stablished for each population, in order to match the used data,
from the Human Mortality Database (0-14, 15-64, 65-74, 75-84 and 85 or more years old). Furthermore,
the structure by age of the population of Spain will be employed as the reference for the standardization.
3. Results
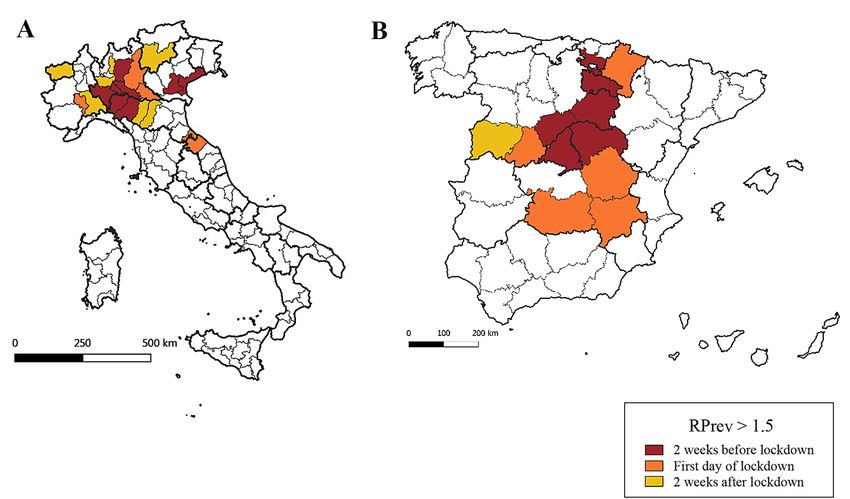
Eight out of 107 Italian provinces show a relative prevalence higher than 1.5 two weeks before the
national lockdown [Figure 1A]. All of them are located in the North, and six of them close to the city
of Milan. This number rises to twelve (combining for 11 % of the Italian population) on the first day of
lockdown (March 9) and to seventeen provinces two weeks after the implementation of the lockdown
(see Appendix 2 for details on prevalence by province). All those provinces are located in the northern
part in the country and most of them are in the Lombardy and Emilia-Romagna regions.
Figure 1. Provinces with a relative prevalence higher than 1.5 in Italy (A) and Spain (B),
two weeks before the lockdown, the first day of the lockdown and two weeks after the lockdown implementation
Own elaboration
6 Investigaciones Geográficas, in press.Methodological elements for the comparative analysis of the first wave of the Covid-19 epidemic in France, Italy, and Spain
In Spain, six out of fifty provinces show a relative prevalence above 1.5 two weeks before the national
lockdown [Figure 1B]. Those are the provinces in the axis between the cities of Madrid and Vitoria. On
the first day of lockdown (March 15), this number rises up to eleven provinces (combining for 21 % of
the country population). Two weeks after the lockdown, one more province reaches a relative prevalence
of 1.5. Thus, Spain shows a higher spatial spread of the virus than Italy in the weeks preceding and
following the effective date of the lockdown.
The spreading indicator S describes properly the spatial evolution of the epidemic. In both Italy and
Spain, the evolution of S follows the same pattern: the high values at the very beginning of the epidemic
are followed by a stabilization of due to lockdown policies. In summer, with the termination of those
policies, S takes its decrease back as the second wave of the epidemic begins [Figures 2 and 3].
The success of lockdown policies in confining the epidemic within certain regions is shown by the
stabilization of S following the implementation of those policies. This stabilization is well seen in both
Spain ( and between April 15 and June 30) and Italy
( and between April 15 and July 31), where even increases
slightly from the beginning of May.
Figure 2. Evolution of the spreading indicator S (for regions and provinces) and the daily number of Covid-19 cases
(15-day centred rolling average) in Spain between February and November 2020
Source: Carlos III Health Institute. Own elaboration
As foreseen in the Methods section, depends on the division of the territory and is higher for smaller
divisions (i.e. provinces). Furthermore, this difference is higher in Italy, where twenty regions contain
101 provinces, than in Spain, where seventeen regions contain only fifty provinces plus two autonomous
cities.
However, the dependence on the territorial division is limited, and remains smaller in Spain for
the whole period (as shown in Figure 1A and 1B), regardless of the territorial division under study
[Figure 4]. This shows that, independently of the screening level in those two countries, the epidemic
was geographically more spread in Spain that in Italy. Even if lockdown policies do stabilize S, the ratio
of between Italy and Spain increases slightly from April until the second wave, where the decay of S is
greater in Italy, due to a more homogeneous distribution of the epidemic in the dawn of that second wave.
Investigaciones Geográficas, in press. 7Aldea-Ramos, N.
Figure 3. Evolution of the spreading indicator (for regions and provinces) and the daily number of Covid-19 cases (15-
day rolling average) in Italy between February and November 2020
Source: Dipartamento della Protezione Civile. Own elaboration
Figure 4. Ratio of the spreading indicator in Italy to in Spain. By region and by province
Own elaboration
3.1. Mortality during the epidemic
Limiting the analysis to the twelve weeks within the first wave (weeks 10 to 21 of 2020 for Italy and
weeks 11 to 22 of 2020 for France and Spain), the three countries show a high excess mortality [Figure 5].
For this period, Italy presents 51,535 excess deaths (+35 % than expected), France shows 29,151 (+22 %)
and Spain shows 48,850 (+52 %).
Besides, the addition of the number of official Covid-19 deaths to the number of expected deaths ex-
plains only partially the number of observed deaths. This difference, that have been called balance deaths,
is high for Italy (18,785 deaths) and Spain (20,368 deaths), and almost inexistent in France (368 deaths).
8 Investigaciones Geográficas, in press.Methodological elements for the comparative analysis of the first wave of the Covid-19 epidemic in France, Italy, and Spain
Figure 5. Weekly expected deaths, observed deaths and sum of expected and reported Covid-19 deaths for Italy
(weeks 10 to 21, 2020), France and Spain (weeks 11 to 22, 2020)
Sources: European Centre for Disease Prevention and Control, The Human Mortality Database. Own elaboration
This increase of the number of deaths in this period is extremely variable by age and, while all the
three countries see the number of deaths decrease for people aged under 15, there are indicative increases
for the rest of age categories [Table 1]. Excepting the youngest age category, it is Spain where the num-
ber of deaths increases the most for every other age category. For the population aged 85 and more, the
increases are the vastest, and reach 68 % in Spain, 40 % in Italy and 30 % in France. In this last country,
the increase is only indicative starting from 65 years old, while Italy and Spain do observe an increase of
15 % and 18 % respectively within the population aged between 15 and 64 years old.
Table 1. Relative increase (2020 vs. 2015-19) in total deaths by age group in Italy (weeks 10 to 21),
France and Spain (weeks 11 to 22)
Age 0-14 15-64 65-74 75-84 85+ All ages
Italy -15% +15% +35% +35% +40% +35%
France -13% +3% +26% +18% +30% +22%
Spain -34% +18% +46% +47% +68% +52%
Own elaboration
The standardization over the structure by age of the population of Spain soothe the excess mortality
rate and Covid-19 mortality rate for Italy [Table 2], by 13 and 14 %, respectively. This is due to Italy
having an older population structure (23.2 % of the Italian population is 65 or older vs. 19.6 % in Spain).
Therefore, the high crude death rates observed in Italy for the period are partly attributable to a great
proportion of old inhabitants in its population.
Investigaciones Geográficas, in press. 9Aldea-Ramos, N.
In the case of France, the standardization soothe the crude mortality rates as well, but to a much
lesser extent (2 % reduction for each one of the rates). Indeed, and in spite of slight differences, France’s
population structure by age is much closer to that one of Spain.
Table 2. Crude and standardized (on the reference of the population of Spain) excess mortality rate and Covid-19
mortality rate for Italy (weeks 10 to 21, 2020) and France (weeks 11 to 22, 2020)
Italy France
Crude Standardized Crude Standardized
0.86 ‰ 0.75 ‰ 0.43 ‰ 0.42 ‰
0.54 ‰ 0.47 ‰ 0.43 ‰ 0.42 ‰
Own elaboration
Having avoided the differences in the structure by age of the population of those countries, the
standardized excess mortality rate ( ) shows high differences between the three countries [Table 3].
While, for the twelve weeks under study, the is only 0.42 ‰ in France, it is as high as 1.03 ‰ in
Spain (that is, 143 % higher). Italy shows a middle value with 0.75 ‰.
Concerning the deaths officially published as Covid-19 deaths, the differences between the three
countries are much slighter: France shows the lowest value of the (0.42 ‰) while this rate is
equal to 0.47 ‰ in Italy and 0.60 ‰ in Spain.
Moreover, the difference between those two rates ( and ) varies enormously within the
three countries. In France, both rates are practically equal, and more than 99 % of the excess mortality
would be attributable to those Covid-19 deaths.
However, Italy and Spain show huge gaps between the and the , and the part of the ex-
cess mortality potentially attributable to Covid-19 deaths is only of 62 % in Italy and 59 % in Spain. The
standardized balance mortality rate is almost inexistent in France, while it is as high as 0.43 ‰ in Spain
and 0.28 ‰ in Italy for the period.
Table 3. Standardized (on the reference of the population of Spain) excess mortality rate, Covid-19 mortality rate and
balance mortality rate in Italy (weeks 10 to 21, 2020), France and Spain (weeks 11 to 22, 2020)
Italy France Spain
0.75 ‰ 0.42 ‰ 1.03 ‰
0.47 ‰ 0.42 ‰ 0.60 ‰
0.28 ‰ 0.00 ‰ 0.43 ‰
Own elaboration
4. Discussion
The spatial diffusion of the Covid-19 epidemic in Italy and Spain shows a spread departing from the
cities of Milan and Madrid, respectively. Those two cities being the most important economic spots of
their respective countries (which leads to a more intense flow of people), they are more likely to be affect-
ed by an epidemic in the first place, as shown by Balcan, et al. (2009). In the case of Italy, the epidemic
disseminates from the Milan area mostly to neighbor provinces while, in Spain, a notable part of the ter-
ritory shows an important presence of the coronavirus at the beginning of the lockdown. This diffusion
matches with the mobility patterns described by Iacus, et al. (2020).
This spatial diffusion is well described by our spreading parameter that summarizes the time
dynamics of the epidemic. This parameter shows how a rapid initial spread of the coronavirus in Italy and
Spain is followed by a stability period further to the implementation of lockdown policies suppressing
human mobility. The end of those policies before summer 2020 leads then to the spatial diffusion of the
virus and, following the start of the second wave of the epidemic in autumn 2020, the parameter shows
a much more homogenous allocation of infections within the aforementioned countries.
10 Investigaciones Geográficas, in press.Methodological elements for the comparative analysis of the first wave of the Covid-19 epidemic in France, Italy, and Spain
Moreover, the parameter shows little dependency on the administrative regions employed. In addi-
tion, it is suitable for international comparisons, as it does not depend on the accuracy of the screening in
each country, only supposing a similar level of screening for each region within a same country. However,
the age structure of each region could have a slight effect on the level of screening, as infections in older
people where more easily detected during the first wave, as we can infer from Working group for the
surveillance and control of COVID-19 in Spain (2020).
The lack of regional data on Covid-19 cases in France during the first wave of the epidemic entails,
however, a limitation to this study, as the dynamics of the epidemic in France could not be described at all.
4.1. Mortality during the epidemic
The analysis of the first wave of the epidemic reveals a consistent increase of mortality in the three
countries. This increase is higher for older groups of the population. The population aged under 15 ex-
periences, however, a lower mortality, that could be linked to lockdown policies reducing the number of
accidental deaths.
In Italy, excess deaths have been estimated to more than 51,000 for the period running from week 10
until week 21 of 2020. Scortichini, et al. (2021) have estimated between 43,984 and 50,362 (95 % eCI)
excess deaths for the period between February 15 and May 15. If our method was applied to that period,
we would obtain 50,163 excess deaths, thus approaching the Scortichini et al. (2021) estimate. Besides,
Magnani, Azzolina, Gallo, Ferrante & Gregori (2020) estimate 45,033 excess deaths between March 1
and April 15, while our method applied to that period would give 49,129 excess deaths. Moreover, Kontis,
et al. (2020) make an estimation of 48,700 excess deaths between mid-February and the end of May, very
close to the 50,073 we would obtain with our method.
In France, Fouillet, Pontais & Caserio-Schönemann (2020) estimate the number of excess deaths to
more than 25,000 for the months of March to May 2020. This amount is lower than our estimate by 4,000
deaths, but our period of study excludes the first week of March, where excess deaths are -490 according
to our method. For that same period, Santé Publique France (2020) estimates between 25,000 and 30,000
excess deaths. In addition, Kontis, et al. (2020) estimate 23,700 excess deaths from mid-February to the
end of May, some less than the 26,500 that our method estimates for the same period.
In Spain, the Instituto de Salud Carlos III (ISCIII) (2020) estimates 44,118 excess deaths between
March 13 and May 22, 2020. Our estimate being 48,850 for weeks 11 to 22, it drops to 48,152 when
applied to the period studied by ISCIII (2020). In addition, Kontis, et al. (2020) estimates 45,800 excess
deaths from mid-February to the end of May, very close to the 46,349 obtained by applying our method
to that period.
Our excess deaths estimates are thus close to other publications but produce a slight overestimation.
This could be due to the very simple employed method (that do not take into account the evolution of the
population or its structure), but also, it could be partially attributable to the fact that this publication is
submitted six to nine months after Magnani, et al. (2020), Fouillet, et al. (2020), Santé publique France
(SPF) (2020) and ISCIII (2020), thus employing mortality data that are much more complete for spring
2020.
In the absence of information about the medical cause of death, the proportion of those excess deaths
attributable to Covid-19 remains unknown. The computed Covid-19 mortality rate and its complement,
the balance mortality rate, are ruled by how deaths have been assigned to Covid-19. The balance mortality
itself could be partly due directly to undetected Covid-19, but it could also be partially attributable to
other pathologies, as mortality and its causes have been also indirectly disturbed by the epidemic and
lockdown policies. This balance mortality is very considerable in Spain, quite important in Italy and
almost inexistent in France, as Beaney, et al. (2020) – who wrongly refers to as “non Covid-19 excess
mortality” – has also shown.
Moreover, the magnitude of this balance mortality could have been influenced by healthcare capacity:
in countries with a very limited number of hospital beds, the hospital admission of patients presenting
Covid-19 symptoms or other pathologies could have been reduced, and certain specific treatments could
have been rescheduled, eventually leading to an increase in mortality. Showing a high balance mortality,
Italy and Spain had, respectively, 314 and 297 hospital beds available per 100,000 inhabitants in 2018
(Eurostat, 2020), while France had 591 and presents almost no balance mortality. In addition, the definition
Investigaciones Geográficas, in press. 11Aldea-Ramos, N.
of a Covid-19 death employed by Italy and Spain (HSRM, 2020) could have led to an underestimation of
Covid-19 deaths and therefore to an increase of the computed balance mortality, while the following of
WHO guidelines by France (HRSM, 2020) could have reduced this balance mortality.
5. Conclusions
In this paper, firstly, an alternative analysis of the dynamics of the Covid-19 epidemic has been pro-
posed considering the inaccuracy of public data on the cases of the disease. This analysis in terms of spa-
tial spreading and the introduction of the parameter S allow us to describe accurately the spatial dynamics
of the epidemic in Italy and Spain without relying on the precision in the screening of the disease. This
analysis shows how the epidemic was, as the time of the implementation of lockdown policies, much
more widespread within the Spanish territory than within the Italian territory. Moreover, the parameter
S allows us to track the efficiency of lockdown policies in terms of stopping the spatial diffusion of the
coronavirus, as well as the much more homogeneous distribution of the virus at the beginning of the
second wave.
Concerning mortality during the epidemic and dealing with all-cause non-individual mortality data,
excess mortality has been computed and considered as an indicator of the effect of the epidemic on
mortality. This excess mortality has been then split into Covid-19 mortality (according to the official
attribution) and balance mortality. All three mortality rates have been standardized by age, allowing us
to better compare different countries removing potential effects of the age structure of the population of
those countries. Excess mortality has been then shown to be extremely high in Italy, France and Spain
during the first wave of the epidemic. Spain presents, by far, the highest age-standardized excess mor-
tality rate of the three countries, being more than twice that one of France. These differences in excess
mortality among the three countries have been shown to be much more accentuated than the differences
in Covid-19 mortality (as officially attributed). The computed balance mortality is extremely important
in Italy and, especially, in Spain, while it is non-existent in France, being possibly related to healthcare
capacities in those three countries. The origin of this balance mortality could only be determined by em-
ploying individual mortality data including medical cause.
Acknowledgements
I thank Jean-François Léger and Alexandre Avdeev, from University of Paris 1 Panthéon-Sorbonne,
for useful discussion and advice.
Appendix 1: data sources
This appendix presents a list of the data sources that have been employed in this study, including
details on time and geographical availability, as well as sources and links.
Table A1. Data sources on Covid-19 cases
Country Source - Institution Details of the dataset Link
Andamento Nazionale Covid-19. Daily update on cumulated
https://github.com/pcm-dpc/
Presidenza del Consiglio dei Covid-19 cases by province.
Italy COVID-19/tree/master/dati-
Ministri - Dipartimento di Available from February 24,
province
Protezione Civile 2020.
Centro Nacional de Daily number of Covid-19 cases https://cnecovid.isciii.es/
Spain Epidemiología – Instituto de by province. Available from covid19/resources/casos_tecnica_
Salud Carlos III January 31, 2020. provincia.csv
Daily number of Covid-19 cases https://www.data.gouv.fr/en/
SI-DEP Data. Santé Publique
France* by province and age class. Only datasets/taux-dincidence-de-
France
available from May 13, 2020. lepidemie-de-covid-19/
* This dataset is not employed for this study
Own elaboration
12 Investigaciones Geográficas, in press.Methodological elements for the comparative analysis of the first wave of the Covid-19 epidemic in France, Italy, and Spain
Table A2. Data sources on Covid-19 deaths
Country Source - Institution Details of the dataset Link
Andamento Nazionale Covid-19. Daily update on cumulated
https://github.com/pcm-dpc/
Presidenza del Consiglio dei Covid-19 fatalities by region.
Italy COVID-19/tree/master/dati-
Ministri - Dipartimento di Available from February 24,
regioni
Protezione Civile 2020.
Daily update on number of https://www.mscbs.gob.es/
Situación actual. Ministerio de
cumulated Covid-19 fatalities profesionales/saludPublica/
Spain Sanidad, Consumo y Bienestar
in the country. Available from ccayes/alertasActual/nCov-China/
Social
January 2020. situacionActual.htm
Daily update on cumulated
number of Covid-19 fatalities in
Santé Publique France https://www.data.gouv.fr/en/
hospitals. Available from March
2, 2020. datasets/donnees-relatives-a-
France
lepidemie-de-covid-19-en-france-
Periodic update on cumulated vue-densemble/
Ministère des Solidarités et de la
number of Covid-19 fatalities in
Santé
nursing homes.
Own elaboration
Table A3. Data sources on all-cause deaths
Country Source - Institution Details of the dataset Link
The Human Mortality Database Weekly number of all-cause
– Department of Demography deaths by age class (2015-2020)
https://www.mortality.org/Public/
All (University of California, in Italy (retrieved from Istat),
STMF_DOC/STMFmetadata.pdf
Berkeley), Max Planck Institute France (retrieved from Insee) and
for Demographic Research Spain (retrieved from INE).
Own elaboration
Table A4. Data sources on population
Country Source - Institution Details of the dataset Link
Total population and population
Instituto Nazionale di Statistica http://dati.istat.it/Index.
Italy by province and region, by age
(Istat) aspx?QueryId=18460&lang=en#
(1st January 2020).
https://www.ine.es/jaxi/Tabla.
Instituto Nacional de Estadística Population by province and age
Spain htm?path=/t20/e245/p08/
(INE) (1st January 2020).
l0/&file=03002.px&L=0
https://www.insee.fr/fr/
Institut National de Statistique et Population by age (1st January
France statistiques/
d’Etudes Economiques (Insee) 2020).
1892088?sommaire=1912926
Own elaboration
Investigaciones Geográficas, in press. 13Aldea-Ramos, N.
Appendix 2: relative prevalence
This appendix presents the data of the relative prevalence by province in Italy and Spain two weeks
before lockdown, the first day of lockdown and two weeks after the implementation of the lockdown.
Table A5. Value of in all of Italy’s provinces on February 24, March 9 and March 23, 2020 (bold when )
February 24, 2020 March 9, 2020 March 23, 2020
Province
(two weeks before lockdown) (first day of lockdown) (two weeks after lockdown)
Torino 0.3 0.3 0.9
Vercelli 0.0 0.5 1.5
Novara 0.0 0.3 1.1
Cuneo 0.0 0.1 0.6
Asti 0.0 1.9 1.0
Alessandria 0.0 1.1 1.9
Valle d’Aosta 0.0 0.9 3.0
Imperia 0.0 0.4 0.7
Savona 0.7 0.9 0.7
Genova 0.0 0.3 0.8
La Spezia 0.0 0.5 0.5
Varese 0.0 0.4 0.5
Como 0.0 0.5 0.9
Sondrio 1.1 0.3 1.1
Milano 0.5 1.1 1.6
Bergamo 3.1 7.9 5.6
Brescia 0.0 4.1 4.5
Pavia 9.5 3.9 2.6
Cremona 28.6 18.2 7.9
Mantova 0.0 1.8 2.3
Bolzano/Bozen 0.4 0.1 1.3
Trento 0.0 0.4 1.8
Verona 0.0 0.6 1.1
Vicenza 0.0 0.4 0.8
Belluno 0.0 1.0 1.2
Treviso 0.2 1.1 1.1
Venezia 1.6 1.1 0.9
Padova 6.2 2.1 1.4
Rovigo 0.0 0.2 0.3
Udine 0.0 0.3 0.7
Gorizia 0.0 0.3 0.4
Trieste 0.0 0.8 1.3
Piacenza 12.1 14.9 6.4
Parma 1.7 4.4 2.9
Reggio nell’Emilia 0.0 1.4 2.5
Modena 0.8 1.2 1.6
Bologna 0.0 0.6 0.8
Ferrara 0.0 0.1 0.5
14 Investigaciones Geográficas, in press.Methodological elements for the comparative analysis of the first wave of the Covid-19 epidemic in France, Italy, and Spain Ravenna 0.0 0.3 0.9 Forlì-Cesena 0.0 0.3 0.9 Pesaro e Urbino 0.0 4.9 3.6 Ancona 0.0 1.0 1.5 Macerata 0.0 0.2 1.0 Ascoli Piceno 0.0 0.0 0.3 Massa-Carrara 0.0 1.0 1.4 Lucca 0.0 0.6 0.9 Pistoia 0.7 0.4 0.8 Firenze 0.2 0.4 0.5 Livorno 0.0 0.2 0.4 Pisa 0.0 0.3 0.6 Arezzo 0.0 0.3 0.6 Siena 0.0 0.8 0.6 Grosseto 0.0 0.2 0.6 Perugia 0.0 0.1 0.6 Terni 0.0 0.5 0.6 Viterbo 0.0 0.0 0.3 Rieti 0.0 0.0 0.2 Roma 0.1 0.1 0.3 Latina 0.0 0.1 0.3 Frosinone 0.0 0.0 0.2 Caserta 0.0 0.2 0.1 Benevento 0.0 0.1 0.0 Napoli 0.0 0.1 0.2 Avellino 0.0 0.1 0.3 Salerno 0.0 0.1 0.2 L’Aquila 0.0 0.1 0.1 Teramo 0.0 0.1 0.4 Pescara 0.0 0.3 1.1 Chieti 0.0 0.1 0.3 Campobasso 0.0 0.5 0.2 Foggia 0.0 0.3 0.4 Bari 0.0 0.0 0.2 Taranto 0.0 0.0 0.1 Brindisi 0.0 0.1 0.3 Lecce 0.0 0.1 0.2 Potenza 0.0 0.0 0.2 Matera 0.0 0.1 0.1 Cosenza 0.0 0.0 0.1 Catanzaro 0.0 0.1 0.1 Reggio Calabria 0.0 0.0 0.2 Trapani 0.0 0.0 0.1 Palermo 0.5 0.0 0.1 Investigaciones Geográficas, in press. 15
Aldea-Ramos, N.

Messina                                          0.0                                0.0                                0.2
Agrigento                                        0.0                                0.0                                0.1
Caltanissetta                                    0.0                                0.0                                0.1
Enna                                             0.0                                0.0                                0.3
Catania                                          0.0                                0.1                                0.2
Ragusa                                           0.0                                0.0                                0.0
Siracusa                                         0.0                                0.0                                0.1
Sassari                                          0.0                                0.0                                0.5
Nuoro                                            0.0                                0.1                                0.1
Cagliari                                         0.0                                0.2                                0.1
Pordenone                                        0.0                                0.0                                0.5
Isernia                                          0.0                                0.0                                0.0
Oristano                                         0.0                                0.0                                0.0
Biella                                           0.0                                0.7                                1.4
Lecco                                            0.0                                1.4                                2.7
Lodi                                           104.7                            28.7                                   7.7
Rimini                                           0.6                                3.4                                3.0
Prato                                            0.0                                0.1                                0.5
Crotone                                          0.0                                0.0                                0.4
Vibo Valentia                                    0.0                                0.1                                0.1
Verbano-Cusio-Ossola                             0.0                                0.5                                1.2
Monza e della Brianza                            0.7                                0.5                                1.2
Fermo                                            0.0                                0.2                                0.7
Barletta-Andria-Trani                            0.0                                0.1                                0.1
Sud Sardegna                                     0.0                                0.0                                0.0

                                                 Own elaboration

Table A6. Value of      in all of Spain’s provinces on March 1, March 15 and March 29, 2020 (bold when                   ).

                               March 1, 2020                  March 15, 2020                   March 29, 2020
           Province
                         (two weeks before lockdown)      (first day of lockdown)         (two weeks after lockdown)
Alicante                                          0.8                               0.6                                0.5
Albacete                                          0.9                               1.8                                2.0
Almería                                           0.0                               0.1                                0.2
Ávila                                             1.3                               1.5                                2.2
Barcelona                                         1.0                               1.2                                1.3
Badajoz                                           0.3                               0.2                                0.3
Vizcaya                                           0.9                               0.9                                1.2
Burgos                                            1.4                               1.1                                1.1
La Coruña                                         0.2                               0.5                                0.6
Cádiz                                             0.1                               0.2                                0.2
Cáceres                                           1.2                               1.0                                1.3
Ceuta                                             0.4                               0.2                                0.4
Córdoba                                           0.1                               0.3                                0.4
Ciudad Real                                       1.3                               2.7                                3.0

16                                                                                    Investigaciones Geográficas, in press.
Methodological elements for the comparative analysis of the first wave of the Covid-19 epidemic in France, Italy, and Spain
Castellón 0.4 0.5 0.5
Cuenca 0.5 1.7 1.9
Las Palmas 0.1 0.2 0.2
Gerona 0.6 0.7 0.8
Granada 0.2 0.4 0.6
Guadalajara 1.6 1.5 1.4
Huelva 0.1 0.1 0.2
Huesca 0.6 0.3 0.6
Jaén 0.3 0.4 0.5
Lérida 0.3 0.5 0.8
León 0.7 0.6 1.1
Logroño 3.7 2.6 2.6
Lugo 0.3 0.4 0.5
Madrid 3.2 2.8 2.2
Málaga 0.7 0.5 0.4
Melilla 0.0 0.4 0.3
Murcia 0.3 0.4 0.4
Navarra 1.2 1.9 2.0
Asturias 0.1 0.4 0.4
Orense 0.8 0.8 1.0
Palencia 0.8 0.5 1.1
Baleares 0.3 0.3 0.4
Pontevedra 0.1 0.4 0.6
Cantabria 0.3 0.4 0.7
Salamanca 0.3 1.3 2.1
Sevilla 0.3 0.2 0.3
Segovia 1.5 2.7 3.8
Soria 1.8 3.2 3.9
Guipúzcoa 0.1 0.5 0.6
Tarragona 0.2 0.3 0.4
Teruel 0.4 0.5 0.8
Santa Cruz de Tenerife 0.6 0.4 0.3
Toledo 0.8 1.1 1.3
Valencia 0.7 0.6 0.5
Valladolid 0.6 0.8 1.2
Álava 5.7 3.1 2.4
Zaragoza 0.5 0.5 0.8
Zamora 0.3 0.6 0.8
Own elaboration
References
Balcan, D., Colizza, V., Goncalves, B., Hu, H., Ramasco, J. J., & Vespignani, A. (2009). Multiscale mobility
networks and the spatial spreading of infectious diseases. Proceedings of the National Academy of
Sciences, 106(51), 21484–21489. https://doi.org/10.1073/pnas.0906910106
Investigaciones Geográficas, in press. 17Aldea-Ramos, N.
Beaney, T., Clarke, J. M., Jain, V., Golestaneh, A. K., Lyons, G., Salman, D., & Majeed, A. (2020). Excess
mortality: the gold standard in measuring the impact of COVID-19 worldwide?. Journal of the Royal
Society of Medicine, 113(9), 329–334. https://doi.org/10.1177/0141076820956802
Bernard Stoecklin, S., Rolland, P., Silue, Y., Mailles, A., Campese, C., Simondon, A., … & Tabaï, A.
(2020). First cases of coronavirus disease 2019 (COVID-19) in France: surveillance, investigations
and control measures, January 2020. Eurosurveillance, 25(6). https://doi.org/10.2807/1560-7917.
es.2020.25.6.2000094
Eurostat (2020). Hospital beds (TPS00046) [Data set]. Retrieved from https://ec.europa.eu/eurostat/
product?code=HLTH_RS_BDS&mode=view
Fouillet, A., Pontais, I., & Caserio-Schönemann, C. (2020). Excess all-cause mortality during the first
wave of the COVID-19 epidemic in France, March to May 2020. Eurosurveillance, 25(34). https://doi.
org/10.2807/1560-7917.es.2020.25.34.2001485
Giorgi Rossi, P., Marino, M., Formisano, D., Venturelli, F., Vicentini, M., & Grilli, R. (2020). Characteristics
and outcomes of a cohort of COVID-19 patients in the Province of Reggio Emilia, Italy. PLOS ONE,
15(8), e0238281. https://doi.org/10.1371/journal.pone.0238281
Health System Response Monitor (HRSM) (2020, June 4). How comparable is COVID-19 mortality
across countries? [Press release]. Retrieved from https://analysis.covid19healthsystem.org/index.
php/2020/06/04/how-comparable-is-covid-19-mortality-across-countries/
Hoffmann, C., & Wolf, E. (2020). SARS-CoV-2 seroprevalence in Spain. The Lancet, 396(10261), 1484.
https://doi.org/10.1016/s0140-6736(20)32272-8
Iacus, S. M., Santamaria, C., Sermi, F., Spyratos, S., Tarchi, D., & Vespe, M. (2020). Human mobility
and COVID-19 initial dynamics. Nonlinear Dynamics, 101(3), 1901–1919. https://doi.org/10.1007/
s11071-020-05854-6
Instituto de Salud Carlos III (ISCIII) (2020, July 29). Vigilancia de los excesos de mortalidad por todas
las causas. MoMo. Situación a 19 de julio de 2020 [Press release]. Retrieved from https://www.isciii.
es/QueHacemos/Servicios/VigilanciaSaludPublicaRENAVE/EnfermedadesTransmisibles/MoMo/
Documents/informesMoMo2020/MoMo_Situacion%20a%2019%20de%20julio_CNE.pdf
Kaeuffer, C., Le Hyaric, C., Fabacher, T., Mootien, J., Dervieux, B., Ruch, Y., … & Danion, F. (2020).
Clinical characteristics and risk factors associated with severe COVID-19: prospective analysis of
1,045 hospitalised cases in North-Eastern France, March 2020. Eurosurveillance, 25(48). https://doi.
org/10.2807/1560-7917.ES.2020.25.48.2000895
Kontis, V., Bennett, J. E., Rashid, T., Parks, R. M., Pearson-Stuttard, J., Guillot, M., … & Ezzati, M. (2020).
Magnitude, demographics and dynamics of the effect of the first wave of the COVID-19 pandemic on
all-cause mortality in 21 industrialized countries. Nature Medicine, 26(12), 1919–1928. https://doi.
org/10.1038/s41591-020-1112-0
Magnani, C., Azzolina, D., Gallo, E., Ferrante, D., & Gregori, D. (2020). How Large Was the Mortality
Increase Directly and Indirectly Caused by the COVID-19 Epidemic? An Analysis on All-Causes
Mortality Data in Italy. International Journal of Environmental Research and Public Health, 17(10), 3452.
https://doi.org/10.3390/ijerph17103452
Pearce, N., Lawlor, D. A., & Brickley, E. B. (2020). Comparisons between countries are essential for the
control of COVID-19. International journal of epidemiology, 49(4), 1059–1062. https://doi.org/10.1093/
ije/dyaa108
Pollán, M., Pérez-Gómez, B., Pastor-Barriuso, R., Oteo, J., Hernán, M. A., Pérez-Olmeda, M., … & Vázquez
de la Villa, A. (2020). Prevalence of SARS-CoV-2 in Spain (ENE-COVID): a nationwide, population-
based seroepidemiological study. The Lancet, 396(10250), 535–544. https://doi.org/10.1016/s0140-
6736(20)31483-5
Roques, L., Bonnefon, O., Baudrot, V., Soubeyrand, S., & Berestycki, H. (2020). A parsimonious approach
for spatial transmission and heterogeneity in the COVID-19 propagation. Royal Society Open Science,
7(12), 201382. https://doi.org/10.1098/rsos.201382
Santé Publique France (SPF) (2020, July). Surveillance de la mortalité au cours de l’épidémie de Covid-19
du 2 Mars au 31 Mai en France [Press release]. Retrieved from https://www.santepubliquefrance.fr/
maladies-et-traumatismes/maladies-et-infections-respiratoires/infection-a-coronavirus/documents/
rapport-synthese/surveillance-de-la-mortalite-au-cours-de-l-epidemie-de-covid-19-du-2-mars-au-
31-mai-2020-en-france
18 Investigaciones Geográficas, in press.Methodological elements for the comparative analysis of the first wave of the Covid-19 epidemic in France, Italy, and Spain
Scortichini, M., Schneider Dos Santos, R., De’ Donato, F., De Sario, M., Michelozzi, P., Davoli, M., …
& Gasparrini, A. (2021). Excess mortality during the COVID-19 outbreak in Italy: a two-stage
interrupted time-series analysis. International journal of epidemiology, 49(6), 1909–1917. https://doi.
org/10.1093/ije/dyaa169
Spiteri, G., Fielding, J., Diercke, M., Campese, C., Enouf, V., Gaymard, A., … & Ciancio, B. C. (2020).
First cases of coronavirus disease 2019 (COVID-19) in the WHO European Region, 24 January to
21 February 2020. Eurosurveillance, 25(9). https://doi.org/10.2807/1560-7917.es.2020.25.9.2000178
Stefanelli, P., Bella, A., Fedele, G., Pancheri, S., Leone, P., Vacca, P., … & Ferro, A. (2020). Prevalence of
SARS-CoV-2 IgG antibodies in an area of northeastern Italy with a high incidence of COVID-19 cases: a
population-based study. Clinical Microbiology and Infection. https://doi.org/10.1016/j.cmi.2020.11.013
Working group for the surveillance and control of COVID-19 in Spain (2020). The first wave of the
COVID-19 pandemic in Spain: characterisation of cases and risk factors for severe outcomes, as at 27
April 2020. Eurosurveillance, 25(50). https://doi.org/10.2807/1560-7917.es.2020.25.50.2001431
Investigaciones Geográficas, in press. 19You can also read