Methodology Handbook: Economic and Social Rights Scores - Human Rights Measurement Initiative
←
→
Page content transcription
If your browser does not render page correctly, please read the page content below
Human Rights Measurement Initiative Methodology

Human Rights Measurement Initiative

Methodology Handbook:
Economic and Social Rights
Scores
June 2021

 1
Human Rights Measurement Initiative Methodology

Document information

Key author contact details
Susan Randolph
University of Connecticut
susan.m.randolph@gmail.com

Thalia Kehoe Rowden
Human Rights Measurement Initiative
Thalia.KehoeRowden@motu.org.nz

Acknowledgements
We are enormously indebted to the hundreds of people who have helped make HRMI’s
dataset come to life. We would like to particularly acknowledge: John Stewart and Shaan
Badenhorst who contributed their expertise and countless hours of time to updating the
economic and social rights data; those human rights experts, academics, and other
supporters who participated in our 2015, 2017, 2018 and 2019 co-design workshops; the
dozens of human rights experts who have contributed their expertise by helping to design
and “test” our data visualisations; the volunteer translators who have helped make our
website material accessible in five languages; our website designers and developers who
have done a wonderful job with very limited resources; our colleagues and support staff; and
our financial donors, including the Open Society Foundations and the New Zealand Ministry
of Foreign Affairs and Trade. We are very grateful that they could also see the enormous
value that good human rights data can bring.

Disclaimer
The findings and opinions expressed in this document are those of the authors.

Copyright
This document is licensed under a Creative Commons Attribution 4.0 International copyright
licence. This means anyone may copy this document in whole or in part as long as they
attribute the Human Rights Measurement Initiative as the creator and link back to the HRMI
website, https://humanrightsmeasurement.org/.

Version: 2021.6.25

 2

Human Rights Measurement Initiative Methodology

Contents
Document information 2

Introduction 4

 HRMI Economic and Social Rights Scores Methodology – Executive Summary 5
 1.1 What are economic and social rights? 5
 1.2 How does HRMI measure economic and social rights? 5
 1.3 How is this different from the way HRMI measures civil and political rights? 6
 1.4 How does HRMI’s economic and social rights methodology work? 7
 1.5 What do HRMI’s economic and social rights scores show, exactly? 7
 1.6 What are HRMI’s two different assessment standards? 8
 1.7 How are HRMI’s economic and social rights scores constructed? 8
 1.8 How does HRMI choose which indicators to use? 9
 1.9 What is HRMI’s achievement possibilities frontier? 10

 HRMI Economic and Social Rights Scores 2020 Technical Note 13
 2.1 Overview 14
 2.2 Sources and definitions of rights and obligations 16
 2.3 Measuring economic and social rights enjoyment and state resources 19
 2.4 Calculating indicator scores by benchmarking a country’s obligations of progressive realisation 24
 2.5 Rights scores & Quality of Life score 32
 2.6 References 34
 2.7 Appendix 37

Table of Figures
Figure 1: Achievement Possibilities Frontier for “Percentage of Children Not Stunted” 11
Figure 2: Rescaling the indicator scores 27
Figure 3: Oman’s resources exceed the level needed to eliminate child stunting. 28
Figure 4: Example Achievement possibilities frontier (APF) with asymptotic peak 30
Figure 5: Penalty for different Y/Yp values 31

Table 1: Rights enjoyment indicator sets used in HRMI economic and social rights scores 10
Table 2: Rights enjoyment indicators used to construct HRMI’s ESR scores 23
Table 3. Sub-scores Comprising HRMI Rights Scores by Assessment Standard 33

Appendix Table A: Indicator Definitions 37
Appendix Table B: Frontier Equations, Peak Indicator Values, Income level at Peak Indicator Value, Minimum
 Value 44

 3
Human Rights Measurement Initiative Methodology

Introduction
Human rights are those rights you have simply because you are human. Such rights are
“inherent in our nature” and “allow us to fully develop and use our human qualities, our
intelligence, our talents and our conscience and to satisfy our spiritual and other needs”
(United Nations 1987, 4).
 The Human Rights Measurement Initiative (HRMI) was formed to produce a
comprehensive suite of scores that cover the rights embodied in international law,
particularly the collection of international treaties known as the International Bill of Human
Rights. These are internationally recognised human rights acknowledged by all United
Nations member states.
 Why? Because we believe that for human rights to improve, they need to be measured.
High-quality data will create an opportunity for tremendous advances in our knowledge and
understanding about how to encourage much greater respect for human rights around the
world. We encourage you to contribute to building that knowledge.
 The initial 13 rights we are measuring can be grouped into two broad categories: eight
civil and political rights, and five economic and social rights. Each category has its own
methodology, and this document details the methodology behind the economic and social
rights measurement.
 We also encourage you to use our data portal, which you can access from our website
humanrightsmeasurement.org or from rightstracker.org. With the release of this interactive
data tool, you can explore not only our civil and political rights scores for 39 countries, but
also our economic and social rights scores for 194 countries. For each country you will be
able to see its relative strengths and weaknesses, and you will also be able to explore
performance on a particular right within different regions of the world. For the 39 countries
we have survey data for, you will also see information on which population sub-groups are
considered to be particularly at risk of abuses for each of the economic and social rights.

 4
Human Rights Measurement Initiative Methodology

 HRMI Economic and Social Rights
 Scores Methodology – Executive
 Summary
This is a brief explanation of how we constructed the Human Rights Measurement Initiative
(HRMI)’s economic and social rights scores – shown in blue on the bar charts.
 These scores are adopted and adapted from the Social and Economic Rights
Fulfilment Index (SERF Index) developed by Susan Randolph, Sakiko Fukuda-Parr, and Terra
Lawson-Remer.1 The SERF Index gauges the extent to which countries meet their
substantive economic and social right obligations of result. Specifically, HRMI’s income
adjusted “Quality of Life” score and underlying income adjusted economic and social right
scores are the SERF Index and its underlying Right Indices. These income-adjusted scores
set a benchmark consistent with each country’s immediate obligation of results under the
International Covenant for Economic, Social and Cultural Rights (ICESCR). HRMI’s global
best “Quality of Life” and its component global best economic and social right scores follow
a similar methodology, but set a benchmark reflecting countries’ common full obligation of
results under the ICESCR. For more in-depth information on how they are constructed,
please see Section 2.

1.1 What are economic and social rights?
The International Covenant on Economic, Social, and Cultural Rights (ICESCR) is a treaty
adopted by the United Nations in 1966 and agreed to by 171 nations (as of June 2021) that
sets out a list of economic, social, and cultural rights that we are all entitled to simply by
virtue of being human. These include the rights to food, health, education, housing, work, and
social security. HRMI’s scores cover five out of six of these rights, with social security being
the one that we have insufficient data on to measure independently. As relevant data
covering more countries become available, we would like to incorporate cultural rights as
well.

1.2 How does HRMI measure economic and social rights?
HRMI uses two benchmarks against which to assess country performance on each of the
five economic and social rights as well as the summary Quality of Life score. These are the
income adjusted benchmark and the global best benchmark. HRMI’s scores using the income

1 Randolph, Stewart, Fukuda-Parr, and
 Lawson-Remer, SERF Index Methodology 2021 Update Technical Note,
Economic and Social Rights Empowerment Initiative, 2021, www.serfindex.org/overview/.
 5
Human Rights Measurement Initiative Methodology

adjusted benchmark are measures of the extent to which countries are using their resources
as effectively as possible to progressively fulfil their inhabitants’ substantive economic and
social rights. In other words, we look at the extent to which the people in a country enjoy the
substantive rights they are entitled to, taking into account how rich or poor the country is
and therefore how well it ought to be able to ensure that food, housing etc. are accessible
for its people. HRMI’s scores using the global best benchmark are measures of the extent to
which countries are fulfilling their inhabitants’ substantive economic and social rights
relative to the best performing countries at any resource level. Thus, the two benchmarks
assess countries’ performance relative to their current and full obligations, respectively.

1.3 How is this different from the way HRMI measures civil
 and political rights?
HRMI measures these two groups of rights quite differently as is consistent with state
obligations under international law. Under international law, the state must immediately and
completely respect, protect, and fulfil all rights listed in the International Covenant for Civil
and Political Rights, while the substantive rights listed in the International Covenant on
Economic, Social, and Cultural Rights are to be progressively realised using the maximum of
available resources at all times. Thus, HRMI’s income adjusted economic and social rights
scores measure economic and social rights relative to the extent to which each country
ought to be able to fulfil those rights for its people, given its current resources. Because
countries are obligated to progressively ensure the full realisation of the substantive rights
enumerated in the ICESCR, we also track the extent to which countries have achieved full
realisation of the substantive economic and social rights concerned. Because progressive
realisation does not apply to civil and political rights, our civil and political rights scores are
not adjusted to account for the resources available to a country.
 A second important difference is that HRMI’s economic and social rights scores are
calculated from objective, internationally comparable, publicly accessible statistical data
published by national and international bodies. Our civil and political rights scores, on the
other hand, are calculated using surveys of human rights experts in each country. This is
because objective statistical data that meets our standards, are not available for most civil
and political rights. For more details on how we measure civil and political rights please see
our forthcoming Civil and Political Rights section of the 2021 HRMI Methodology handbook.
 The methodology used to identify those population subgroups more likely to have their
rights violated are the same for civil and political rights as well as economic and social
rights.

 6
Human Rights Measurement Initiative Methodology

1.4 How does HRMI’s economic and social rights
 methodology work?
Under international law, as noted above, countries are obligated to use “the maximum of
[their] available resources” to progressively achieve “the full realization of the rights”
specified in the Covenant (International Covenant of Economic, Social, and Cultural Rights,
Article 2.1). This means that at any given time each country has a different level of
obligation and a given country’s obligation increases over time as its resource capacity
expands. The methodology used to construct our income adjusted scores aims to assess
the level of rights enjoyment achieved relative to the country’s current level of obligation;
that is, what the country could feasibly achieve in terms of fulfilling its people’s rights given
the level of resources it has. We do this by mapping an evidence-based achievement
possibilities frontier to benchmark each country’s obligation at any given time. The
estimated achievement possibilities frontiers plateau at the resource level where it first
becomes possible to ensure the highest level of rights enjoyment observed at any income
level. This plateau value is the benchmark used to construct our global best scores.

This methodology is unique in:
 • considering the perspective of both the rights-holder (i.e. the individual people)
 and the duty-bearer (i.e. the government) both currently and eventually;
 • making possible objective assessment of whether the overall situation in a
 country is improving or deteriorating both vis-a-vis the country’s immediate and
 eventual obligations;
 • allowing cross-country comparisons of countries’ fulfilment of their current and
 eventual economic and social rights obligations; and
 • providing a methodology to examine disparity in rights fulfilment between
 regions, or between racial and ethnic or other population sub-groups within a
 given country.

1.5 What do HRMI’s economic and social rights scores
 show, exactly?
HRMI’s economic and social rights scores show the percentage of the benchmark
achievement obtained. In the case of the income adjusted benchmark, this is the percentage
of the currently feasible achievement obtainable, given the country’s per capita income
level. A low score means a country is not fulfilling the rights concerned nearly to the extent
that should be possible at its per-capita income level. A score of 100% relative to the income

 7
Human Rights Measurement Initiative Methodology

adjusted benchmark does not mean everyone in the country enjoys the right; it means the
country is doing as well at ensuring that right as the best performing countries have at that
per-capita income level. Thus, in the case of a very poor country, the economic and social
rights scores can be quite high, even though a lot of people in that country do not have
proper access to food, housing, education, etc. In contrast, in the case of the global best
scores, HRMI’s economic and social rights scores show the country’s percentage
achievement relative to the highest enjoyment level observed in any country at any per
capita income level. A score of 100% relative to the global best benchmark means the
country is doing as well at ensuring the right or right aspect as the best performing country
has at any per-capita income level. In the case of a very poor country, its global best scores
will be substantially lower than its income adjusted scores. In contrast, for wealthy countries
there will be little, if any, difference between their income adjusted and global best scores.

1.6 What are HRMI’s two different assessment standards?
HRMI’s economic and social rights scores use two separate assessment standards: our
“low-and middle-income” assessment standard and our “high-income” assessment
standard. The low-and middle-income assessment standard holds countries to a basic
standard that reflects the challenges that low-and middle-income countries face. The high-
income standard holds countries to a higher standard more reflective of the economic and
social rights challenges that high-income countries face.
 We have these two different assessment standards because richer countries, having
more resources, are typically further advanced in making sure that their people are well-fed,
housed, educated, etc. So, we need to use indicators that can capture the different
challenges these countries face. For example, richer countries have often already achieved
high primary education participation and their focus is on raising the quality of education.
Although education quality is also critically important for less developed countries, the
indicator for education quality is not available for most low-and middle-income countries.
Scores using both standards are calculated for all countries where the data are available,
enabling researchers to evaluate countries with the available data on either standard.

1.7 How are HRMI’s economic and social rights scores
 constructed?
We construct HRMI’s economic and social rights scores by following the steps below:
 • Step 1: Identify indicators that broadly summarise the extent to which people
 enjoy each economic and social right, and which are available on an
 internationally comparable basis for a large number of countries in the world.

 8
Human Rights Measurement Initiative Methodology

 • Step 2: Specify how much a country ought to be able to fulfil its people’s rights
 given the country’s per capita income in the case of the income adjusted scores,
 once resource constraints are no longer binding in the case of the global best
 scores; and compute indicator performance scores for each indicator reflecting
 the extent to which a country meets its obligations.
 • Step 3: Combine indicator performance scores (using the benchmark concerned)
 into aggregate scores for each of the five economic and social rights, and
 average the result to obtain the Quality of Life score.

1.8 How does HRMI choose which indicators to use?
We use a number of criteria when selecting which data will be the best indicators of
economic and social rights fulfilment, including:
 • how well the indicator reflects enjoyment of the right (concept validity);
 • reliability of the data;
 • objectivity of measurement methods;
 • comparability across countries and over time;
 • public accessibility;
 • data availability vis-a-vis country coverage and frequency of collection; and
 • the extent of variation among countries.
Indicator sets are selected to:
 • reflect the challenges most relevant to fulfilling a given right, rather than to
 encompass all aspects of a given right;
 • prefer those specifying the percentage of the population enjoying the right over
 those indicating the average level of enjoyment of the right across the
 population. This is because high levels of enjoyment on the part of some people
 can hide the denial of the right to many;
 • prefer indicators of flow variables to indicators of stock variables, since they give
 us a more up-to-date picture of the human rights situation; and
 • prefer bellwether indicators sensitive to a variety of factors relating to rights
 fulfilment.

We attempt to keep the number of indicators of a given right to three, because our goal is to
provide a summary measure of performance that is comparable across countries and can
show trends over time. Our selection of indicators is practically constrained by:
 • availability. The surveys providing many of the indicators on enjoyment of rights
 are not conducted annually, so the data used for each year are not always

 9
Human Rights Measurement Initiative Methodology

 unique. For example, in the case of the Right to Education score for Cameroon,
 the 2017, and 2018 series use data on the net primary school enrolment rate in
 2017. Additionally, data on some right aspects we would like to include are only
 available for a handful of countries.
 • relevance: Ensuring all students complete primary school is not an issue for
 OECD countries, so although this is an indicator we use in our low-and middle-
 income assessment standard, it is not an indicator used in our high-income
 assessment standard.
 • Table 1: Rights enjoyment indicator sets used in HRMI economic and social
 rights scores
Economic and social right Indicator
• Assessment standard
Food
• Low-and middle-income % children (under 5) not stunted
• High-income % population food secure (based on the food insecurity experience
 scale, FIES)
Education
• Low-and middle-income Net primary school enrolment rate
• Both Net secondary school enrolment rate
• High-income % students scoring level 3 or better on the PISA test (by topic–
 Mathematics, Science & Reading)
Health
• Low-and middle-income Modern Contraceptive use rate
• Both Child (under 5) survival rate
• Both Adult (15-60) survival rate
• High-income % live births not low birth weight
Housing/Water/Sanitation
• Low-and middle-income % population with “basic” access to water on premises
• Low-and middle-income % population with access to at least “basic” sanitation
• High-income % population with “safely managed” sanitation
• High-income % poorest quintile of population with access to affordable housing
 (post subsidy housing costs less than 40% of disposable income.)

Decent Work/Social Security
• Low-and middle-income % with income >$3.20 (2011 PPP$**) per day
• High-income % with income > 50% median income
• High-income % unemployed not long-term unemployed

*PISA is the Program for International Student Assessment that implements the surveys of student
learning outcomes that we use.
**PPP$ means purchasing power parity dollars. This means that currency conversions between
countries have been made using conversion factors that equate to the actual purchasing power of the
currencies rather than using official exchange rates. The prices used are those prevailing in 2011.

1.9 What is HRMI’s achievement possibilities frontier?
This is a tool HRMI uses to assess what is feasible for countries to achieve in terms of their
ability to deliver on economic and social rights for their people. This is done by seeing what

 10
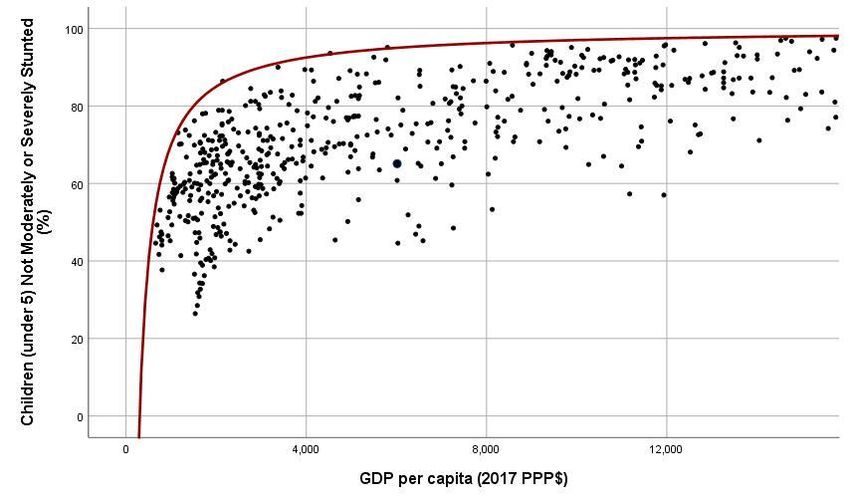
Human Rights Measurement Initiative Methodology

has been achieved by other countries over history and at different levels of available
resources.
 The achievement possibilities frontier (APF) for a given indicator is constructed by
plotting the observed value of the indicator against per capita GDP (2017 PPP$) for all
countries over roughly a twenty-year period. The frontier is defined as the outer envelope of
the scatter plot, and the equation specifying the frontier is estimated by fitting a curve to the
observations that define the outer boundary of the scatter plot. See Section 2 for detailed
interpretation.

 Figure 1: Achievement Possibilities Frontier for “Percentage of Children Not Stunted”

 Achievement Possibilities
 Frontier

 India

 The approach to assessing a country’s performance using the income adjusted
benchmark is to compare the country’s actual performance to the feasible performance as
benchmarked by the achievement possibilities frontier. For example, India’s child stunting
rate in 2017 (the most recent observation available) was 34.7%, implying the percentage of
children not stunted was 65.3% and is shown in the above plot as the largest dot with India’s
name next to it. India’s per capita income level in 2017 was $6186 (2017 PPP$). At the per-
capita GDP of $6,186 (2017 PPP$), it should be possible to ensure that 95.2% of Indian
children under 5 are not stunted as shown by the height of the red frontier line directly above
India’s observation. Our first cut at assessing India’s performance on the right to food using
the income-adjusted benchmark takes the ratio of the observed percentage of children that

 11
Human Rights Measurement Initiative Methodology

are not stunted (65.3%) to the benchmark percentage of children not stunted (95.2%), and
then multiplies by 100 to yield the percentage of the feasible level achieved.
 After that, some final steps in our calculations are still needed. Since the plausible
range of indicators varies, we also need to standardise scores by taking into account how
close the lowest observed value is to zero. In the case of our right to food indicator, the
lowest value observed is 26% (the percentage of children not stunted in Bangladesh in
2000). We therefore standardise the scores by computing the percentage of the feasible
level achieved with reference to the minimum observed score. So, looking again at India, its
achievement relative to this minimum observed score is 65.3% - 26% = 39.3% of children not
stunted. Relative to the minimum, it is feasible for India to achieve 95.2% - 26% = 69.2% of
children not stunted. Thus, India’s income adjusted score on the Right to Food is calculated
as (39.3%/69.2%) x 100 = 56.8%.
 The global best benchmark sets the benchmark for all countries at the maximum
height of the estimated APF or at the income level at which all people enjoy the right. Since
2.3 percent of children that are growing normally are expected to be more than two standard
deviations below the mean height for their age, the global best benchmark is set at 97.7% of
children are not stunted. India’s global best right to food score is calculated as before, only
substituting the global best benchmark for the income adjusted benchmark. So now we have
(65.3% - 26%)/ (97.7% - 26%) = 54.8%. So long as resources are binding, country scores
using the global best benchmark will be lower than those using the income adjusted
benchmark.
 In the case of some richer countries, HRMI’s economic and social rights scores also
take into account the fact that some countries have many times the resources needed to
ensure that all people enjoy a given right, yet still fail to make sure that everyone enjoys the
rights to which they are entitled. For example, Oman and Mexico have nearly an identical
percentage of children that are not stunted (90% for Mexico and 88.6% for Oman), yet
Oman’s per-capita income is nearly 1.5 times higher than Mexico’s. For countries like Oman
with per-capita income levels multiple times what is needed to reach the frontier, but who
still fail to do so, we impose a penalty on their income adjusted and global best scores.

 12
Human Rights Measurement Initiative Methodology

 HRMI Economic and Social Rights
 Scores 2020 Technical Note2
Susan Randolph, John Stewart, Sakiko Fukuda-Parr, and Terra Lawson-Remer

This technical note provides a detailed explanation of the methodology used to construct
the Human Rights Measurement Initiative’s (HRMI’s) 2021 economic and social rights
scores. HRMI’s economic and social right scores are adopted from the International Social
and Economic Rights Fulfilment Index (SERF Index) and were developed by Susan Randolph,
Sakiko Fukuda-Parr, and Terra Lawson-Remer. As with most measurement initiatives, the
SERF Index methodology has evolved to take account of emerging conceptual and data
issues. The International SERF Index has been refined six times since it was initially
published in 2009. HRMI’s 2021 economic and social rights scores are the underlying Right
Indices that comprise the 2021 Update of the International SERF Index scores and cover the
years 2007 to 2018.
 The book, Fulfilling Social and Economic Rights by Sakiko Fukuda-Parr, Terra Lawson-
Remer and Susan Randolph (Oxford: Oxford University Press, 2015) provides a detailed
account of the basic SERF Index methodology and insights gained from its application that
is accessible to practitioners.3 (https://global.oup.com/academic/product/fulfilling-social-
and-economic-rights-9780199735518?cc=us&lang=en&# ) The conceptual and
methodological underpinnings of the SERF Index are also fully elaborated in two peer
reviewed publications:
• Fukuda-Parr, Sakiko, Terra Lawson-Remer and Susan Randolph (2009) ‘An Index of
 Economic and Social Rights Fulfillment: Concept and Methodology.’ Journal of Human
 Rights. 8: 195-221.
 https://www.tandfonline.com/doi/abs/10.1080/14754830903110194

• Randolph, Susan, Sakiko Fukuda-Parr, Terra Lawson-Remer (2010) ‘Economic and Social
 Rights Fulfillment Index: Country Scores and Rankings.’ Journal of Human Rights, 9.3,
 230-261. https://www.tandfonline.com/doi/abs/10.1080/14754835.2010.501257

2 This technical note is adapted from Randolph, S., J. Stewart, S. Fukuda-Parr, and T. Lawson-Remer, “SERF Index
Methodology: 2021Technical Note (Economic and Social Rights Empowerment Initiative, 2021),
www.serfindex.org.data with permission from the Economic and Social Rights Empowerment Initiative.
Refinement of the SERF methodology was supported in part by the National Science Foundation under grant
number 1061457. Any opinions, findings and conclusions or recommendations expressed in this material are
those of the authors and do not necessarily reflect the views of the National Science Foundation.
3 Fulfilling Social and Economic Rights was the winner of the 2019 Grawemeyer Award for Ideas Improving World

Order.

 13
Human Rights Measurement Initiative Methodology

2.1 Overview
HRMI’s economic and social rights (ESR) scores measure the performance of countries on
the fulfilment of key economic and social rights obligations. HRMI’s scores use objective,
internationally comparable, publicly accessible statistical data published by national and
international bodies. HRMI’s ESR scores provide summary indicators of performance for
human rights that are grounded in international law. The International Covenant for
Economic, Social, and Cultural Rights (ICESCR) articulates a list of essential substantive
economic and social rights that the 171 nations (as of June 2021), representing a wide
range of cultural traditions who have ratified it and concur that they are essential. These are
the rights to food, health, education, housing, work, and social security. HRMI’s ESR scores
cover five out of six of these rights. We do not yet have sufficient internationally comparable
data to independently include social security. However, the indicators used to measure the
right to work also capture key elements of the right to social security; available data just do
not enable a full separation between the right to work and the right to social security.
 A fundamental principal of international law is that countries have a duty to
progressively realise economic and social rights to the maximum of their available
resources. Statistics like school enrolment and infant mortality tell us only the extent to
which individuals enjoy economic and social rights, but not whether a state is complying
with its obligations to use the maximum of its available resources to progressively respect,
protect, and fulfil human rights. Measuring economic and social rights fulfilment requires
considering the perspectives of both the rights-holding individual and the duty-bearing
government. While many widely available socio-economic indicators and other metrics, such
as the Human Development Index (HDI) assess the level of rights enjoyment, they ignore the
obligation level of the duty bearing state. HRMI’s ESR methodology estimates obligations for
progressive realisation by using an innovative approach that maps an evidence based
‘achievement possibilities frontier’ (APF) to benchmark each country’s obligation at any
given time. This methodology is the only ESR methodology that:
 • considers the perspective of both the rights-holder and the duty-bearer
 measuring state compliance with obligations of progressive realisation;
 • makes possible objective assessment of whether the overall situation in a
 country is improving or deteriorating;
 • allows cross-country comparisons of rights fulfilment; and
 • provides a methodology to examine disparity in rights fulfilment between
 regions, or between racial and ethnic or other population sub-groups.

 14
Human Rights Measurement Initiative Methodology

The HRMI income-adjusted scores measure a country’s achievement relative to what it is
feasible to achieve at the country’s per capita income level. That is, they look at the
enjoyment level of a right in a country and compare it to the best observed achievement in
countries with approximately the same per capita income. This best-practice achievement
level is the income-adjusted benchmark level of rights enjoyment. More specifically, the
HRMI income-adjusted scores show the percentage of the feasible achievement obtained at
the country’s per capita income level. A low score means a country is not fulfilling the right
concerned to the extent possible at its per capita income level; it is failing to effectively use
the maximum of its available resources to achieve the right. An income-adjusted score of
100% on a right or right aspect does not mean everyone in the country enjoys the right; it
means the country is doing as well at ensuring the right as the best performing countries at
that per capita income level. Thus, in the case of a very poor country, the score on the right
can be quite high even though the enjoyment level of the right is quite limited. A country
achieving an income-adjusted score of 100% cannot rest on its laurels.
 All countries are obligated to achieve progressively the full realisation of the rights
enumerated in the ICESCR. As a result, HRMI also assesses country performance relative to
what evidence shows is feasible once income is no longer a constraint, what we call the
global best benchmark. A country with a high income-adjusted score may simultaneously
have a low global-best score on the same right or right aspect indicating that although it is
meeting its immediate obligation under Article 2.1 of the ICESCR to fulfil that right to the
“maximum of its available resources”, it still has a long way to go to fully meet its obligation
to realise the right. Some countries have more than enough income to reach the global best
benchmark but fail to do so. For these countries, a penalty is imposed on the countries’
scores. The penalty is larger the lower the enjoyment level of the right. The penalty is also
larger the more the country’s income exceeds the income necessary to fully realise the right.
As a result, in the case of a country with a high per capita income, the country’s score on a
right or right aspect could well be lower than the raw indicator value reflecting the enjoyment
level of the right or right aspect.
 Data constraints, coupled with the different rights challenges in high income countries
versus other countries, have led to our creation of two separate assessment standards:
 • The “low-and middle-income” assessment standard holds countries to a basic
 level of rights fulfilment, and
 • The “high-income” assessment standard holds countries to a higher standard
 more relevant to the right challenges facing high-income countries.

 15
Human Rights Measurement Initiative Methodology

Scores using both standards are calculated for all countries with necessary data, enabling
researchers to evaluate countries with the necessary data on either standard. HRMI’s ESR
scores are comparable across time for each country, as well as between countries. When
computing a country’s score on a right, the most recently available data on a given right
enjoyment indicator (and the per capita income data for the corresponding year) is used.
However, because the surveys providing many of the indicators on enjoyment of rights are
not conducted annually, the data used for each year are not always unique. For example, in
the case of the Right to Education score for Cameroon, the 2017 and 2018 series use data
on the adjusted net primary school enrolment rate in 2017. If the most recently available
data on an indicator is more than 10 years prior, the score for that right is recorded as
“missing”.4
 The construction of HRMI’s ESR scores is further elaborated below. In addition to the
ESR scores described below, HRMI collects information on which population subgroups are
most likely to be unable to claim the different economic and social rights for the 39
countries that were part of our Civil and Political Rights (CPR) survey. The methodology
used to identify these “groups at risk” is described in the Civil and Political Rights section of
the 2021 HRMI Methodology Handbook.

2.2 Sources and definitions of rights and obligations
The International Covenant of Economic, Social, and Cultural Rights (ICESCR)5 commits
governments to fully realise the economic, social, and cultural rights enumerated therein
progressively. As stated in Article 2.1:

 “Each State Party to the present Covenant undertakes to take steps, individually
 and through international assistance and co-operation, especially economic and
 technical, to the maximum of its available resources, with a view to achieving
 progressively the full realization of the rights recognized in the present Covenant,
 by all appropriate means including particularly the adoption of legislative
 measures.”

 The ‘progressive realisation’ provision recognises that states have very different
starting points in their ability to achieve full enjoyment of economic and social rights, as
noted by Fukuda-Parr, et al. (2015)

4 Downloadable excel files with information on the “most recent data year” for each indicator used in the
construction of each right index for each year are available at https://humanrightsmeasurement.org/download-
the-dataset/ Researchers who prefer a less generous look back period can use the files from the 2021 Update of
the SERF Index (HRMI’s economic and social rights metrics) to recode observations they consider too old as
missing.
5 United Nations (1966). International Covenant on Economic, Social and Cultural Rights (ICESCR). Adopted 16

December 1966, General Assembly Resolution 2200 (XXI), U.N. GAOR, 21st Session, Supp. No. 16, U.N. Document
A/6316 (1966), 993 U.N.T.S. 3 (entered into force 3 January 1976).

 16
Human Rights Measurement Initiative Methodology

 “Countries around the world face hugely different levels of deprivation and
 capacity. Inherent in the idea of progressive realization is that a government’s
 ability to fulfil rights commitments depends on the level of resources (financial
 and other) available in the country.”6

 The enjoyment of the right to the highest attainable standard of health, for example,
cannot be achieved overnight, as facilities need to be built, personnel trained, and policy
incentives for businesses and households put in place and so on, for people to have access
to healthcare. These arrangements require financial resources which may be beyond what
governments and households can currently mobilise. Consequently, the performance of
states with regard to progressively realising economic and social rights cannot be judged on
the basis of outcomes – enjoyment of rights by people – alone. For example, the
performance of the United States and Malawi cannot be compared on the basis of their
respective levels of child survival rates considering the hugely different levels of capacity in
these two countries.
 Thus, a country’s performance in fulfilling obligations for economic and social rights
depends on:
 • the actual economic and social rights (ESR) outcomes people enjoy, as indicated
 by socio-economic statistics that proxy for particular rights; and
 • a society’s capacity for fulfilment, as determined by the amount of economic
 resources available overall to the duty-bearing state.

The provision of progressive realisation has complicated and frustrated efforts to monitor
countries’ fulfilment of their economic and social rights obligations, since, as Human Rights
measurement scholar Chapman notes:

 “it necessitates the development of a multiplicity of performance standards for
 each right in relationship to the varied… contexts of specific countries”.7

That is, measures of ESR outcomes must reflect variable local specificities. The monitoring
procedure adopted by the Committee on Economic, Social and Cultural Rights assesses
performance relative to ‘benchmarks’. But this leaves the problem of setting the benchmark.
In the absence of a conceptual and evidence-based model for setting benchmarks, States
enjoy considerable discretion over where their benchmark is set, thus effectively leaving
open an ‘escape hatch’ for States to avoid meeting their ESR obligations.

6 Fukuda-Parr, Sakiko, Terra Lawson-Remer, and Susan Randolph, Fulfilling Social and Economic Rights (Oxford:
Oxford University Press, 2015, p. 11).
7 Chapman, Audrey. ‘The Status of Efforts to Monitor Economic, Social, and Cultural Rights,’ in Economic Rights:

Conceptual, Measurement and Policy Issues, eds. Shareen Hertel and Lanse Minkler (Cambridge: Cambridge
University Press, 2007). Chapter 7, p 150.

 17
Human Rights Measurement Initiative Methodology

 HRMI’s ESR scores overcome this problem. The innovation of the methodology lies in
the construction of Achievement Possibilities Frontiers (APFs) that use an evidence-based
approach to specify each country’s level of obligation for progressive realisation with regard
to various aspects of each economic and social right. The basic construction of HRMI’s
Right scores involves the following steps:
 • Identify indicators that broadly summarise: 1) the enjoyment level of the
 substantive rights articulated in international law and 2) country resource
 capacity.
 • Specify country obligations with regard to each of the selected indicators and
 compute indicator scores reflecting the extent to which a country meets its
 obligations on each aspect of the right.
 • For each substantive right, aggregate the indicator scores for the different right
 aspects or the right into a right score by averaging the indicator scores.
 • Average the right scores to get the Quality of Life score.

For most ESRs, resource constraints do not bind throughout the income range observed
globally. Once resources no longer impose a constraint, countries are obliged to fully realise
the substantive rights guaranteed under the ICESCR.8 For this reason, HRMI uses two
different benchmarks against which to assess country performance; the income-adjusted
benchmark and the global best benchmark. HRMI’s scores using the income adjusted
benchmark are measures of the extent to which countries are using their resources as
effectively as possible to progressively fulfil their inhabitants’ substantive economic and
social rights. In other words, we look at the extent to which the people in a country enjoy the
substantive rights they are entitled to, taking into account how rich or poor the country is
and therefore how well it ought to be able to ensure that food, housing etc. are accessible
for its people. HRMI’s scores using the global best benchmark are measures of the extent to
which countries are fulfilling their inhabitants’ substantive economic and social rights
relative to the best performing countries at any resource level. Thus, the two benchmarks
assess country performance relative to their current and full obligations, respectively.

8 United Nations (1966).

 18
Human Rights Measurement Initiative Methodology

2.3 Measuring economic and social rights enjoyment and
 state resources
2.3.1 Sources and definitions of rights and obligations
HRMI ESR scores draw on international law – the Universal Declaration of Human Rights9
(UDHR), ICESCR10 and numerous other international human rights legal instruments11 – to
define the substantive rights of individuals and the obligations of states. The substance of
these rights is detailed in General Comments of the Committee on Economic, Social, and
Cultural Rights (CESCR).12

 The General Comments identify seven substantive economic and social rights; the
right to:
 • adequate food,
 • education,
 • highest attainable standards of physical and mental health,
 • adequate housing,
 • water and sanitation,
 • decent work, and
 • social security.

Following the Office of the High Commissioner for Human Rights 2012 guidelines on using
indicators to monitor human rights, we collapse these into six rights, in view of the fact that
access to water and sanitation are key components of the right to housing.13

9 United Nations (1948). Universal Declaration of Human Rights (UDHR., Adopted 10 Dec. 1948, United Nations
General Assembly Res. 217 A (III), (1948).
10 United Nations (1966).
11 These international legal instruments include the General Comments of the relevant treaty body committees,

reports of Special Rapporteurs, and other documents such as reports of seminars, task forces and working
groups.
12 Committee on Economic Social and Cultural Rights.(1991)‘General Comment 4:The Right to Adequate

Housing’,6thSession, 13 December;(1997) ‘General Comment 7: The Right to Adequate Housing—Forced
Evictions’, 16thSession, 20 May; (1999a) ‘General Comment 11:Plans of Action for Primary Education’,
20thSession, Geneva, 26 April – 14 May 1999, Document E/C.12/1999/4; (1999b) ‘General Comment 12: The
Right to Adequate Food’, 20thSession, Geneva, 26 Apr – 14 May, Doc. E/C.12/1999/5; (1999c) ‘General Comment
13: The Right to Education’,21stSess. 15 November – 3 December 1999, Document E/C.12/1999/10; (2000)
‘General Comment 14: The Right to the Highest Attainable Standard of Health’, 22nd Session, 25 April – 12 May
2000, Document E/C.12/2000/4 ; (2005) ‘General Comment18:The Right to Work’, 35 th Session, 7-25 November
2005, Document E/C.12/GC/18, 6 February 2006;(2008) ‘General Comment 19:The Right to Social Security’, 39th
Session, 5-23 November. Document E/C.12/GC/19, 4 February 2008; ‘General Comment No. 23 (2016) on the
right to just and favourable conditions of work’, E/C.12/GC/23, 27 April 2016; ‘General Comment No. 22 (2016)
on the right to sexual and reproductive Health’ E/C.12/GC/22, 2 May 2016.
13 United Nations Office of the High Commissioner for Human Rights (2012). Human Rights Indicators: A Guide to

measurement and implementation. HR/PUB/12/5. New York: Office of the High Commissioner for Human Rights,
United Nations.

 19
Human Rights Measurement Initiative Methodology

 States bear the primary responsibility for the realisation of the rights of citizens and
individuals residing within their borders. Their obligations are threefold: to respect, to protect,
and to fulfil rights. These obligations also include the cross-cutting procedural rights of non-
discrimination, participation, and accountability. General Comments 314 , 915, and 2016 along
with the Limburg Principles17and Maastricht Guidelines18 elaborate the nature and extent of
the obligations accepted by State parties to the Covenant.
 HRMI’s ESR scores measure State parties’ compliance with their obligations for
progressive realisation of economic and social rights, focusing on outcomes reflected in
enjoyment of the substantive rights by people and in the case of HRMI’s income-adjusted
scores, adjusted for state capacity. They do not attempt to assess the extent to which
States ensure the procedural rights of non-discrimination, participation, and accountability.
HRMI’s ESR scores complement other measurement tools such as those suggested by the
Office of the High Commissioner for Human Rights.19 These and other recent initiatives,
such as the Right to Education Index,20 focus on different aspects of obligations, such as
process (or policy efforts made by government), structure (institutionalised provisions), and
outcomes (level of rights enjoyment in the population), while assessing performance on 50
to 100 aspects of each right. However, none of these other measurement tools attempts to
provide as broad a summary of performance and benchmark outcomes according to the
obligation of progressive realisation as do HRMI’s ESR scores.

2.3.2 Selecting the indicators of rights enjoyment and resource capacity
A number of criteria govern the selection of the indicators. Beyond making sure selected
indicators appropriately reflect enjoyment of the right concerned and resource capacity,
selected indicators must be:

14 Committee on Economic, Social and Cultural Rights (1990) ‘General Comment 3: The Nature of States Parties’
Obligations’, 5th Sess., December 14.
15 Committee on Economic, Social and Cultural Rights (1998) ‘General Comment 9: The Domestic Application of

the Covenant’ 19th Session, 16 November – 4 December, Document E/C.12/1998/24, 3 December 1998.
16 Committee on Economic, Social and Cultural Rights (2009) ‘General Comment No. 20: Non-discrimination in

economic, social and cultural rights’, 42nd session, May 4-22, Document E/C.12/GC/20, 2 July 2009.
17 United Nations (1987). The Limburg Principles on the Implementation of the International Covenant on

Economic, Social and Cultural Rights. Guidelines adopted at a workshop sponsored by the International
Commission of Jurists, the Faculty of Law of the University of Limburg, and the Urban Morgan Institute for
Human Rights, University of Cincinnati, Maastricht, Netherlands, 22-26 January 1997, Document
E/CN.4/1987/17.
18 United Nations (2000). The Maastricht Guidelines on Violations of Economic, Social and Cultural Rights.

Guidelines adopted at a workshop sponsored by the International Commission of Jurists, the Urban Morgan
Institute for Human Rights and the Center for Human Rights of the Faculty of Law of Maastricht University,
Maastricht, Netherlands, 22-26 January 1997. Document E/C.12/2000/13.
19 United Nations Office of the High Commissioner for Human Rights (2012). For comparison of SERF (HRMI’s

ESR metrics) with other proposals, see Randolph et al, Journal of Human Rights 2010, and Fukuda-Parr, Sakiko,
‘The Metrics of Human Rights: Complementarities of Human Rights and Capabilities Approach’, Journal of
Human Development and Capabilities, Vol. 12:1 pp73-89.
20 See https://www.rtei.org/en/.

 20
Human Rights Measurement Initiative Methodology

 • based on reliable data;
 • measured with objective methods;
 • legitimately comparable across countries and over time; and
 • publicly accessible.

To satisfy these criteria, all data sets used to construct HRMI’s ESR scores are international
series that are maintained by international organisations. Further considerations for
indicator selection include:
 • data availability and country coverage;
 • frequency of data collection;
 • the extent of variation among countries;
 • ability to reflect the challenges most relevant to fulfilling a given right;
 • indicators specifying the percentage of the population enjoying the right are
 preferred to those indicating the average level of enjoyment of the right across
 the population;
 • indicators of flow variables are preferred to indicators of stock variables; and
 • preference is given to bellwether indicators sensitive to a variety of factors
 related to rights fulfilment.

In general, we have sought to keep the number of indicators reflecting different key aspects
of a given right down to three.
 Our selection of indicators is also practically constrained by current data availability.
This, plus different rights challenges in high income OECD countries versus most other
countries, led to our creation of two separate sets of scores using two different assessment
standards: one standard relevant to the majority of countries, our “low-and middle-income”
assessment standard, and the other most relevant to high income countries, our “high-
income” assessment standard. For example, the high-income assessment standard includes
a measure of the quality of schooling, performance on the Program for International Student
Assessment (PISA) Mathematics, Science and Reading, among the education indicators.
The quality of education is no less a concern for all other countries, it is just that there is no
measure with broad coverage available at this time for low-and middle-income countries.
Regarding relevance, ensuring all students complete primary school is not an issue for high-
income OECD countries, so although this is an indicator we use in our low-and middle-
income assessment standard, it is not included in our high-income assessment standard.

 Data limitations currently preclude defining separate scores for all six rights. HRMI’s
ESR scores include separate scores for five rights—the rights to food, health, education,

 21
Human Rights Measurement Initiative Methodology

housing, and work—with key elements of the right to social security captured by the right to
work and cover the years 2007 through 2018. Available data do not enable us to fully
separate the right to work from the right to social security at this time. In the case of HRMI’s
ESR scores for the right to food using the high-income assessment standard, data are only
available for 2015, 2016, 2017 and 2018. We have found it necessary to use two different
assessment standards given the differences in data availability and current rights
challenges between the two groups of countries. However, rights scores using both
standards are calculated for all countries (low- and middle-income as well as high-income
countries) with available data, enabling researchers to evaluate countries with the available
data on either standard. Table 2 below shows the indicators currently used to measure
enjoyment of key aspects of each right for each of the two assessment standards.21 The
2021 Update incorporates several changes. First, for the low- and middle-income
assessment standard we use the modern contraceptive use rate rather than the simple
contraceptive use rate to measure access to reproductive health care. This is because the
simple contraceptive use rate includes traditional methods that do not entail access to
reproductive health care. Second, for the high-income assessment standard, we have
switched our indicator of affordable housing to one that better captures the full cost of
housing. Specifically, the indicator is the percentage of the poorest quintile of the
population living in households where the total housing cost (‘net’ of housing allowances)
represents less than 40% of disposable income (‘net’ of housing allowances). As was the
case for our last update, we provide scores disaggregated by sex in the case of all aspects
of the right to education as well as the overall right to education itself, in the case of the
child and adult aspects of the right to health, and in the case of the right to food for the low-
and middle-income assessment standard.

 Appendix Table A gives details of sources and definitions for each indicator. A detailed
discussion of why particular indicators were selected is provided in Fukuda-Parr, Lawson-
Remer, and Randolph (2015). As noted at the outset, States are required to fulfil economic
and social rights progressively, and to commit the maximum of available resources to meet
this obligation. HRMI ESR scores use per capita GDP as the indicator of State resource
capacity measured in 2017 purchasing power parity (PPP) dollars. While it might be argued
that States with larger budgets or better institutions have a greater capacity to fulfil
economic and social rights than those with the same per capita income but smaller budgets

21In response to feedback from a wide range of scholars and practitioners, some of the indicators used to
construct the SERF Index—and accordingly HRMI’s ESR metrics—have been refined in the current version of the
SERF Index and differ from those reported in Randolph, Fukuda-Parr and Lawson-Remer (2010) and Fukuda-Parr,
Lawson-Remer, and Randolph (2015) and HRMI’s 2019 data set.

 22
Human Rights Measurement Initiative Methodology

or poorer institutions, a State’s capacity depends on the choices it makes with regard to its
taxing policies and institutional structure. Since the obligation to progressively realise
economic and social rights requires States to collect and expend resources at the level
necessary to meet their rights obligations, it is appropriate to measure resource capacity as
reflected by the total resources available to the State, not the portion of those resources the
State chooses to tap. We measure GDP per capita data in 2017 international purchasing
power parity dollars (2017 PPP$) to standardise for inflation and purchasing power across
countries and thus enable comparison over time and across countries.22

 Table 2: Rights enjoyment indicators used to construct HRMI’s ESR scores

 Assessment Standard
 Human Right/Indicator Low- and Middle income High-income
 Right to food
 % Children (under 5) not stunted √
 % People food secure (based on the food √
 insecurity experience scale, FIES)
 Right to education
 Net secondary school enrolment rate √ √
 Net primary school enrolment rate √
 % Students achieving level 3 or better on √
 PISA test (by topic, Mathematics,
 Science & Reading)
 Right to health
 % Children (under 5) surviving to age 5 √ √
 % Adult (15-60) survival rate √ √
 % Couples (15-49) using modern √
 contraceptives
 % New-borns not low birth weight ($3.20 (2011 √
 PPP$) per day
 % Population with income > 50% median √
 income
 % Unemployed not long-term (>12 √
 months) unemployed

22 Purchasing power parities (PPPs) are the rates of currency conversion that equalise the purchasing power of
different currencies by eliminating the differences in price levels between countries. The year 2017 is the most
recent survey year of the International Comparison Project that estimates PPP$ and accordingly the PPP$ prices
are the prices prevailing in 2017. See for example https://datacatalog.worldbank.org/dataset/international-
comparison-program-2017 for more information.

 23
You can also read