METRO OFFICE First Half 2018 - Research and Forecast Report - Colliers International
←
→
Page content transcription
If your browser does not render page correctly, please read the page content below
Research and
Forecast Report

                     Accelerating success.

   METRO
   OFFICE
   First Half 2018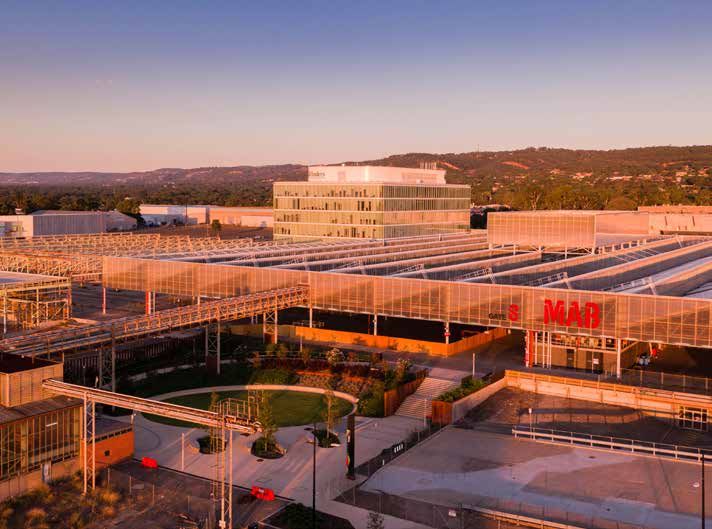
EXPERTS
IN PROPERTY DATA & INSIGHTS
Colliers Edge is a subscription service developed by our in-house
property research specialists, drawing on the expertise of our
national network of operators.

  DEEPER INSIGHTS               LIMITLESS SUPPORT         FAIRER PRICING
   Largest data set             Analyst not operators   Tailored to your needs
   on market today

Want better insights, faster? Talk to a Colliers Edge expert today
         Anneke Thompson
         National Director | Research
         +61 412 581 647
         anneke.thompson@colliers.com
         colliers.com.au/colliersedge

                                                              Accelerating success.
CONTENTS
Metro Office snapshot                                                              4

National overview                                                                  5

Sydney                                                                             6

Melbourne                                                                         10

Brisbane                                                                          14

Adelaide                                                                          16

Perth                                                                             18

Newcastle                                                                         20

Gold Coast                                                                        21

Our experience – Metro office                                                     22

                    Metro Office | Research & Forecast Report | First Half 2018    3
METRO OFFICE
SNAPSHOT
                                    NET FACE                       NET EFFECTIVE
                  VACANCY RATE                    INCENTIVES                                   NET SUPPLY                YIELD
                                      RENT                             RENT

                                                                                                                            2 month
                                                                                      Previous 12     Next 12               historic
                 Current   Mar-19    Current    Current   Mar-19   y-o-y % change                                Current
                                                                                        months        months                change
                                                                                                                             (bps)

NSW

North Sydney     7.9%       n/a      $785       20%       21%         18.2%             1,486         40,281     5.38%           -67

St Leonards      11.1%      n/a      $615        19%       n/a        22.3%             (7,811)        11,281    6.38%           -52

Chatswood        6.8%       n/a      $575       20%        n/a        22.7%                -           (815)     6.25%           -60

Macquarie Park   6.0%       n/a      $388       23%        n/a        14.2%            (16,968)       (9,345)    5.75%           -41

Norwest           n/a       n/a      $318        19%       n/a         19.5%             n/a            n/a      7.00%           -36

Parramatta       3.0%       n/a      $485        15%      14%          7.1%            (16,830)       22,840     5.63%           -76

SOP               n/a       n/a      $418       23%        n/a         7.6%              n/a            n/a      6.00%           -65

Rhodes            n/a       n/a      $430       24%        n/a         11.1%             n/a            n/a      6.00%           -32

South Sydney      n/a       n/a      $435        15%       n/a        14.9%              n/a            n/a      6.13%           -45

CBD Fringe        n/a       n/a      $675        13%       n/a         13.4%             n/a            n/a      5.50%           -33

VIC

St Kilda Rd      7.3%      5.4%      $400        21%      20%         22.5%            (38,634)       (8,400)    5.75%           -88

Southbank        5.1%       9.7%     $495       23%       35%          5.7%             25,124        12,200     5.38%           -50

City Fringe      3.3%      4.4%      $460        7%       14%          19.7%           (12,794)       33,900     5.50%           -50

Inner East       5.1%      5.2%      $395        10%      15%          6.7%             (1,636)        8,000     5.75%           -25

Outer East       7.4%      6.6%      $315       20%       25%          8.8%             37,500        11,000     6.63%           -50

South East       11.9%     12.0%     $295        15%      20%          7.4%             9,805         10,534     7.75%           -25

North & West     3.9%       3.1%     $300       20%       30%         14.3%             11,104         1,000     7.00%       -150

QLD

Inner South      10.3%      9.4%     $458       33%       33%         -0.51%            (9,461)        1,000     6.88%           -15

Urban Renewal    14.1%     12.5%     $453       35%       34%         -5.00%           (15,995)       33,920     5.88%           -117

Milton           17.1%     29.5%     $403       36%       36%         -5.10%            (764)          1,000     7.75%           -25

Spring Hill      17.6%     17.2%     $410       36%       30%         -1.06%               -           1,000     7.50%           -38

Toowong          11.9%     16.6%     $388       35%       27%         0.00%             (1,756)        1,000     7.50%           -50

Gold Coast       10.6%               $380        12%      10%         2.54%             (6,150)        5,576     7.13%           -73

SA

Fringe           11.4%     10.60%    $283       20%       20%        -14.20%            2,262          1440      6.38%           -25

Inner Metro      5.5%       NA       $298       20%       20%         -0.90%               -            0        6.75%            0

WA

West Perth       16.7%      15.9%        $370     38%      38%                 0.1%       2,509          1,595   7.20%       -0.22
NATIONAL
OVERVIEW
By Anneke Thompson
National Director | Research
anneke.thompson@colliers.com

Capital values continue their growth
trajectory                                                                 Major Metro markets, annual growth in capital values

Investment returns in metro office markets are at their greatest           40%

levels in over 10 years. Annual effective rental growth in Metro           30%

markets such as North Sydney, St Leonards, Chatswood, St Kilda             20%

Road and the Melbourne City Fringe has been strong, with all of            10%

these markets recording greater than 15 per cent effective rental           0%

growth over the year to March 2018. Coupled with an average of             -10%

50 basis points of yield compression over the same time period,            -20%

                                                                                                Mar-09
                                                                                     Mar-08

                                                                                                           Mar-10

                                                                                                                                   Mar-12

                                                                                                                                                               Mar-14

                                                                                                                                                                               Mar-15

                                                                                                                                                                                        Mar-16

                                                                                                                                                                                                                    Mar-18
                                                                                                                                                Mar-13

                                                                                                                                                                                                      Mar-17
                                                                                                                       Mar-11
capital value growth has been an extraordinary 25 per cent on                                   North Sydney                    Parramatta                          Melb Fringe                     St Kilda Road

average across the above mentioned markets.
                                                                           Source: Colliers Edge
While the yield compression cycle is moderating in some markets,
land rich opportunities in metro markets are highly sought after,          Stock change (March 2013-2018) versus current vacancy
as buyers want the ability to expand their investments - something
                                                                           Melbourne Fringe
more difficult to achieve in a CBD market. The long term growth
                                                                            Melbourne CBD
of the markets will also be impacted by a number of other factors,
including:                                                                    Sydney CBD

                                                                                  Parramatta
•   Tight occupancy: some metro markets, such as Parramatta
                                                                             North Sydney
    and the Melbourne City Fringe, are even more tightly occupied
                                                                             St Kilda Road
    than the Sydney and Melbourne CBDs, and we expect them
                                                                                               -15.0%               -10.0%                  -5.0%                       0.0%                 5.0%                   10.0%
    to stay this way until new supply starts completing around                                                       Current vacancy rate                stock change as a % of total stock*

    2019/20 .
                                                                           Source: Colliers Edge
•   Withdrawals: Withdrawal of stock continues to have an
    impact on metro markets. The Sydney metro market has
    reduced by 40,000sqm over the past 12 months and                   •          Affordability: As rents in the premium end of the Sydney
    Brisbane has contracted by 34,000sqm. In Melbourne, the                       CBD market breach the $1,000 per sqm mark, savvy
    metro market grew by 30,500sqm, however, the key markets                      occupiers are now looking to alternative markets such as
    of St Kilda Road and City Fringe have both contracted -                       North Sydney. Access to the CBD will substantially improve
    St Kilda Road by a close to 40,000sqm.                                        with the completion of the Sydney Metro Rail development,
•   Residential upside: a number of metro markets are also                        while North Sydney offers much more affordable rents.
    popular with residential developers, and many investors are        In this climate, buyers from Singapore invested just over $400
    attracted to the potential residential conversion exit strategy    million in metro office investment product over 2017, attracted
    that these investments provide.                                    by the genuine upside on offer in metro office product in key
•   Metro rail developments: both Sydney and Melbourne                 locations. While chinese buyers invested a similar dollar volume,
    are in the midst of significant infrastructure upgrades.           these buyers are generally more attracted to development upside
    The respective metro rail developments in each city offer          opportunities.
    significant demand uplift potential upon completion. The
    markets that will be particularly impacted are Sydney North
    Shore markets and St Kilda Road in Melbourne.

                                                                 Metro Office | Research & Forecast Report | First Half 2018                                                                                                 5
Research &
Forecast Report

SYDNEY
Metro Office | First Half 2018

By Kristina Mastrullo                                                      While the yield arbitrage between Sydney Metro and Sydney CBD
Associate Director | Research                                              still exists, it is narrowing as the value add opportunities continue to
kristina.mastrullo@colliers.com                                            appeal to investors. Following this, the average yield spread over the
                                                                           risk-free rate of 376bps and 473bps for A and B grade respectively,
                                                                           suggests further compression is likely.
    MARKET HIGHLIGHTS

    Sydney’s metro markets remain appealing for investors
    suggesting further yield compression ahead
                                                                           Leasing Market
                                                                           North Shore
    Limited A grade availability in North Sydney and strengthening
    tenant demand                                                          North Sydney
                                                                           Rental growth continues
    Parramatta now experiencing a lack of B grade space with               A grade rents increased by 6.1 per cent over the 6 months to March
    A grade remaining fully occupied                                       2018 while net effective rents increased 8.0 per cent. Incentives
                                                                           fell 1 percentage point to 20 per cent. B Grade net face and effective
                                                                           rents grew 4.8 per cent and 7.6 per cent over the 6 months, as
                                                                           incentives declined to 20 per cent for the period. Looking forward,

Investment market                                                          the market is anticipated to stabilise following the recent movements
                                                                           in both rents and incentives since 2016.

Market fundamentals continue to strengthen with the biggest                Improving amenity within North Sydney continues to appeal as the
influence of constrained supply placing upward pressure on                 overall market offering improves. As a result, competitive tension
net effective rents in Sydney’s Metro office markets. Suburban             is apparent as A grade availability becomes limited, taking into
peripheral markets are especially impacted by residential                  consideration pre-committed space. The amenity offering is further
encroachment, as tenant demand for core-Metro office markets (i.e.         strengthened with the introduction of co-working group WeWork,
North Sydney, Parramatta) grows.                                           who secured 2,800sqm at 50 Miller Street. Currently, there is up to
Infrastructure and amenity investment continues to contribute to an        10,000sqm of co-working requirement within the market and should
uplift in rent and competition for space, and it’s likely that this will   these requirements be accommodated, this should assist in elevating
continue throughout the construction process to completion.                North Sydney’s office market status.

Average A Grade yields for Sydney Metro have tightened by                  Vacancy lower than it seems
20bps over the past 6 months (an annual compression of 77bps)
to average 6.00 per cent in March 2018. The secondary market               North Sydney experienced negative net absorption (-10,883sqm)
experienced greater compression with a reduction in the average            for the six months to January 2018 as some tenants contracted.
yield of 32bps, settling on a yield of 6.51 per cent.                      As a result, vacancy increased from 6.4 per cent to 7.9 cent for the
                                                                           January 2018 period, according to the Property Council of Australia
Taking into consideration well-established metro markets such as           (PCA).
North Sydney and Parramatta along with contracting suburban
office market, positive rental outlook will continue to assist in          Colliers International expects total market vacancy to fall next period,
improving capital values and yields.                                       as the current vacancy is impacted by pre-committed space not

6
being currently physically occupied. Vacancy is then expected to Sydney Metro Yields
rise as the market approaches its supply cycle in 2020 as several 6.50%
6.38% 6.38% 6.38%
new and refurbished supply opportunities enter the market.
6.25 % 6.25 %
6.13% 6.13%
6.00% 6.00%
6.00%
5 .75 % 5 .75 %
With the Sydney Metro, the Victoria Cross Integrated Station 5.50%
5 .63%
5 .5 0%
5 .63%
5 .38% 5 .38%
Development and increasing investment in retail and public
amenity, requirements for North Sydney office space is likely to 5.00%
strengthen moving forward, encouraging organisations to consider 4.50%
North Sydney as a first option for accommodation.
4.00%
North Sydney CBD Fringe Parramatta Sydney Olympic Park South Sydney Macquarie Park St Leonards Chatswood
Sep-17 Mar-18
Chatswood Source: Colliers Edge
Chatswood vacancy fell marginally to 6.8 per cent, driven by
demand in the B grade segment with absorption well above North Shore Metro Markets Net Absorption vs
historical averages at 1,615sqm for the six months to January Vacancy January 2018
2018. 15,000
10.4%
12%
10,000 10%
The Department of Health has taken an additional 3,000sqm in the 7.9% 13,318
5,000 8%
Zenith (the largest lease deal in Chatswood) and various tenants 6.8%
sqm
have taken additional space from 475 Victoria Avenue adopting
0 6%
281
-846 6.0%
a ‘split-and-fit’ strategy. There are currently limited whole floor -5,000 -10,883
4%
offerings, and along with limited development activity, Colliers -10,000 2%
expect to see the vacancy rate decline further over the short term. -15,000 0%
North Sydney St Leonards Chatswood Macquarie Park
Due to the tightening market, A grade net face rents have increase Net Absorption (LHS) Total Market Vacancy
nearly 12 per cent for the six months to March 2018. Average Source: Colliers Edge
incentives declined three percentage points over the same period
increasing net effective rental growth by 17.2 per cent. Parramatta Vacancy
25%
By comparison, B grade net face rents haven’t grown as quickly,
increasing 2.2 per cent over the last 6 months with net effective 20%
rent increasing 4.3 per cent as a result of average incentives 15%
falling one percentage point to 19 per cent. 10.2%
10%
St Leonards 5% 2.7%
3.0%
0% 0.0%
In the last six months, St Leonard’s vacancy has decreased from
Jan-06
Jan-08
Jan-05
Jan-09
Jan-07
Jul-05
Jul-06
Jul-08
Jul-09
Jul-07
Jan-10
Jan-12
Jan-14
Jan-15
Jan-16
Jan-18
Jan-13
Jan-17
Jan-11
Jul-10
Jul-12
Jul-14
Jul-15
Jul-16
Jul-13
Jul-17
Jul-11
12.6 per cent to 11.1 per cent. The market continues to experience
A Grade B Grade C Grade Total Market
office erosion as stock continues to be earmarked for residential
Source: Colliers Edge
conversion.
Many secondary grade buildings within St Leonards come with a
demolition clause, prohibiting long-term leases, placing upward New supply entering the market, such as Lot 4, Royal North Shore
pressure on B grade rents. B grade buildings have experienced Hospital development (36,000sqm) is projected for completion
the largest growth in net face rent for the 6-month period of 18.8 in 2020. This project is fully pre-committed to the Department
per cent, with net effective rents increasing 22.8 per cent as of Health Infrastructure, relocating from 73 Miller Street in North
average incentives fell to 19 per cent. Sydney. Additionally, refurbishment of 72 Christie street will
bring over 11,000 sqm to market, and this space is expected to
A grade net face rents were subdued relative to B grade, generate a high level of interest.
increasing by 6.0 per cent for the 6 months to March 2018.
However, net effective rents grew 16.9 per cent due to incentives Macquarie Park
declining from 25 per cent to 19 per cent. Demand in St Leonards
Macquarie Park continues to record strong positive net absorption
for prime space is apparent, and with it the expectation that
(13,594sqm) over the six months to January 2018 according to
vacancy will continue to decline across the entire market moving
the PCA. Demand was concentrated in the A grade segment while
forward.
Metro Office | Research & Forecast Report | First Half 2018 7
9-11 Waterloo Road and 82 Waterloo Road were withdrawn for               by 4.3 per cent over the 6 months to March 2018. This grade is
hotel and residential conversion, respectively. Vacancy declined         largely represented by private investors, which is why average
2.4 percentage points to 6.0 per cent over the 6-monthly period.         incentives remained at 12 per cent, the lowest average incentive
                                                                         since March 2004.
However, tenant enquiry from peripheral suburbs remain strong
as Macquarie Park offers a relatively superior location with
space suitable for larger occupiers as tenants continue to be            B grade tightening
displaced due to residential conversions. A flight to quality is being   Over the 6 months to January 2018, B grade vacancy has reduced
experienced as Macquarie Park offers value for money which have          a significant 3.6 percentage points, from 6.3 per cent to 2.7 per
been appealing to tenants in the catchment area coupled with a           cent. Strong positive net absorption was also recorded in this
competitive price point, compared to Chatswood, St Leonards,             sector at 8,477sqm, nearly double the 10-year historical average.
North Sydney and the CBD.                                                We expect B grade rents to continue their upward trajectory,
Tenants in outer suburbs such as Belrose and Norwest have                which should in turn further increase A grade rents. Relatively
shown interest in relocating into Macquarie Park because of              sizeable B grade space will become available when Property NSW
its public amenity, including Macquarie Shopping Centre, new             vacates 5,700sqm in 93 George Street, moving to Parramatta
transport options (Sydney Metro project) along with building             Square. This will be a positive for the market, providing large
upgrades bringing end-of-trip facilities. Vacancy is likely to remain    users the opportunity to expand or relocate within the precinct.
low within Macquarie Park, placing upward pressure on rents              The Light Rail continues to transform the dynamics of Parramatta
moving forward.                                                          in both the office and retail sectors. Despite the disruption during
The presence of the education sector within Macquarie Park is a          construction, the project could prove beneficial in introducing
differential that no other market can claim. Macquarie University’s      some high-profile retail tenants, a further attractor for higher
incubator has proven so successful in their attraction of tech           calibre office occupiers.
start-ups, that there are believed to be talks of creating another.
                                                                         Sydney Olympic Park
A grade net face rents have increased by 7.6 per cent in the 6
months to March 2018, with net effective rents growing 12.7 per          Net face rents continue to rise as office enquiry remains strong,
cent as incentives declined by 3 percentage points to 23 per cent.       with a variety of tenant types showing interest in the market.
                                                                         Average A grade net face rents for Sydney Olympic Park (SOP)
                                                                         have increased 3.7 per cent over the six months to March 2018.
Western Sydney                                                           However, incentives have increased three percentage points to
                                                                         23 per cent as secondary stock competes with the introduction of
Parramatta                                                               new supply.
Starved of quality space                                                 Increasing tenant enquiry continues to stem from this office
A notable 15,000sqm of space is likely to become vacant in 2020          market’s location, being at the geographic centre of Sydney, with
and 2021 when Parramatta City Council (126 Church Street), the           good access and amenity. As A grade vacancy in Parramatta
Office of State Revenue (132 Marsden and 87 Marsden Streets),            remains at zero coupled with its relatively higher price point for
and the Department of Planning and Environment (10 Valentine)            secondary grade stock, SOP offers larger, quality space as an
intend to vacate. Prior to that, the Department of Education and         alternative. A flight to quality is emerging as tenants seek a higher
Property NSW have fully committed to new developments 105                level of amenity and infrastructure from surrounding suburban
Phillip Street and Stage 4 Parramatta Square, respectively, which        markets that are lacking in these features.
will cement Parramatta’s record-low vacancy rate of 3.0 per cent.        In terms of upcoming new supply, 4 Murray Rose Drive is due for
Migration both ways have occurred, in and out of Parramatta.             completion this year. Additionally, the availability of CBA’s backfill
Public transport options, further amenity investment and the direct      space, inclusive of high quality fitouts, are expected to draw strong
connection to the CBD means the precinct remains a popular               interest.
accommodation option, especially within the Western Sydney               With the impending release of the Sydney Olympic Park Authority
Region.                                                                  Masterplan, a material change of use tilted towards the residential
Despite there still being no A grade vacancy for the fourth              sector could also cause several buildings to be withdrawn from
consecutive period as reported by the PCA, strong rental growth          the market. In the meantime, these buildings are likely to offer
would still be expected should any space become available. As a          short term leases and potentially act as a release-valve for the
result, B grade rents have benefited with net face rent increasing       pent-up demand in Parramatta.

8
City Fringe                                                            South Sydney
Urgency remains among creative/tech companies to secure
                                                                       The South Sydney office market is in the midst of an investment
unique, quality space as limited supply within the City Fringe
                                                                       boom. Infrastructure projects having a local impact, such as
market continues. Very little A grade stock remains and Pyrmont
                                                                       Sydney Metro and West Connex, are great for landowners
and Surry Hills has become the most sought after suburbs.
                                                                       considering repurposing existing industrial assets to cater to hotel,
Adding to demand is interest from co-working / serviced office         retail or office users. Developers that had previously acquired
groups. These groups are seeking A grade quality as either             land for residential strata sales are either minimising holding
majority or whole-building occupiers i.e. over 3,000sqm. All           costs, flipping their sites or evaluating commercial development
such requirements combined represent more than 10,000sqm of            opportunities.
demand, although with space at a premium not all of this demand
                                                                       Net effective rents for A grade assets within South Sydney grew
will convert to deals.
                                                                       2.1 per cent primarily due to the decline in average incentives by 2
In the 6 months to March 2018, there was no movement in A              percentage points to 15 per cent. B grade face and effective rents
grade net face rental growth relative to the previous period           increased marginally (0.7 per cent and 0.8 per cent respectively)
(3.8 per cent), however we should see an elevation next period         as incentives remained at 16 per cent. Despite this plateau, A and
reflecting deals currently being negotiated. B grade net face rental   B grade annual net face rental growth remains strong at 10.1 per
growth was strong (4.9 per cent) as there remains limited options      cent and 6.2 per cent respectively. As a result of repurposing
within the A grade segment. However, compared to its 6-monthly         and withdrawals of office stock, availability of quality stock will
growth last period (11.9 per cent), the lack of trickle-down from A    continue to reduce, placing downward pressure on incentives and
grade demand is apparent. Moving forward, we predict positive          keeping net effective rental growth elevated.
A grade rental growth to continue with an increasingly supply-
constrained market.

77 Christie Street, St Leonards
Leased on behalf of Proprium Capital Partners

                                                                 Metro Office | Research & Forecast Report | First Half 2018              9
Research &
Forecast Report

MELBOURNE
Metro Office | First Half 2018

By Anneke Thompson                                                     this trend – the number of deals Colliers has transacted in the
National Director | Research                                           City Fringe had almost doubled from 34 in 2015 to 63 in 2017,
anneke.thompson@colliers.com                                           while in St Kilda Road over the same time period, deal activity has
                                                                       more than halved, from 77 to 32 deals. There is also a distinct
                                                                       preference amongst corporates that have a younger workforce
  MARKET HIGHLIGHTS
                                                                       to be located near public transport and good amenity – the City
  Unprecedented supply and demand conditions, particularly             Fringe is the best placed market to cater for these requirements.
  in the City Fringe                                                   A number of major tenant moves are coming up imminently –
                                                                       including Country Road to Botannica from Church Street, David
  All precincts have recorded good effective rental growth             Jones from Sydney to Botannica, Fonterra to River Boulevard
                                                                       (from the Outer East). The large Just Group and Country Road
                                                                       backfill opportunities (circa 12,00sqm) should be refurbished by
  Large City Fringe supply pipeline will continue to lift net
                                                                       Q4 2018, and we expect that given tenant enquiry on the space
  face rents in the precinct
                                                                       already, these spaces will be fully committed before coming back
                                                                       into the market.

City fringe                                                            Given the positive leasing conditions and tight vacancy, it is no
                                                                       surprise that the development industry is responding, and a
Record effective rent growth continues                                 number of major office projects are in the pipeline for the City
                                                                       Fringe. The supply outlook is going to have a profound impact,
Effective rental growth in the City Fringe A grade market has          and we expect the market to grow from being a 950,000sqm
again been well in to the double digits, with growth of 19.7 per       market, to circa 1.136 million sqm by March 2021. This is almost
cent recorded over the year to March 2018. This follows growth         185,000sqm of new supply, or an increase of 20 per cent on
of 22.7 per cent recorded in the year to March 2017. The vacancy       current stock levels. While this is a significant increase, our view
rate is having a profound effect on rents that tenants are willing     is that the underlying fundamentals of demand are sustainable and
to pay to secure space. The vacancy rate has been sub 5 per cent       the market is delivering product that is sorely needed. While it is
for two years now, and below 3.5 per cent for 18 months. These         worth considering that the Melbourne CBD will be undergoing a
are extremely tight conditions, given that the long term vacancy       significant increase in supply at the same time as the City Fringe,
rate in the City Fringe is 6.1 per cent. Landlords are now routinely   the pre-commitment levels in the CBD are circa 62 per cent (and
achieving over $500 per sqm for A grade face rents in the              rising), and tight supply in that market means backfill opportunities
Richmond/Cremorne precinct, while the overall market average is        are also being closely looked at. This means that much of the
now $460 per sqm – up from $400 per sqm only a year ago.               development pipeline hitting the market in both the CBD and City
The cause of the tight vacancy is two-fold. A shrinking market         Fringe in 2020 will not contribute to vacancy numbers, but result
– almost 25,000sqm of net withdrawals have been recorded               in positive net absorption.
over the past two years, some of these for refurbishment – and         We expect face rent growth to continue in the A grade market, in
strong demand conditions. Demand has been driven by a number           spite of the new supply. Demand conditions will remain strong,
of factors including record population growth, good employment         given Melbourne’s extraordinary population growth, and as new
growth and tenants being pushed out of other Melbourne markets         A grade stock is added to the market, the average rental in the
such as St Kilda Road, Box Hill and the Inner East, where there is     precinct will continue to climb. Incentives are likely to increase
limited new supply. An analysis of historic deal activity highlights   from 2019 through to the peak of the cycle in 2020, as developers

10
will need to compete for tenant pre-commitments, and tenants Melbourne Metro Office Vacancy Rates
expect a significant contribution to fitout costs. Southbank
St Kilda Road
Inner East North&West
South East
Absorption levels to improve again - vacancy Outer East
to reduce to circa 4 per cent by late 2018 Inner East
City Fringe
The Inner East was the only market in the Metro precinct where
0% 2% 4% 6% 8% 10% 12% 14%
vacancy increased, although this increase was ever so slight – March 2019 (f) Mar-18
from 4.95 per cent in September 2017 to 5.08 per cent in March
Source: Colliers Edge
2018. Vacancy is still lower than a year ago, when the rate was
6.30 per cent. The increase to the vacancy rate was predominately Melbourne Metro A Grade Net Effective Rental Growth
caused by Acquire Learning vacating 5,400sqm at 600 Glenferrie year to March
Road in Hawthorn. While technically vacant, this space has been Southbank 0.9 % 5 .4%
fully committed by United Petroleum, who will vacate owner St Kilda Road 5 .7% 22.5 %
occupied premises in Hoddle Street, Abbotsford later in the year. Metro Average 11.3% 10.5 %
We are therefore forecasting circa 6,000sqm of net absorption over North&West -0.1% 14.3%
the next six months, and the vacancy rate to fall back to 4 per cent.
South East 10.7% 7.4%
Rents continue to climb in the precinct, albeit at a slower rate than Outer East 1.8% 8.8%
the City Fringe. The lack of many new supply opportunities in the Inner East 9 .1% 6.7%
market now that Vicinity’s Tower at Chadstone is full, means that City Fringe 22.9 % 19 .7%
opportunities for rental reversion are somewhat more scarce. -5% 0% 5% 10% 15% 20% 25% 30% 35% 40% 45%
Face Rents grew by 3.9 per cent over the year to March, while a
2017 2018
reasonable decline in incentives saw effective rents grow by 6.7 Source: Colliers Edge
per cent.
Melbourne Metro Yields
Despite the continued low supply trend in this market, enquiry
11%
is still strong, particularly from those tenants being displaced by
10%
the continued residential development in the Box Hill precinct. A
9%
number of tenants, including Scope Victoria and Kao Brands, have
8%
relocated from this market to the Inner East, at a higher rent.
7%
Outer East
6%
5%
A Grade market performing very well, small
4%
Sep-09
Mar-09
Sep-10
Mar-10
Sep-12
Sep-14
Sep-15
Sep-16
Mar-12
Sep-13
Mar-14
Mar-15
Mar-16
Mar-18
Mar-13
Sep-17
Mar-17
Sep-11
Mar-11
suites strategy gaining traction City Fringe Inner East Outer East South East North & West St Kilda Road Southbank
The A grade market in the Outer East continues to be one of the Source: Colliers Edge
better performing markets, despite the higher vacancy conditions
that the market has been experiencing. This is certainly changing,
as vacancy has dropped from 9 per cent in September 2017, to The Outer East has traditionally supplied the occupier market
7.4 per cent in March 2018. The long term vacancy rate for this with plentiful new A grade stock, however, while the vacancy
market is much higher than other markets, at 9.6 per cent, so this rate remained high, new supply has somewhat dried up. Only
is a tight vacancy rate for the Outer East. Net absorption continues 6,000sqm – at Victor Crescent, Narre Warren – was added over
to outperform all other precincts in the metro market, and almost the past six months. This is about half the long term supply rate
65,000sqm of space has been absorbed in the past year. in the Outer East. Over the next six months, 10 Nexus Court
(8,000sqm) will complete, and the developer has been successful
While face rents across the market as a whole have only seen
in leasing up a very large portion of this space, at rents higher
moderate increases over the past year, incentives have reduced
than the A grade average for the Outer East.
from an average of 27 per cent a year ago, to 23 per cent. This has
resulted in good annual effective rental growth of 8.8 per cent over An interesting trend in the Outer East is the success of the
the year to March 2018. smaller, speculative fitout model in the precinct. This strategy that
Metro Office | Research & Forecast Report | First Half 2018 11has proven successful in the CBD over the past few years has been
applied to great success at Axxess Corporate Park, where smaller
Capital markets
tenants such as Funtastic and TTI have committed to this space. Investors circling new development
opportunities in the City Fringe
South East Both A and B grade yields continued through their compression
cycle in the year to March 2018. A grade yields tightened by 48
‘Commuter’ market leading demand basis points in the year to March 2018 to 6.59 per cent, while
While vacancy in the South East remains stubbornly high – 11.9 B grade yields compressed by 55 basis points to 7.28 per cent.
per cent at March 2018 – we are seeing positive absorption, and Once again, the City Fringe sits well below the metro average, and
emerging demand sectors that should continue to absorb space. average A grade yields in that market are more comparable to the
CBD, at 5.50 per cent.
The growing popularity of the Mornington Peninsula as a home
for Melbourne based workers, means that the South East market, The soon to be built, pre-committed development stock in the City
particularly around Bentleigh and Moorabbin, is now a genuine Fringe is catching the eye of institutional investors, with a number
option for tenants whose management and/or workforce are of investors considering capital partnering or fund through
increasingly relocating to the Peninsula. A good example is the arrangements for some of these assets. As most of the stock
relocation of ZircoData from Hawthorn East to 705sqm at 973 is being built by developers who specialise in metro Melbourne
Nepean Highway, Bentleigh. markets, investors are looking to partner with the groups to
reduce risk while accessing local expertise and better returns than
In Moorabbin, a number of deals have been recorded at Parkview they could get in the CBD.
Estate, where Home Timber and Hardware took 4,000sqm and
Primary Health Network backfilled the 2,000sqm vacated by Home Almost $370 million of stock has transacted in the 6 months to
Timber and Hardware. Coupled with multiple deals to tenants March 2018, including 353-383 Burwood Highway, Forest Hill for
associated with the National Disability and Insurance Scheme $88 million to a locally based Chinese syndicate. In Bundoora, 30
(NDIS), net absorption was a very strong 14,000 sqm over the Janefield Drive sold for $26.93 million in January of this year, on
past year. This is even more exceptional considering the previous a sharp 5.8 per cent initial yield. More recently, Computershare’s
three years produced 500sqm of negative net absorption, and is headquarters at 452 – 484 Johnston Street, Abbotsford, sold
indicative of the market turnaround. A grade effective rents, as a to Abacus Property Group for $93.5 million on a 6.05 per cent
result, have grown by 7.5 per cent over the past year. equivalent reversionary yield. Abacus were the underbidders of
the asset when it last transacted in May 2016.
54 Wellington Street, Collingwood
Leased on behalf of Grocon
12464 St Kilda Road, Melbourne
Currently being marketed by Colliers International on behalf of VACC
St Kilda Road & Southbank
6,388sqm from their recently sold headquarters in the precinct.
Creative Victoria (Vic Govt) have purchased this building, and will
likely owner occupy. WPP will also be moving out of Collins Street
Strong transaction market - to Freshwater Place, absorbing a further 3,500sqm of current
buyers seeing rental upside vacancy.
St Kilda Road is Melbourne’s fourth largest office market, behind Reflecting the positive demand activity in the A grade market, net
the CBD, Outer East and City Fringe office markets. The market effective rents on St Kilda Road increased by 22.5 per cent over
is still in the midst of an office withdrawal cycle, as room is the year and 11.7 per cent in the six months to March 2018. Net
made for high end residential product, of which there has been face rents for prime grade space grew by almost 20 per cent
strong demand over the past five years. Over the past 10 years, over the year to March 2018, after being stagnant for the previous
the St Kilda Road market has reduced by almost 100,000sqm. In year. Looking forward, we are forecasting effective rent growth of
comparison, the CBD office market has increased in size by almost almost 10 per cent over the year to March 2019.
800,000sqm over the same period, and Southbank has grown by
St Kilda Road experienced a flurry of investment sales activity
almost 60,000sqm, despite large amounts of secondary space
over 2017, with seven transactions occurring, for a total sales
there being withdrawn for residential development.
volume of $498 million. Investors now seem to be attracted to
St Kilda Road has historically been an affordable relocation the rental reversion that the precinct offers them, given the tight
solution for many large multi-national businesses from the CBD. supply conditions and continued demand from a core group of
More recently, existing tenants remaining in the area are renewing tenants. There is also the potential exit strategy of a residential
their leases, as large options in the strip are limited. conversion that is attractive to offshore investors in particular.
Vacancy in the St Kilda Road precinct has reduced to 7.25 per The buyer profile was almost exclusively offshore - 97 per cent
cent as at January 2018, from 11.27 per cent in July 2017. Despite in fact. Tong Eng (Singapore) purchased 312 St Kilda Road for
continuing strong withdrawals contributing to negative net supply $74.14 million on a 5.62 per cent equivalent reversionary yield.
of 21,979sqm over the six months to January 2018, net absorption In December 2017, Ginkgo Investments, a private Chinese group,
was a positive 6,464sqm. All of the withdrawal activity occurred purchased 606 St Kilda Road for $57.04 million on an equivalent
in the secondary grade space, while A grade saw no withdrawals reversionary yield of 5.88 per cent. The sole sale to a domestic
and positive net absorption of 6,950sqm. This reflects continuing purchaser was 1 Bowen Crescent ($14 million) to a Sydney family
strong enquiry levels for A grade space in the precinct. in September 2017.
In Southbank, vacancy increased from 3.3 per cent to 5.1 per Given the strong deal activity and plethora of transactional
cent, however, this vacancy rate is still well below the long term evidence, yield compression has been a significant 50 bps over
average of 6.6 per cent. We expect vacancy in Southbank to the past six months, and 88 bps over the past year. Average A
reduce significantly by early 2019, as major leases in vacant space grade yields now range between 5.5 and 6.0 per cent.
at Freshwater Place commence. These include CUB moving into
Metro Office | Research & Forecast Report | First Half 2018 13Research &
Forecast Report
BRISBANE
Metro Office | First Half 2018
By Helen Swanson • 84 Longland Street, Newstead (Gasworks office portion)
Manager | Research – the office portion of 84 Longland Street, Newstead sold to
helen.swanson@colliers.com AMP Capital for $125.9 million equating to $14,007 per sqm
at an initial yield of 5.10 per cent.
MARKET HIGHLIGHTS • 433 Boundary Street, Spring Hill – the three-storey
commercial office building sold to Cromwell Property Group
Record level of sales over 2017 for $42 million, equating to $7,004 per sqm at a reversionary
yield of 6.51 per cent.
Compression of Prime grade yields 25-35 bps this year • 56 Edmondstone Road, Bowen Hills - listed property
trust Charter Hall Long WALE REIT has taken over Virgin
Australia’s headquarters in Brisbane in a $90.8 million deal
Vacancy declined from 14.6 per cent in July to 14.1 per cent
with its parent platform, Charter Hall.
as at January 2018
• 9 Hercules Street, Hamilton – a two level fully leased
commercial office building refurbished in 2010. The property
Investment market
was purchased by unlisted fund manager Clarence Property
Group for just under $12 million equating to a capital value
of $5,510 per sqm reflecting a reversionary yield of 7.82 per
Over the 2017 calendar year, $1.5 billion of metro office
cent. The property sold with a WALE of 3.5 years
transactions (Leasing market Brisbane Metro Office sales ($m)
1,600,000,000
Inner South tightest metro market
1,400,000,000
1,200,000,000
According to the PCA office market report, Brisbane’s metro office 1,000,000,000
vacancy rate declined from 14.6 per cent in July 2018 to 14.1 800,000,000
per cent in January 2018. Net absorption for the six months to 600,000,000
January 2018 was -7,830 sqm. Despite this vacancy still declined. 400,000,000
This can be explained by the 16,212 sqm of withdrawals and no
200,000,000
new supply additions recorded over the period.
0
2007 2008 2009 2010 2011 2012 2013 2014 2015 2016 2017
Domestic Offshore
Driven by positive net absorption for the six months to January Source: Colliers Edge, 2018
2018, Milton’s vacancy rate declined from 18.6 per cent to 17.1 per
cent. Despite the decline, Milton continued to report the second Brisbane Metro Office vacancy by precinct
highest vacancy of all metropolitan precincts. The tightest market 25%
as at January 2018 was the inner south which recorded 10.3 per 20%
cent vacancy, down from 11.1 per cent in July 2017. Contributing 15%
to the decline was the withdrawal of 25 Donkin Street, West End.
10%
Vacancy in other precincts saw the Urban Renewal remain steady
at 14.1 percent (despite 312 Brunswick Street being withdrawn for 5%
retail conversion), Toowong’s vacancy rose only 0.1 percentage 0%
2007 H1
2007 H2
2015 H1
2015 H2
2011 H1
2011 H2
2016 H1
2016 H2
2014 H1
2014 H2
2012 H1
2012 H2
2003 H1
2003 H2
2009 H1
2009 H2
2005 H1
2005 H2
2001 H1
2001 H2
2008 H1
2008 H2
2010 H1
2010 H2
2017 H1
2017 H2
2006 H1
2006 H2
2004 H1
2004 H2
2002 H1
2002 H2
2013 H1
2013 H2
points to 11.9 per cent and in Spring Hill the vacancy rate declined
from 18.4 per cent in July 2017 to sit at 17.6 per cent at January Inner South Urban Renewal Milton Spring Hill Toowong
2018 (albeit recording the highest vacancy of all precincts for the
Source: PCA OMR Jan-18/Colliers International
period).
Brisbane Metro Office future supply pipeline
New supply for 2018 50,000m²
45,000m²
2018 2019 Mooted and or 2020+
40,000m²
After a period of no new supply and only refurbished stock 35,000m²
30,000m²
entering the market in 2017, two new projects - 900 Ann Street 25,000m²
(18,791 sqm) and 25 King Street (14,429 sqm) both in Fortitude 20,000m²
15,000m²
Valley - are anticipated for release in 2018. 25 King Street is 10,000m²
5,000m²
43 per cent pre-committed by Aurecon, while 900 Ann Street 0m²
at 100 per cent pre-committed by Aurizon. The available space
at 900 Ann Street is Aurizon’s decision to sub lease 5 floors of
Remaining Area Sublease Backfill Mooted Pre-committed
their original pre-committed space. Whilst there are no other
buildings currently under construction, there is an extensive list of Source: Colliers Edge, 2018
commercial office projects that are currently proposed and have
received development approval. However, many of these projects • Ergon Energy (Energy Queensland) will be subleasing
are unlikely to proceed in the short to medium term without 5,000sqm in Nundah
substantial pre-commitment. One of the most recent projects to be • Aurizon subleasing 7,500sqm in 900 Ann Street
announced as receiving development approval is 801 Ann Street,
• 100 Brookes Street will have 7,000sqm left from this month
Fortitude Valley. Walker Corporation’s $400 million project will
• Origin backfill in John Oxley and CDOP will be available from
feature circa 44,000 sqm of office NLA with 2,000 sqm office
mid this year (approx. 30,000 sqm)
floor plates. The flurry of potential developments appeared to
emerge off the back of the Suncorp and Tech One briefs for office On a positive note Hatch have recently renewed for 6,000 sqm at
space. The Barracks.
Taking the above into consideration, our forecasts suggest
Backfill to come to market
vacancy could reach between 15 and 16 per cent by mid this year.
Despite vacancy falling from 14.6 per cent in July 2016 to 14.1 Consequently, we also forecast net effective rental growth for both
per cent in January 2018, challenges such as upcoming backfill A and B grade office product in the metro to remain stagnant for
lie ahead this year. The below includes some of the space that is much of 2018.
forecast to come to the market this year:
Metro Office | Research & Forecast Report | First Half 2018 15Research &
Forecast Report
ADELAIDE
Metro Office | First Half 2018
By Kate Gray Greenhill Road has seen more refurbishment of existing stock than
Director | Research conversion to apartments. This is because many of the buildings
kate.gray@colliers.com along Greenhill Road still have an underlying value and therefore
if sold are still too expensive to be viewed as a development
site. Although it is likely that there will be more residential
MARKET HIGHLIGHTS
developments which will result in withdrawal of office stock along
Greenhill Road, this is a medium to long term prospect.
Vacancy increases in Fringe
Rents for the fringe office markets have eased over the last half
Suburban vacancy falls with A grade stock with an easing at the top end of the rental
range. This has resulted in average rents for A grade space falling
by 9.4 per cent over the last 12 months with a range of $370 per
Sales activity in the suburban market increases
sqm to $400 per sqm. It is also worth noting that there are few
options for grade A space in the fringe market due to a lack of
new development in the precinct. B grade rents, however have
Leasing market
remained stable within the range of $300 per sqm to $350 per
sqm. There has not been no change in incentives across both A
and B grade space with a current range of 15 to 25 per cent. This
Vacancy in the Fringe office market increased from 10.1 per cent is much lower than on offer in the Adelaide CBD office market,
to 11.4 per cent in the January 2018. Over the same period, the where incentives range between 30 and 40 per cent.
CBD has started to see vacancy fall. A more detailed analysis
The Adelaide suburban market has seen vacancy fall over the last
of the Fringe market shows that there is higher vacancy is
six months to 5.5 per cent down from 5.9 per cent in September
along Greenhill Road when compared to Fullarton Road. There
2017. The eastern and southern office markets appear to continue
are several contributors to this. Several buildings have been
to perform will with vacancy of 4.7 per cent and 1.7 per cent
withdrawn, refurbished and then returned to the market with
respectively. There has been no significant supply delivered to
not all the space leased, and the extension of the clearway on
the suburban market over the past 12 months. In the pipeline is
Greenhill Road has impacted vacancy.
the development of 270 The Parade, Kensington for Peregrine
New supply in the fringe remains limited with most of the new (circa 9,800sqm) which is likely to complete in 2020. Rent for the
supply being refurbishment of existing buildings. Refurbishments inner suburban A grade space have remained stable and ranged
which have completed in the last two years include 123 Greenhill between $360 per sqm to $430 per sqm with incentives between
Road, 128 Greenhill Road, 161 Greenhill and 8 Greenhill Road. 15 and 25 per cent.
Currently undergoing refurbishment is 100 Greenhill Road which
Investment market
is expected to complete until mid 2018. While there is currently no
withdrawal of office space at 177 Greenhill Road, there are plans
for residential apartments, with the project currently in presale.
There is also a residential project in presale phase at 56 Greenhill Total investment volumes across both suburban and fringe
Road being developed by the Colangelo group. The rezoning of markets were $113.26 million during 2017. This is above the
Greenhill Road several years ago to allow for higher building 10-year average, but below the sales volume of 2016 which was
heights and more mixed-use development, has not resulted $130 million. Most of the activity has been in the suburban market,
in significant conversion of office space to mixed use to date. which has accounted for $97.5 million of the total sales volume in
162017. This volume was boosted by the sale of the Codan office at
2 Second Ave, Mawson Lakes which sold for $32.1 million in April Adelaide Metro Office Sales Volumes
2017. The other transaction of note in the metro market was 257
Fullarton Road, Parkside which sold for $13.5 million. $160
$140
The fringe has seen limited transactions during 2017 with only $120
M i llions
two sales over $2 million, with one of these a development site $100
$80
rather than an office building. The most recent sale in the fringe
$60
is 22 Greenhill Road which sold for $4.725 million in December $40
for a yield of 6.52 per cent. The other transaction of note in the $20
fringe is the sale of 176 Greenhill Road which was Tiffins on $0
2007 2008 2010 2011 2012 2013 2014 2015 2016 2017
the park which sold for $11 million and was purchased by the
adjoining owner ECH, who plan to redevelop this site to an aged
Source: Colliers International
care facility.
The Fringe and suburban markets tend to have stock which is of
expected to see a yield range of 6.0 per cent to 6.75 per cent.
a smaller scale than the CBD and therefore has more transactions
Inner metro markets for A grade space has a wider range from
in the $2 million to $5 million price range. This tends to attract
6.0 per cent to 7.5 per cent. We are expecting an increase in the
private investors and they are therefore an active purchaser in this
number of transactions during 2018, with more properties likely to
market. Yields in the suburban and metro markets have tightened
come to the market. We are seeing good enquiry for both owner
over the past 12 months with A grade space in the Fringe
occupier or investment stock with long leases in place.
1284 South Road, Tonsley
Leased on behalf of Renewal SA
Metro Office | Research & Forecast Report | First Half 2018 17Research &
Forecast Report
PERTH
Metro Office | First Half 2018
By Quyen Quach The changes in economic growth conditions in WA and the shift
Senior Research Analyst | Research in attitudes of business and employees in the constantly evolving
quyen.quach@colliers.com technological and business environment has contributed to the
continual increase in demand from small and micro tenants. The
freelancing and ‘gig economy’ is a continuing trend, not just globally
MARKET HIGHLIGHTS
but also in Perth. The cyclical nature of the resources sector has
seen companies embrace contract work arrangements to add
A minor increase in West Perth vacancy
flexibility and improve project cost controls.
Rents still under pressure With a revival in resource sector activity and the steady increase
in work available, some small/independent contractors are now
looking to expand their office footprint. Colliers International is
Landlords increasingly willing to refurbish buildings or spec
leasing agents are reporting an increase in enquiry from small
fit tenancies
contractors, currently occupying serviced offices, seeking to
establish a more permanent presence and/or expansion space.
Positive signs of pending recovery Though at present, they are tending to enquire about space in the
During 2017 private capital expenditure remained in a downward Perth CBD and more particularly ‘The Terrace’ for easy access to
trend and that continued to drag on the state’s economy; though it major resource companies and to capitalise on the ‘bump factor’.
looks to be reaching the end of the contraction phase. Stabilisation
Investors continued to circle the market seeking counter-cyclical
and then a recovery in private capital expenditure is expected by
opportunities. In 2017, total sales amounted to 15 assets for a total
Deloitte Access Economics over the next 12-18 months.
of $208.5 million. The yields achieved from major investment
Unemployment statistics were also encouraging in the second transactions ($10 million +) generally ranged from 6.9 per cent to
half of 2017, and further improvements are anticipated with more 7.7 per cent.
positive signs of a recovery from the mining sector.
White-collar employment and office space demand has stabilised
Suburban vacancy stabalising
but the flight to quality and centrality has continued to favour At the start of March 2018 Colliers International re-assessed
the Perth CBD office market, which has seen vacancy contract vacancy in the Herdsman/Osborne Park precinct and things look
over 2017. West Perth vacancy, on the other hand, has increased to have improved slightly, with vacancy falling to 16.9 per cent
marginally over the second half of 2017. West Perth vacancy was from 17.1 per cent in August 2017. This amounts to approximately
reported to be 16.7 per cent as at the end of December 2017. One 32,845sqm of vacancy in buildings with over 1,000sqm of NLA.
of the contributors to this increase in vacant space was the return Leasing deals are being executed, however suburban office demand
of refurbished space at 66 Kings Park Road. remains soft.
After absorbing 8,666sqm of space during H1 2017, West Perth Suburban tenants are continual targets to be enticed to migrate to
saw net absorption turn negative during the second half of 2017 Perth’s CBD and West Perth, while vacancy remains high landlords
– with a decrease in occupied space of 2,945sqm. The negative are chipping away at vacancy by accommodating the shift to
net absorption was attributed to the vacating of secondary grade smaller tenancy demand profiles. But increasingly, suburban (and
space mostly in B and C grade stock. Evidence of the continued more particularly West Perth) landlords are undertaking upgrades
flight to quality was the further take-up of A grade space, with and speculative fit-outs to compete for tenants. The most recent
674sqm of A grade space absorbed in H2 2017, elevating the total project being the refurbishment at 66 Kings Park Road that was
A grade absorption for 2017 to 6,200sqm. completed during the December 2017 quarter.
18Still some time before rental growth returns
West Perth Vacancy Rate
Recent developments on the economic front and CBD vacancy is
20%
looking promising, but for suburban precinct rents it’s likely to be 18% 16.7%
some time before rental growth revisits these markets. Vacancy is 16%
14%
still high (as noted earlier West Perth vacancy actually increased 12%
slightly over H2 2017), demand remains lacklustre, and strong 10%
8%
competition for tenants is persisting. 6%
4%
West Perth rents were generally stable over H2 2017, though A 2%
grade net face rents fell slightly over the December 2017 quarter 0%
Jan-11
Jan-12
Jan-13
Jan-14
Jan-15
Jan-16
Jan-17
Jan-18
Jul-11
Jul-17
Jul-12
Jul-13
Jul-14
Jul-15
Jul-16
to average $370 per sqm. This was 3.9 per cent lower than the
Direct - Vacancy Factor Sub-lease Vacancy Factor
December 2016 average of $385 per sqm. B grade rents were 8.4
Source: Property Council of Australia, Colliers International
per cent lower over the year, at an average of $300 per sqm.
During December 2017, A grade incentives averaged 37.5 per West Perth Average Net Face Rents
cent, while B grade incentives were 40 per cent. $700
$600
Vacancy and rents limited new supply Average Net Face Rents ($/m²)
$500
$400
Over the 2017 calendar year, 25,727sqm of new office space was
$300
delivered to the Perth suburban office market - for buildings over
$200
1,000sqm. The first of two main projects that accounted for 65.5
$100
per cent of the space delivered was 25 Rowe Avenue, Rivervale.
$0
This project was developed by BGC whom originally proceeded
Jun-11
Jun-10
Jun-12
Jun-13
Jun-14
Jun-15
Jun-16
Jun-17
Dec-11
Dec-10
Dec-12
Dec-13
Dec-14
Dec-15
Dec-16
Dec-17
on spec but managed to secure a pre-commitment from Bunnings
A Grade B Grade
for 43 per cent of the space during the construction. The other Source: Colliers Edge
project was 5 Milldale Way, Mirrabooka which consisted of
6,535sqm of space. This project is owned by the Department
of Housing and they are expected to relocate from their current
offices at 8 Sudbury Place, Mirrabooka.
Additional supply will be limited in the next two years as market
rents are estimated to be below economic rent levels. Major
suburban projects to have commenced over the past two years
have been anchored by state government pre-commitments as
part of the government’s office decentralisation mandate.
One of the drivers of this decentralisation was high CBD and CBD
fringe occupancy costs during the boom years. More recently this
has been less of a motivator due to high office vacancy and lower
occupancy cost in these central locations. Hence, we believe the
likelihood of further decentralisation moves are low. This view is
supported by recent distributed briefs requesting proposals from
agents and landlords for space within the CBD and fringe for
pending state government expiries.
There is currently 41,520sqm of space under construction and
scheduled for delivery over the next three years. Approximately
half of this will be delivered in 2018, with projects being delivered
in West Perth, Subiaco and Joondalup. The remaining 20,000sqm
is located in Fremantle and scheduled for 2020 completion.
25 Balcatta Road, Balcatta
Leased on behalf of Jarodi Pty Ltd
Metro Office | Research & Forecast Report | First Half 2018 19Research &
Forecast Report
NEWCASTLE
Metro Office | First Half 2018
By Peter Macadam
Director | Commercial Newcastle vacancy rates
peter.macadam@colliers.com
30%
25%
MARKET HIGHLIGHTS
20%
15%
Lack of new supply drives vacancy rates lower 10%
5%
Stock withdrawals continue as residential conversion/ 0%
Jan-08 Jan-09 Jan-10 Jan-11 Jan-12 Jan-13 Jan-14 Jan-15 Jan-16 Jan-17 Jan-18
redevelopment demonstrates highest and best use Total A Grade B Grade C Grade D Grade
Source: Colliers International/PCA OMR 2018
Value add opportunities in lower grade stock driving capital
Stock withdrawals bolster lower grade
investment in the CBD
building vacancies
All grades in the Newcastle market have historically low vacancy
Fully committed new supply keeps A grade rates which is not only a result of a diversified economy and
office market vacancy outlook low business confidence, but aided by stock withdrawals. The impact
of stock withdrawals is particularly evident when considering the
The Newcastle and Charlestown markets provide commercial
lower C grade and D grade buildings, which have vacancy rates of
stock of 306,300sqm, with a combined vacancy of 9.20 per
10.4 per cent and 8.3 per cent respectively.
cent as at January 2018. In both markets, the A grade vacancy
remains low due to the lack of new supply, with A grade
Value add opportunities in lower grade stock
vacancy rates of 6.4 per cent in Newcastle and 3.4 per cent in
Charlestown. The A grade vacancy is forecast to fall further by
driving capital investment in the CBD
January 2019 when the circa 10,100 square metre Gateway Stage There have been no notable investment transactions within
II project is completed and added to the A grade stock. the core Newcastle CBD since Colliers International transacted
51–55 Bolton Street, Newcastle in January 2017. Nonetheless,
The PCA’s Office Market Report shows Newcastle is performing
repositioning and value-add opportunities continue to be in high
well against all non-CBD office markets, with all markets that have
demand from syndicators and high net worth investors, particularly
a lower vacancy rate located in metropolitan locations.
given the ongoing urban renewal. The construction of the light rail
A grade vacancy has remained low as there is traditionally limited commenced in September 2017, with the government investment
speculative development, with the recent development by DOMA in fixed infrastructure considered a key driver in the urban renewal
Group of 18 Honeysuckle Drive an exception. Consequently, our of the Newcastle CBD. Our project marketing team have evidenced
net absorption is roughly at parity with new supply, with average unprecedented demand for apartment living, which has resulted in
A Grade net absorption since January 2009 of approximately continued demand from national and local developers as the CBD
4,000m² per annum. A more vibrant CBD that is attractive to is transformed with education, residential, commercial and retail
company CEOs and a skilled workforce, coupled with the pricing development, complemented by attractive open public spaces.
advantage and lifestyle offering, is anticipated to have a flow-on There has been a paucity of investment stock within the region,
effect to the commercial occupier market. with the weight of investment capital increasing competition and
maintaining yields at record levels.
20You can also read