MI COVID response Data and modeling update - September 28, 2021 - State of ...
←
→
Page content transcription
If your browser does not render page correctly, please read the page content below

MI COVID response
Data and modeling update
September 28, 2021
Executive Summary
Michigan remains at High Transmission
Percent positivity (8.8%) is steady from last week (8.8% last week)
Case rate (246.3 cases/million) is increasing for three months (234.4 last week)
  Michigan has 49th lowest number of cases (43rd last week), and 27th lowest case rate (15th last week) in the last 7 days
  99% of positive tests available for sequencing in Michigan were Delta variant in the last 4 weeks
Percent of inpatient beds occupied by individuals with COVID (7.4%) is increasing for 10 weeks (up from 7.0% last week)
  Michigan has 17th lowest inpatient bed utilization (12th last week) and 13th lowest adult ICU bed utilization (13th last week)
Death rate (2.8 deaths/million) is increasing for eight weeks (2.3 last week). There were 194 COVID deaths between Sep 14-Sep 20
  Michigan has the 30th lowest number of deaths (T26th last week), and T7th lowest death rate (T7th last week) in the last 7 days
7-day average state testing rate increased to 3,978.9 tests/million/day. Daily diagnostic tests (PCR) is 34.2K per day.
10.57 million COVID-19 vaccine doses administered, 52.2% of population is fully vaccinated (5.21 million people)

Science Round Up
Ridge regression model projects continued increases for cases and deaths in Michigan although case trends may be slowing
CDC models project plateau or slowed increases in cases, hospitalizations, and deaths in Michigan
In Michigan, pediatric admissions are increasing and over 50% of children hospitalized have no reported underlying conditions
CDC data show that case rates among children are higher in counties where school districts do not have mask policies
CDC V-SAFE Reports show 3rd dose side effects are comparable to 2nd dose and extremely rare

                                                                                                                                    2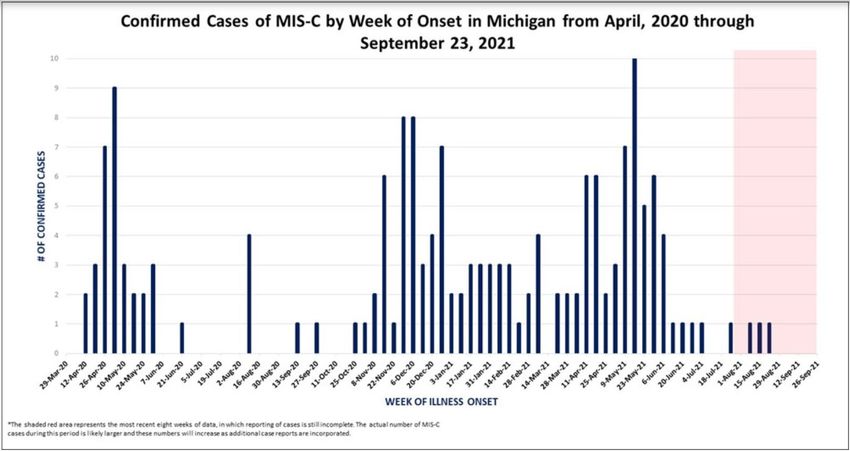
Global and National Comparisons
 Globally, 231,931,317 cases and 4,749,880 deaths (Data* through
 9/27/21)
 •   Countries with the highest case count are U.S. (42,932,211), India
     (33,678,786), and Brazil (21,351,972)

 United States: Nearly all US jurisdictions have High community
 transmission¶
 •   California and Connecticut are Substantial
 •   Puerto Rico and Northern Mariana Islands are Moderate
 •   Weekly rates of cases and hospitalizations due to COVID-19 have
     recently increased in children ages 11 years and younger. The
     increases come as many schools across the country have resumed
     in-person learning
 •   7-day moving average of daily new cases decreased 17.1%
     compared with previous 7-day moving average
 •   Percent positivity has decreased from the previous week, now at
     7.6%. The number of PCR tests performed has increased.

 Midwest states maintain High transmission levels†
 •  Some indication of slowing
    Source: * Johns Hopkins Coronavirus Resource Center; ¶ CDC COVID Data Tracker Weekly Review; † CDC COVID Data Tracker

                                                                                                                            Public Health     Other       Science
National Comparison                            Spread                                Severity
                                                                                                                             Response       Indicators   Round-up   3
State Comparisons: Ohio and Indiana
Ohio Confirmed New Cases / 1M (7 days average)                                                                 Indiana Confirmed New Cases / 1M (7 days average)

                                                                                                               1000
1000

                                                                                                                500
 500

   0                                                                                                              0
       May 1, 20 Jul 1, 20   Sep 1, 20 Nov 1, 20 Jan 1, 21 Mar 1, 21 May 1, 21   Jul 1, 21   Sep 1, 21                May 1, 20 Jul 1, 20   Sep 1, 20 Nov 1, 20 Jan 1, 21 Mar 1, 21 May 1, 21   Jul 1, 21   Sep 1, 21

                                                                                                               60K
60K
            Percent Positive (7 day average)                    New Tests
                                                                                                                             Percent Positive (7 day average)
                                                                                                               40K
40K                                                                                                                                                                                                                12.3%
                                                                                                                                                                                         New Tests
                                                                                                    11.6%

20K                                                                                                            20K

 0K                                                                                                             0K
       May 1, 20 Jul 1, 20   Sep 1, 20 Nov 1, 20 Jan 1, 21 Mar 1, 21 May 1, 21   Jul 1, 21   Sep 1, 21                May 1, 20 Jul 1, 20   Sep 1, 20 Nov 1, 20 Jan 1, 21 Mar 1, 21 May 1, 21   Jul 1, 21   Sep 1, 21

   0                                                                                                              0

 -50            Mobility retails and recreational                                                               -50
                                                                                                                             Mobility retails and recreational

 400                                                                                                            400
                                                                                                         308
                     Hospitalizations / 1M                                                                                            Hospitalizations / 1M                                                             291

 200                                                                                                            200

   0                                                                                                              0
       May 1, 20 Jul 1, 20   Sep 1, 20 Nov 1, 20 Jan 1, 21 Mar 1, 21 May 1, 21 Jul 1, 21     Sep 1, 21                May 1, 20 Jul 1, 20   Sep 1, 20 Nov 1, 20 Jan 1, 21 Mar 1, 21 May 1, 21 Jul 1, 21     Sep 1, 21

                                                                                                                                                                                                                        4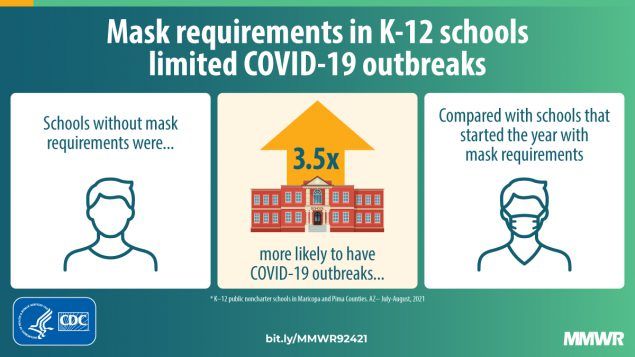
State Comparisons: Wisconsin and Michigan
Wisconsin Confirmed New Cases / 1M (7 days average)                                                         Michigan Confirmed New Cases / 1M (7 days average)

                                                                                                            800
1000
                                                                                                            600

 500                                                                                                        400

                                                                                                            200
   0                                                                                                          0
       May 1, 20 Jul 1, 20   Sep 1, 20 Nov 1, 20 Jan 1, 21 Mar 1, 21 May 1, 21   Jul 1, 21   Sep 1, 21             May 1, 20 Jul 1, 20   Sep 1, 20 Nov 1, 20 Jan 1, 21 Mar 1, 21 May 1, 21   Jul 1, 21   Sep 1, 21

60K
            Percent Positive (7 day average)                                                                80K
                                                                New Tests
                                                                                                            70K
40K                                                                                                         60K           Percent Positive (7 day average)
                                                                                                     8.7%
                                                                                                            50K
                                                                                                                                                                                      New Tests
                                                                                                            40K
20K                                                                                                         30K
                                                                                                            20K                                                                                                  8.0%
                                                                                                            10K
 0K
       May 1, 20 Jul 1, 20   Sep 1, 20 Nov 1, 20 Jan 1, 21 Mar 1, 21 May 1, 21   Jul 1, 21   Sep 1, 21             May 1, 20 Jul 1, 20   Sep 1, 20 Nov 1, 20 Jan 1, 21 Mar 1, 21 May 1, 21   Jul 1, 21   Sep 1, 21

   0                                                                                                           0

 -50            Mobility retails and recreational                                                            -50
                                                                                                                          Mobility retails and recreational

                                                                                                            -100
 400                                                                                                         400
 300                                                                                                                           Hospitalizations / 1M
                     Hospitalizations / 1M                                                           202
                                                                                                                                                                                                                 151
 200                                                                                                         200
 100
                                                                                                               0
       May 1, 20 Jul 1, 20   Sep 1, 20 Nov 1, 20 Jan 1, 21 Mar 1, 21 May 1, 21 Jul 1, 21     Sep 1, 21             May 1, 20 Jul 1, 20   Sep 1, 20 Nov 1, 20 Jan 1, 21 Mar 1, 21 May 1, 21 Jul 1, 21     Sep 1, 21

                                                                                                                                                                                                                     5
State Comparisons: Illinois and Minnesota
Illinois Confirmed New Cases / 1M (7 days average)                                                             Minnesota Confirmed New Cases / 1M (7 days average)

1000                                                                                                           1000

 500                                                                                                            500

   0                                                                                                              0
       May 1, 20 Jul 1, 20   Sep 1, 20 Nov 1, 20 Jan 1, 21 Mar 1, 21 May 1, 21   Jul 1, 21   Sep 1, 21                May 1, 20 Jul 1, 20   Sep 1, 20 Nov 1, 20 Jan 1, 21 Mar 1, 21 May 1, 21   Jul 1, 21   Sep 1, 21

                                                                                                               100K
100K        Percent Positive (7 day average)                    New Tests
                                                                                                                             Percent Positive (7 day average)

                                                                                                               50K                                                                       New Tests                  7.3%
50K

                                                                                                     3.2%

 0K                                                                                                             0K
       May 1, 20 Jul 1, 20   Sep 1, 20 Nov 1, 20 Jan 1, 21 Mar 1, 21 May 1, 21   Jul 1, 21   Sep 1, 21                May 1, 20 Jul 1, 20   Sep 1, 20 Nov 1, 20 Jan 1, 21 Mar 1, 21 May 1, 21   Jul 1, 21   Sep 1, 21

   0
                                                                                                                  0

 -50            Mobility retails and recreational                                                               -50
                                                                                                                             Mobility retails and recreational

 400
                                                                                                                300
 300                                                                                                                              Hospitalizations / 1M
                     Hospitalizations / 1M                                                                      200
 200                                                                                                                                                                                                                    134
                                                                                                         129    100
 100
                                                                                                                  0
       May 1, 20 Jul 1, 20   Sep 1, 20 Nov 1, 20 Jan 1, 21 Mar 1, 21 May 1, 21 Jul 1, 21     Sep 1, 21                May 1, 20 Jul 1, 20   Sep 1, 20 Nov 1, 20 Jan 1, 21 Mar 1, 21 May 1, 21 Jul 1, 21     Sep 1, 21

                                                                                                                                                                                                                        6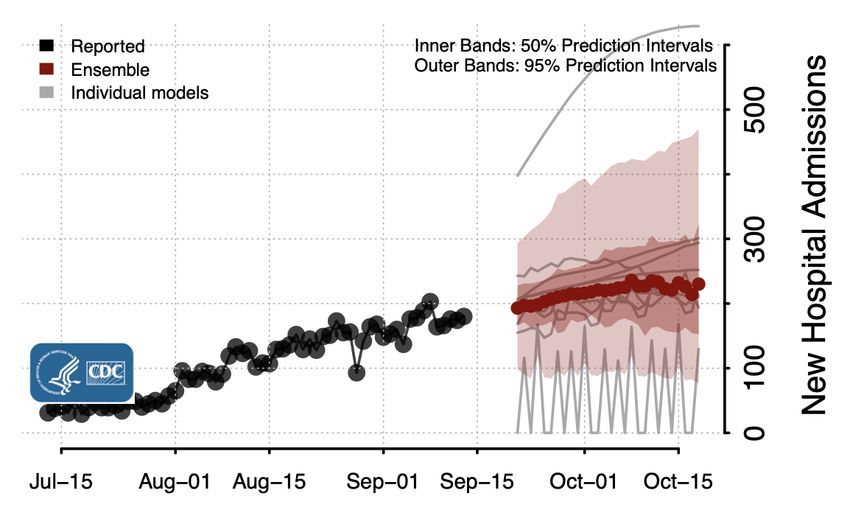
Key Messages: COVID-19 Burden Among Younger Ages Remains High
    Statewide positivity is steady at 8.8% (last week: 8.8%)
    •   This is a 9% decline since recent peak on September 12
    •   Positivity is decreasing in three of the MERC regions (Detroit, Kalamazoo, Lansing)
    •   Positivity in six regions is above 10%
    Case rate has increased to 246.3 cases/million (last week: 234.4 cases/million)
    • Increasing for three months (June 26 low)
    • Cases per million are plateaued or decreasing in most MERC regions; trend numbers are being impacted by backfill times
    • 10-19-years-olds are experiencing the greatest case burden (521.0 daily cases; 415.2 cases/mil) while those 0-9 saw largest growth (+10%)
    • Each day nearly 370 children under age 12 become infected with COVID-19, 50 more children per day than last week
    • Daily average pediatric (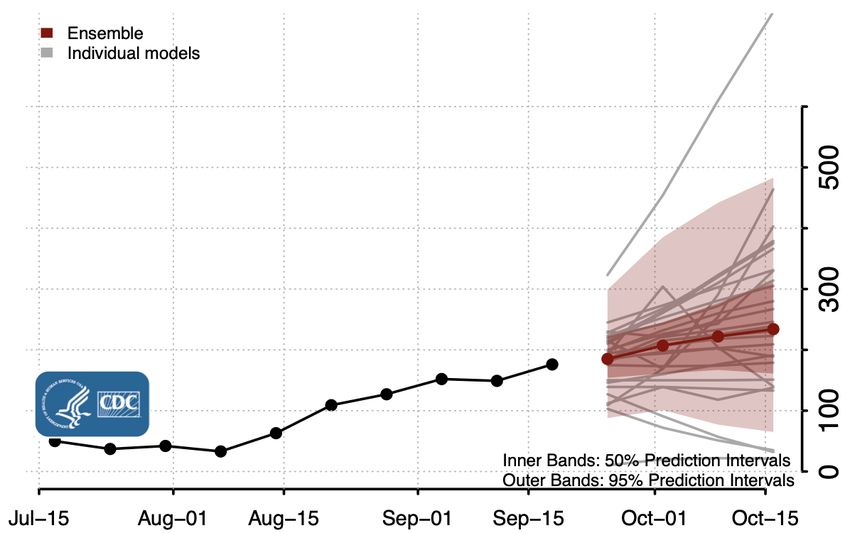
Confirmed and probable case indicators                                                             Risk levels
         Table Date: 9/27/2021 (7 days from date table was produced: 9/20/2021)                Low      A    B      C     D   E

                                                                                                 8wks

           Cases                                            Positivity

                                                            Public Health           Other                           Science
National Comparison     Spread             Severity                                                                               8
                                                                                                                                  8
                                                              Response            Indicators                      Round-up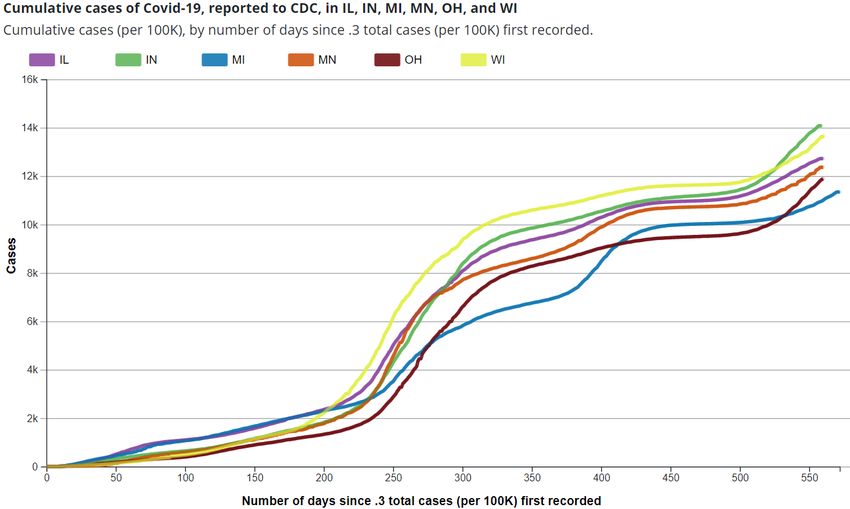
Time Trends – Positivity, Case Rates, Hospitalizations, Deaths
Early indicators show Delta surge may be slowing but burden remains high
Daily Positive Test Rate Daily Inpatient Beds Occupied by COVID patients
Daily Case Rate Daily Deaths
Public Health Other Science
National Comparison Spread Severity 9
9
Response Indicators Round-up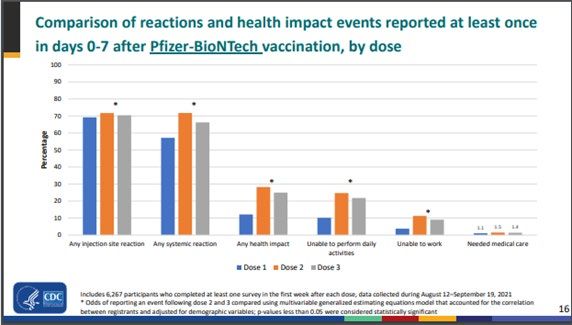
Michigan Lag adjusted new COVID cases by onset date

 New confirmed cases by onset actual and adjusted as of September 27, 2021 (-2 days)                                 • The gray line is cases reported
    8K
                                                                                                                       as of 9/27 by onset date.
                                                                                                                     • The blue line is the expected
    7K
                     ADJUSTED
                                                                                                                       adjustment for cases by onset
                     NEW_CASES                                                                                         date as data is backfilled
    6K
                                                                                                                     • The increasing delay between
                                                                                                                       onset of symptoms and date
    5K
                                                                                                                       of testing means that recent
    4K                                                                                                                 case numbers underestimate
                                                                                                                       the true number of cases
    3K

    2K

    1K

    0K
         Feb 1, 20   Apr 1, 20   Jun 1, 20   Aug 1, 20   Oct 1, 20   Dec 1, 20   Feb 1, 21   Apr 1, 21   Jun 1, 21      Aug 1, 21   Oct 1, 21

                                                                                                                                                    10
Overview of metrics for individuals < 18
*
• Each day more than 370 children under age 12 become infected with COVID-19, 50 more children per day than last week
• Pediatric case rates have increased from 227.4 to 265.4
• Pediatric (Overview of metrics for individuals < 18: Key changes from last week
MERC Region Pediatric Case Rate – Pediatric Hospitalization • Each day more than 370 children under age 12
One Week Rate – One Week
% Change (Δ Rate)¶ % Change (Δ Rate)†
become infected with COVID-19, 50 more
children per day than last week
Detroit 28% (+49) 51% (+6)
• Pediatric case rates have increased from 227.4
Grand Rapids 10% (+30) 38% (+4)
to 265.4
Kalamazoo -16% (-41) -49% (-3) • Pediatric (Michigan at High Transmission Level
Dashboard | CDC | MI Start Map for most recent data by
reporting date
Source: MI Start Map; data through 9/27/2021
Public Health Other Science
National Comparison Spread Severity 13
Response Indicators Round-upCase Rate Trends by Age Group
Daily new confirmed and probable cases per million by age group (7-day rolling average)
0-9 30-39 60-69
1000 500
10-19 40-49 70-79
20-29 50-59 80+
400
750
300
500
200
250
100
0 0
3/1 5/1 7/1 9/1 11/1 1/1 3/1 5/1 7/1 9/1 6/26 7/10 7/24 8/7 8/21 9/4 9/18
• Case rate trends for all age groups are slowing and are decreasing for some age groups
• Case rates for all age groups are between 130 and 415 cases per million (through 9/20)
• Case rates are highest for 10-19-year-olds followed by 30-39, 20-29, 40-49, and 0-9
Note: Case information sourced from MDHHS and reflects date of onset of symptoms
Source: MDHHS – Michigan Disease Surveillance System
Public Health Other Science
National Comparison Spread Severity 14
14
Response Indicators Round-upNumber of Cases and CaseRates by Age Group
Daily new confirmed and probable cases per million by age group (7-day rolling average)
Age Average† Average† One Week • Trend number are being impacted by longer
Group daily cases Daily Case % Change (Δ #) backfill times and data suggest case trends
Rate are slowing
0-9 271.6 235.6 10% (+25) • Largest one-week growth among those 0 to 9
10-19 521.0 415.2 -4% (-20) years of age (10%, +25 cases/day)
20-29 366.3 265.5 -9% (-35) • Average daily number of cases (521.0) and
30-39 379.1 312.5 -4% (-15) avg. daily case rate (415.2 case/mil) are
highest for those aged 10-19
40-49 299.4 253.9 -2% (-5)
50-59 256.9 190.2 -1% (-2) • Case rate trends are decreasing for most
age groups, with largest decline among 20–
60-69 193.1 151.4 -6% (-12)
29-year-olds (-9%, -35 cases/day)
70-79 106.4 138.8 -4% (-4)
• Case rates for age groups 10-19, 20-29, 30-
80+ 53.0 128.0 4% (+2) 39, and 40-49 are all higher than the state
Total¶ 2,462.1 246.3 +5% (+114)
† Rolling 7-day average; ¶ Total may not reflect state due to missing age data
Note: Case information sourced from MDHHS and reflects date of onset of symptoms
Source: MDHHS – Michigan Disease Surveillance System
• Case rates bottomed out on June 26, 2021
Public Health Other Science
National Comparison Spread Severity 15
Response Indicators Round-up 15Case Rates by Reported Racial and Ethnic Group
Daily new confirmed and probable cases per million Daily new confirmed and probable cases per
(7 day rolling average) by race category million (7 day rolling average) by ethnicity category
American Indian/Alaska Native Black/African American Hispanic or Latino Not Hispanic or Latino
300 300
Asian/Pacific Islander White
Race Case Rate
American Indian/ 296.4
Alaskan Native
200 200
Asian/Pacific Islander 74.2
Black/African American 134.9
White 188.2
100 100
Race Case Rate
Hispanic/Latino 192.7
Non-Hispanic 181.3
0 0
6/26 7/10 7/24 8/7 8/21 9/4 9/18 6/26 7/10 7/24 8/7 8/21 9/4 9/18
Updates since last week:
• Cases per million are decreasing for most races and ethnicities
• The high number of cases with missing race/ethnicity data, and those multiracial or other are impacting the case rates shown here
• American Indian/Alaskan Native have the highest case rates
• In the past 30 days, 22% (↑1%) of race data and 26% (↔) ethnicity data was either missing or reported as unknown
Note: Case information sourced from MDHHS and reflects date of death of confirmed and probable cases.
Source: MDHHS – Michigan Disease Surveillance System
Public Health Other Science
National Comparison Spread Severity 16
16
Response Indicators Round-upIdentified COVID-19 Cases Caused by All Variants of Concern (VOC)
in US and Michigan
Variants Circulating in United States, Sep 17 – Variants of Concern in Michigan, Sep 27
Sep 25 (NOWCAST)
796 cases in Wayne attributed to Detroit
Variant MI Reported Cases¶ # of Counties % Specimens in last 4 wks
B.1.1.7 (alpha) 13,667*† 81 0%
B.1.351 (beta) 88 24 0%
P.1 (gamma) 336 35 0.2%
Data last updated Sep 27, 2021 B.1.617.2 (delta) 3,492 (↑707) 81 (↑1) 99.8%
Source: https://covid.cdc.gov/covid-data-tracker/#variant-proportions and MDSS
* 534 cases within MDOC; ¶ 44 cases with county not yet determined; † 31 duplicate results removed
Public Health Other Science
National Comparison Spread Severity 17
Response Indicators Round-upIdentified COVID-19 Delta Variants by County
Last week (Sep 20, 2021) This week (Sep 27, 2021)
Data last updated Sep 27, 2021
Source: MDSS
Public Health Other Science
National Comparison Spread Severity 18
Response Indicators Round-upUpdate to SARS-CoV-2 Variant Classifications and Tracking
CDC introduces Variants Being Monitored WHO introduces Variants Under Monitoring
(VBM) (VUM)
• The US government SARS-CoV-2 Interagency Group (SIG) • Formerly called “Alerts for Further Monitoring”
added a new class of SARS-CoV-2 variants designated as VBM
• A SARS-CoV-2 variant with genetic changes that are
• This class includes variants that are no longer detected or are suspected to affect virus characteristics with some indication
circulating at very low levels in the United States, and do not that it may pose a future risk, but evidence of phenotypic or
pose a significant or imminent risk to public health in the US epidemiological impact is currently unclear, requiring
• Alpha (B.1.1.7), Beta (B.1.351), and Gamma (P.1) have been enhanced monitoring and repeat assessment pending new
reclassified from VOCs to VBMs evidence
• Epsilon (B.1.427/B.1.429), Eta (B.1.525), Iota (B.1.526), Kappa • A previously designated VOI or VOC which has conclusively
(B.1.617.1), Mu (B.1.621), Zeta (P.2), and B.1.617.3 have also
been reclassified as VBMs demonstrated to no longer pose a major added risk to global
public health compared to other circulating SARS-CoV-2
• Currently, only Delta (B.1.617.2) and its sublineages (AY) variants, can be reclassified
remain VOCs in the US • There are 14 variants classified as VUMs by the WHO including
Epsilon, Kappa, Iota, and Eta
• Currently, there are no Variants of Interest (VOIs) or Variants
of High Consequence (VOHC) in the US • Currently, WHO continues to classify Alpha, Beta, Gamma,
and Delta as VOCs
• Currently, WHO lists Lambda (C.37) and Mu (B.1.621) as VOIs
Both organizations continue to monitor SARS-CoV-2 variants and assess threats to public health. Variants
may be escalated or deescalated based on the emerging scientific evidence.
Data last updated Sep 27, 2021
Source: CDC and WHO
Public Health Other Science
National Comparison Spread Severity 19
Response Indicators Round-upNumber of Outbreaks Reported has Increased
Number of outbreak investigations by site type, week ending Sep 23
Visibility1 Easier to identify outbreak
Site type Outbreaks by ongoing/new classification, # Harder to identify outbreak
Ongoing New Total
K- 12 SCHO O L 184 105 289 Total number of active
SNF/L T C/ O T HE R A SSIS T E D LIV ING 94 20 114 outbreaks is up 9% from
MA NUF A CT UR IN G , CONS T R U CT IO N 46
37 9
previous week
CHIL DCA R E/Y O U T H PRO G RA M 37
34 3
*RETA IL 24 7 31
K-12 schools reported the
OTHER 16 7 23
greatest number of new
HEA L T HCA R E 10 5 15
outbreaks (105) this week,
*SOCIA L GA THER IN G 12 2 14
and there were an additional
*RES TA U RA N T S A ND BA RS 9 3 12
10 1 11
3 new outbreaks in childcare
CORRE C T I O N S
9 2 11
and youth programs for a
*CO MMU N IT Y EXPO S UR E - OUT DO O R
OFF ICE SET T IN G 6 2 8 total of 108 outbreaks in
COLL EG E/ U N IV E R S IT Y 7 1 8 settings primarily with 0-19-
A GRICU L T U RA L / F O O D PRO CE S S I NG 5 0 5 year-olds. (64% of all known
*PER S O NA L SERV IC E S 4 0 4 new outbreaks)
*SHEL T E RS 3 1 4
*REL I G I O U S SERV I CE S 3 0 3 The next greatest number of
*CO MMU N IT Y EXPO S UR E - INDO O R 1 0 1 new outbreaks was among
636 SNF/LTC (20), followed by
TO TA L 468 168
manufacturing/construction
1. Based on a setting’s level of control and the extent of time patrons/residents spend in the particular setting, different settings have differing levels of ability to ascertain whether a case derived from that setting (9), retail and other (7 each),
NOTE: Many factors, including the lack of ability to conduct effective contact tracing in certain settings, may result in significant underreporting of outbreaks. This chart does not provide a complete picture of
and nine other settings with at
outbreaks in Michigan and the absence of identified outbreaks in a particular setting in no way provides evidence that, in fact, that setting is not having outbreaks. least 1 new outbreak in the last
week.
Source: LHD Weekly Sitreps
Public Health Other Science
National Comparison Spread Severity 20
20
Response Indicators Round-upK-12 school outbreaks, recent and ongoing, week ending Sep 23
Number of reported outbreaks increased since last week (218 to 289), including increases in High Schools (88 to 107), Middle/Jr High (46 to
68), and Pre K-Elementary (79 to 110). Only Administrative declined (5 to 4).
Number of Range of cases
Region Number of reported cases, # # Ongoing - Excluding New # New outbreaks per outbreak
Region 1 234 72 58 2-18
Region 2n 50 59 27 2-20
Region 2s 101 50 26 2-19
Region 3 365 175 70 2-42
Region 5 116 9 22 2-31
Region 6 194 133 47 2-44
Region 7 46 17 12 3-12
Region 8 113 95 27 2-29
Total 1,219 610 289 2-44
Number of Range of cases
Grade level Number of reported cases, # # Ongoing - Excluding New # New outbreaks per outbreak
Pre-school - elem. 349 255 110 2-32
Jr. high/middle school 261 140 68 2-16
High school 596 213 107 2-44
Administrative 13 2 4 2-9
Total 1,219 610 289 2-44
Many factors, including the lack of ability to conduct effective contact tracing in certain settings, may result in significant underreporting of outbreaks. This chart does not provide a complete picture
of outbreaks in Michigan and the absence of identified outbreaks in a particular setting in no way provides evidence that, in fact, that setting is not having outbreaks.
Source: LHD Weekly Sitreps
Public Health Other Science
National Comparison Spread Severity 21
21
Response Indicators Round-upUpdate on surveillance with the K-12 setting and school cluster and
outbreak definition
• As of 9/27/2021, MDHHS is utilizing the latest definitions for measuring outbreaks and clusters of COVID-19 in K-12 schools in
accordance with the Council of State and Territorial Epidemiologists standards
• Surveillance case definitions are often modified over time as the epidemic evolves and more evidence are collected to better inform future
surveillance practices and standards
• The new definition from CSTE has separate criteria for defining an outbreak and a cluster associated with a school setting while the
previous definition ONLY included an outbreak definition
• Outbreaks rely on confirming exposure linkages between cases
• While clusters account for school cases where a definitive exposure linkage has not been established.
• The previous outbreak definition threshold was 2 cases, while the new outbreak and cluster definitions requires 3 or more cases OR
having multiple cases comprising at least 10% of a core school group.
• Previously, MDHHS reported out school related outbreaks only
• The new definition will not be applied to retrospective data
• Utilizing the new surveillance definition, MDHHS now reports both outbreaks and clusters in aggregate
• For consistency and transparency in public reporting, both clusters and outbreaks will be reported in aggregate as there are numerous
barriers to identifying epidemiological or exposure linkages between cases, including:
• Limited resources to perform comprehensive case investigations at the local level
• Availability of school resources to participate in the case investigation process
• Public engagement with investigators in the case investigation process
Public Health Other Science
National Comparison Spread Severity 22
22
Response Indicators Round-upKey Messages: Healthcare Capacity and COVID Severity
Hospitalizations and ICU utilization are increasing
3.9% of ED visits are for COVID diagnosis (up from 3.5% last week)
Hospital admissions are increasing for most age groups this week
Hospital census has increased 9% (vs. plateau week prior)
All regions experienced increasing trends in hospital census this week
Hospitalization for COVID-19 is highest in Regions 3, 6, 7, and 8
Most growth is in Regions 6, 7, and 8
Volume of COVID-19 patients in intensive care has increased 6% since last week (vs. 3% decrease last week)
Death rate has increased to 2.8 daily deaths/million residents (up from 2.3 deaths/million last week)
One week percent change is up 8% (vs. up 9% last week)
Death rate has increased eight weeks (547% increase since Jul 22 low)
30-day proportion of deaths among those under 60 years of age is steady from the prior week
Public Health Other Science
National Comparison Spread Severity 23
Response Indicators Round-upMichigan Trends in Emergency Department (ED) Visits for
Diagnosed COVID-19
3.9%
• Trends for ED visits have increased to 3.9% since last week (3.5% week prior)
• Trends vary by age groups with most age groups seeing an increase
• Over past week, those 40-49 years saw highest number of avg. daily ED CLI visits (5.2%), but those between 25 and 74 all above state average
Source: https://covid.cdc.gov/covid-data-tracker/#ed-visits
Public Health Other Science
National Comparison Spread Severity
Response Indicators Round-up 24Average Hospital Admissions by Age Group
50
45
40
35
30
25
20
15
10
5
0
8/22 8/29 9/5 9/12 9/19 9/26
Peds 0 - 11 12 - 17 18 - 19 20 - 29 30 - 39 40 - 49 50 - 59 60 - 69 70 - 79 80+ Age
Unkn
• Trends for daily average hospital admissions have increased 8% since last week (vs. 5% increase prior week)
• Most age groups experienced a one week increase in daily hospital admissions
• Over the past week, those 60-69 years have seen the highest number of avg. daily hospital admissions (38 admissions)
Source: CHECC & EM Resource
Public Health Other Science
National Comparison Spread Severity 25
Response Indicators Round-up 25Average Hospital Admissions by Age Group
Peds
• Trends for daily average hospital admissions have increased 8% since last week (vs. 5% increase prior week)
• Most age groups experienced a one week increase in daily hospital admissions
• Over the past week, those 60-69 years have seen the highest number of avg. daily hospital admissions (38 admissions)
Source: CHECC & EM Resource
Public Health Other Science
National Comparison Spread Severity 26
Response Indicators Round-up 26Number of Hospital Admissions and Admission Rates are Increasing for Most
Age Groups
Daily new hospital admission per million by age group (7 -day rolling average)
Age Average† daily Average† Daily One Week • Through September 27, there were an average of 203
Group number of hospital Hospital % Change (Δ #) hospital admissions per day due to COVID-19, which
admissions Admission Rate* is 16 (8%) more than last week
0-11 2.9 2.1 -23% (-1) • The largest one-week percent change in admissions
12-17 2.6 3.4 38% (+1) was among those 12-17 years of age (38%) and this
18-19 1.6 6.0 -27% (-1) accounts for ~1 additional COVID hospital admission
per day
20-29 10.7 7.8 -9% (-1)
• The largest on week change in number of admissions
30-39 15.3 12.6 3% (+Statewide Hospitalization Trends: Total COVID+ Census
Hospitalization Trends 3/1/2021 – 9/27/2021 The COVID+ census in hospitals has has
Confirmed Positive & Persons Under Investigation (PUI) increased 9% from the previous week.
Confirmed Positive
Hospitalized COVID Positive Long Term
Trend (beginning March 2020)
PUI
28Statewide Hospitalization Trends: Regional COVID+ Census
The census of COVID+ patients in hospitals has
Hospitalization Trends 3/1/2021 – 9/27/2021 increased in each region from last week.
Confirmed Positive by Region Regions 6, 7 and 8 have experienced the largest
increases from last week.
Region 1
Region 2N
Region 2S
Regions 3, 6, 7, and 8 have greater than 150/M
Region 3 population hospitalized.
Region 5
Region 6
Region 7
Region 8 Region COVID+ COVID+
Hospitalizations (% Δ Hospitalizations
from last week) / MM
Region 1 157 (3%) 145/M
Region 2N 331 (2%) 149/M
Region 2S 332 (11%) 149/M
Region 3 211 (5%) 186/M
Region 5 123 (3%) 129/M
Region 6 275 (20%) 187/M
Region 7 75 (21%) 150/M
Region 8 48 (50%) 154/M
29Statewide Hospitalization Trends: ICU COVID+ Census
Overall, the census of COVID+ patients in ICUs has
Hospitalization Trends 3/1/2021 – 9/27/2021 increased by 6% from last week.
Confirmed Positive in ICUs
Regions 6 and 7 had the largest increases this week.
There are small decreases in Regions 1, 2S, 5 and 8.
Region 1 and 3 have ICU occupancy of 90% and
Region 6 now has >30% of all ICU beds occupied
with COVID+ patients.
Region Adult COVID+ in Adult ICU % of Adult ICU
ICU (% Δ from Occupancy beds COVID+
last week)
Region 1 47 (-2%) 90% 27%
Region 2N 81 (7%) 72% 15%
Region 2S 84 (-2%) 80% 12%
Confirmed Region 3 53 (6%) 90% 15%
Positive in ICU Region 5 31 (-11%) 75% 17%
Region 6 73 (30%) 80% 31%
Region 7 33 (27%) 83% 23%
Region 8 11 (-8%) 65% 18%
30Average and total new deaths, by age group
Daily COVID-19 deaths in confirmed and probable Total COVID -19 deaths in confirmed and probable
cases per million by age group (7 day rolling cases by age group (past 30 days, ending 9/20/2021)
average)
20 0-19 40-49 70-79 • 23% of deaths below age sixty
20-29 50-59 80+ 212
192
30-39 60-69 Total
15
146
10
88
5 43
12 16
1-5
0
7/22 8/5 8/19 9/2 9/16 0-19 20-29 30-39 40-49 50-59 60-69 70-79 80+
• Overall trends for daily average deaths are increasing since last week
• Through 9/20, the 7-day avg. death rate is more than 10 daily deaths per million people for those over the age of 70
Note: Death information sourced from MDHHS and reflects date of death of confirmed and probable cases.
Source: MDHHS – Michigan Disease Surveillance System (MDSS)
Public Health Other Science
National Comparison Spread Severity 31
Response Indicators Round-up 3130-day rolling average daily deaths per million people by race and
ethnicity
Average daily deaths per million people by race Average daily deaths per million people by
ethnicity
6 American Indian/Alaska Native Black/African American 6 Hispanic or Latino Not Hispanic or Latino
Asian/Pacific Islander White
4 4
2 2
0 0
7/22 8/5 8/19 9/2 9/16 7/22 8/5 8/19 9/2 9/16
• Deaths are a lagging indicator
• Death rates are increasing for most reported racial and ethnic groups
• Currently, American Indian/Alaskan Natives have the highest death rate
Note: Death information sourced from MDHHS and reflects date of death of confirmed and probable cases.
Source: MDHHS – Michigan Disease Surveillance System
Public Health Other Science
National Comparison Spread Severity 32
Response Indicators Round-up• `
Key Messages: Public Health Response
COVID-19 Vaccination
• 4,723 first doses administered each day (7-day rolling average*)
• Most administered frequently by pharmacies, local health departments, and hospitals
• More than 68K third doses administered since third dose recommendation for immunocompromised individuals
• More than 5.2 million people (52.2%) in the state are fully vaccinated
• Less than 1% of people who were fully vaccinated experienced vaccine breakthrough
• Trends over time show that both case and death rates among the Fully Vaccinated are lower than the Not Fully
vaccinated rates in Michigan
• Older age groups in Michigan have had higher vaccine coverage and lower case rates during the Delta surge and
the previous Alpha (B.1.1.7) surge compared with younger age groups
Source: *https://covid.cdc.gov/covid-data-tracker/#vaccination-trends_vacctrends-onedose-daily
Public Health Other Science
National Comparison Spread Severity
Response Indicators Round-up 33• `
Average Daily Doses Administered (data through 9/27/2021)
13,491,490 doses delivered to providers and 10,568,980
doses administered*
MI 7-day rolling average ending September 22
• 11,083 total doses/day on average †
• 4,723 first doses/day on average †
Total primary series doses (between 9/9-9/25) were most
frequently administered¶ by:
Pharmacies (26.7K)
LHD (2.6K) and hospitals (2.3K)
Family practice (1.8K), FQHCs (1.4K), and Pediatric (491)
Third Doses
• 68,235 third doses administered to date
Sources: *CDC COVID Data Tracker > Vaccinations in the US, † CDC COVID Data Tracker > Vaccination Trends; ¶ MCIR COVID-19 Vaccine Dashboard
Public Health Other Science
National Comparison Spread Severity
Response Indicators Round-up 345.2 Million Michiganders fully vaccinated and 52.2% of total population fully
vaccinated
Vaccination Coverage in Michigan as of 9/27/21
5.21 million people in the state are fully Age Group % At Least % Fully Number Fully
vaccinated*
One Dose Vaccinated Vaccinated
83.8% of people aged 65 and older have
completed the series (+0.3%)* Total Population 56.9% 52.2% 5,210,719
56.9% of total population initiated (+0.4%)* ≥ 12 years 66.1% 60.6% 5,210,601
Race/Ethnicity¶ for those 12 years and older: ≥ 18 years 68.2% 62.8% 4,924,946
• Initiation coverage highest among those of ≥ 65 years 88.3% 83.8% 1,478,924
Non-Hispanic (NH) Asian, Native Hawaiian
or Pacific Islander Race (55.6%), then NH
American Indian (53.4%), NH White
(48.6%), NH Black or African American
Races (38.5%).
• Initiation is at 51.2% for those of Hispanic
ethnicity
• Completion follows the same pattern
• 18.7% data missing or unknown
Source: *CDC COVID Data Tracker > Vaccinations in the US, ¶ MCIR COVID-19 Vaccine Dashboard
Public Health Other Science
National Comparison Spread Severity
Response Indicators Round-up 35`
Potential COVID-19 Vaccination Breakthrough Cases
Michigan part of CDC’s nationwide investigation (COVID-19 Breakthrough Case Investigations and Reporting | CDC)
Michigan Data (1/1/21 through 9/21/21):
• 30,867 cases met criteria based on a positive test 14 or more days after being fully vaccinated
• Less than 1% of people who were fully vaccinated met this case definition
• Includes 417 deaths (368 in persons ages 65 years or older)
• 1,211 cases were hospitalized
• Vaccine breakthrough cases are expected. COVID-19 vaccines are effective and are a critical tool to bring the pandemic under control;
however, no vaccine is 100% effective at preventing illness. Some fully vaccinated people will get sick, and some will even be
hospitalized or die from COVID-19. However, there is evidence that vaccination may make illness less severe for those who are
vaccinated and still get sick. The risk of infection, hospitalization, and death are all much lower in vaccinated people compared to
unvaccinated.
• More than 181 million people in the United States have been fully vaccinated as of September 20, 2021. CDC is monitoring these cases
among vaccinated persons and evaluating trends in order to better understand who is at risk for severe COVID-19 following vaccine
breakthrough infection. Vaccinated people have also experienced asymptomatic infections.
• Current data suggest that COVID-19 vaccines authorized for use in the United States offer protection against most SARS-CoV-2 variants
circulating in the United States.
Public Health Other Science
National Comparison Spread Severity
Response Indicators Round-up 36Update on breakthrough
cases
Public Health Other Science
National Comparison Spread Severity
Response Indicators Round-up 37Cumulative COVID-19 Cases by Vaccination Status, Michigan, Jan 15 – Sep 21
Fully Vaccinated People (4,853,633)
Cases Hospitalization Deaths
Percent of Cases In People Not Percent of Hospitalizations In People Percent of Deaths In People Not
Fully Vaccinated Not Fully Vaccinated Fully Vaccinated
(469,291 / 500,158) (12,980 / 14,191) (5,311 / 5,728)
93.8% 91.5% 92.7%
469,291 12,980 5,311
Total Cases Not Fully Vaccinated Total Hospitalized Not Fully Vaccinated Total Deaths Not Fully Vaccinated
Total Breakthrough Cases Total Breakthrough Hospitalizations Total Breakthrough Deaths
30,867 1,211 417
0.636% 0.025% 0.009%
Percent of Fully Vaccinated People who Percent of Fully Vaccinated People Who Were Percent of Fully Vaccinated People Who Died of
Developed COVID-19 (30,867 / 4,853,633) Hospitalized for COVID-19 (1,211 / 4,853,633) COVID-19 (417 / 4,853,633)
6.2% 8.5% 7.3%
Percent of Cases Who Were Fully Vaccinated Percent of Hospitalizations Who Were Fully Percent of Deaths Who Were Fully Vaccinated
(30,867 / 500,158) Vaccinated (1,211 / 14,191) (417 / 5,728)
Total Cases: 500,158 Total Hospitalizations: 14,191 Total Deaths: 5,728
Michigan Disease Surveillance System may underestimate the frequency of COVID-19 hospitalizations:
- Case investigation and follow-up is more difficult for individuals who get vaccinated (e.g., they are too ill to speak to investigators, don’t answer their phone, or otherwise).
- These hospitalizations include individuals who are hospitalized for issues other than COVID19 (the same as breakthrough COVID-19).
- Individuals who get hospitalization will lag after infection and may occur after case investigation.
Public Health Other Science
National Comparison Spread Severity
Response Indicators Round-up 38Trends in Breakthrough Cases, Hospitalizations, and Deaths
100%
• 52.2% of the population is fully
90%
vaccinated yet only account for ~20-
25% of cases, hospitalizations, and 80%
deaths
70%
• As the fully vaccinated population
has increased, so have the percent 60%
of breakthrough incidents; but
50%
breakthrough burden remains lower
40%
In the last 30 days (Aug 23 – Sep 21), 30%
29%
25% 25%
23%
12,497 (18%) of 67,673 cases, 263 22% 23%
21% 21%
18% 18%
20%
(21%) of 1,238 hospitalizations, and 45 12%
15%
11%12%
(15%) of 292 deaths were among fully 10% 5% 6% 5%
vaccinated individuals 0% 0% 0% 0% 0% 0% 1% 2% 1% 2%
0%
January February March April May June July August Last 30
days
Cases Hospitalizations Deaths
Michigan Disease Surveillance System may underestimate the frequency of COVID-19 hospitalizations:
- Case investigation and follow-up is more difficult for individuals who get vaccinated (e.g., they are too ill to speak to investigators, don’t answer their phone, or otherwise).
- These hospitalizations include individuals who are hospitalized for issues other than COVID19 (the same as breakthrough COVID-19).
- Individuals who get hospitalization will lag after infection and may occur after case investigation.
Public Health Other Science
National Comparison Spread Severity
Response Indicators Round-up 39`
COVID-19 Vaccination Breakthrough Cases and Deaths
1200 Breakthrough Case Rate vs. Not Fully Vaccinated Breakthrough Death Rate vs. Not Fully Vaccinated Death
Case Rate Rate
1000 Case Rate among Fully Vaccinated
12
Case Rate among Not Fully Vaccinated
800 10
8
600
6
400
4
200
2
0 0
1/25 2/25 3/25 4/25 5/25 6/25 7/25 8/25 1/25 2/25 3/25 4/25 5/25 6/25 7/25 8/25
• Trends over time show that both case and death rates among the Fully Vaccinated are lower than the Not Fully vaccinated rates in Michigan
• The proportion of breakthrough cases and deaths among all cases and deaths has shown some increases as more people become fully
vaccinated
• However, the risk of infection and death remains significantly lower among the fully vaccinated
Public Health Other Science
National Comparison Spread Severity
Response Indicators Round-up 40Comparing Vaccine Coverage and Case Rate Trends (Dec 19-Sept 24)
Vaccine coverage (%)
Case rate per million (7-day rolling average)
Vaccine Coverage and Case Rates for Younger Ages
20-29 years 30-39 years 40-49 years 50-59 years
1000
1000 1000 1000
80.0%
80.0% 80.0% 80.0% 800
800 800 800
60.0% 60.0% 60.0% 600 60.0%
600 600 600
400 40.0% 40.0% 400 40.0% 40.0%
400 400
200 20.0% 20.0% 200 20.0%
200 200 20.0%
0 0.0%
0 0.0% 0 0.0%
0 0.0%
Vaccine Coverage and Case Rates for Older Ages
60-69 years 70-79 years 80+ years
1000 1000 1000
80.0% 80.0% 80.0%
800 800 800
60.0% 60.0% 60.0%
600 600 600
400 40.0% 400 40.0% 400 40.0%
200 20.0% 200 20.0% 200 20.0%
0 0.0% 0 0.0% 0 0.0%
• Michigan is experiencing another surge due to the Delta (B.1.617.2) variant
• COVID-19 vaccination increases with increasing age
• Risk of COVID-19 illness increases as age increases1, yet the older age groups in Michigan have had lower case rates during the Delta surge
and the previous Alpha (B.1.1.7) surge compared with younger age groups
1. CDC. COVID-19 Risks and Vaccine Information for Older Adults. https://www.cdc.gov/aging/covid19/covid19-older-adults.html
Public Health Other Science
National Comparison Spread Severity
Response Indicators Round-up 41Comparing Vaccine Coverage and Case Rate Trends (Dec 19-Sept 17)
1000 Solid lines- case rates per million 100.0%
Dashed lines- vaccine coverage (%)
900 90.0%
800 80.0%
700 70.0%
600 60.0%
500 50.0%
400 40.0%
300 30.0%
200 20.0%
100 10.0%
0 0.0%
12/19 1/2 1/16 1/30 2/13 2/27 3/13 3/27 4/10 4/24 5/8 5/22 6/5 6/19 7/3 7/17 7/31 8/14 8/28 9/11
20-29 years 30-39 years 40-49 years 50-59 years 60-69 years 70-79 years 80+ years
• Michigan is experiencing another surge due to the Delta (B.1.617.2) variant
• COVID-19 vaccination increases with increasing age
• Risk of COVID-19 illness increases as age increases1, yet the older age groups in Michigan have had lower case rates during the Delta surge
and the previous Alpha (B.1.1.7) surge compared with younger age groups
Public Health Other Science
National Comparison Spread Severity
Response Indicators Round-up 42Science Round Up
Deeper look at trends: What happening in other states and what is projected for Michigan
• Average daily incidence per 100,000 cases in Michigan is currently lower than other Midwestern states experiencing a surge in delta cases
• Ridge regression model projects continued increases for cases and deaths in Michigan although case trends may be slowing
• CDC models project plateau or slowed increases in cases, hospitalizations, and deaths in Michigan
What do we know about COVID in children and schools
• Children can experience severe health outcomes from COVID-19 including MIS-C and Hospitalization
• In Michigan, hospitalizations for those 0-17 years are not at all-time highs but are increasing since July
• In Michigan, over 50% of children hospitalized have not reported underlying conditions
• Many of those who experience MIS-C in Michigan are admitted to intensive care, school age, and are Black/African American
• Cases in children are increasing and case rates are higher in counties where school districts without masking
What do we know about COVID-19 vaccine safety
• CDC V-SAFE Reports show 3rd dose side effects are comparable to 2nd dose
• Early data out of Israel show that myocarditis events remain rare after the third dose
Public Health Other Science
National Comparison Spread Severity
Response Indicators Round-up 43Deeper look at trends: What is
happening in other states and
COVID forecasts for Michigan
Public Health Other Science
National Comparison Spread Severity
Response Indicators Round-upCOVID-19 Case Rates: Midwest Comparison (Cumulative Cases per 100K)
• Average daily incidence per
100,000 cases in Michigan is
currently lower than other
Midwestern states experiencing
a surge in delta cases
• Currently, Michigan has
experienced 11.3K/100,000
cumulatively (~11%) while
national seroprevalence
suggests this is closer to 28%
Source: CDC COVID Data Tracker – State Trend Comparison
Public Health Other Science
National Comparison Spread Severity 45
Response Indicators Round-up 45Ridge regression
model projects
continued increases
for Michigan
• Model projects slowing increase in cases
and continued increase in deaths
• Uncertainty ranges for cases and deaths
include plateaus or continued increases
• Line is the ridge regression model projection, and
the shaded region represents the 95%
confidence region (2.5% and 97.5% quantiles).
• Projections are based on previous data on cases,
hospitalizations, and deaths, as well as data on
mobility and vaccinations.
• Cases are plotted by report date.
• For full projections and comparison to other Sources: Data from MDHHS/JHU,
Midwest states, see dataepi.org UM Ridge Regression ModelMichigan CDC model projections As of 20-Sep-2021
suggest plateau or slowed
increases in cases,
hospitalizations, and deaths
As of 20-Sep-2021
As of 20-Sep-2021
Data Sources: CDC mathematical model
forecasting, CovidComplete Data Center model
forecast evaluations. Individual models shown as
grey lines, ensemble shown in redInpatient census is
near spring peak
levels
• Cases and COVID+ census have
risen, though they are
currently lower than spring
peak COVID+ Patients
• However non-COVID care has
increased since the spring
surge
• Together, the overall inpatient Non-COVID Patients
census is near spring peak
levels (see horizontal line)
Data Sources: MDSS (case data as of 9/20/21), HHS Protect
(hospital admissions and inpatient census data through
9/19/2021). Note that COVID+ patient reporting is based on
fewer hospitals (~158 hospitals) than overall inpatient
census (~161 hospitals), so fraction of patients that are
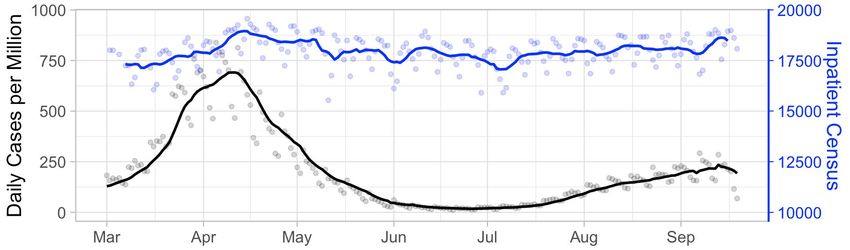
COVID+ may be an underestimate.Given the increase in
non-COVID care, how do
current cases translate Spring peak census levels
COVID+
to hospitalizations?
• Non-COVID census estimated based on
average census levels over the last 30
days
• Assumes constant steady state case
levels and hospitalization rate Non-COVID
• Translated case rate to inpatient census
based on the case hospitalization rate
and estimated length of stay over the
last 30 days
• Note spring peak census levels
occurred with lower non-COVID care
levels
Data Sources: MDSS (case data as of 9/20/21), HHS Protect
(hospital admissions and inpatient census data through
9/19/2021). Note that COVID+ patient reporting is based on
fewer hospitals (~158 hospitals) than overall inpatient
census (~161 hospitals), so fraction of patients that are
COVID+ may be an underestimate.What do we know about
COVID-19 impact on
Michigan children and
schools
Public Health Other Science
National Comparison Spread Severity
Response Indicators Round-upSARS-CoV-2 can Negatively Impact Children Directly and Indirectly
• Children can experience severe health outcomes from COVID-19 including MIS-C and Hospitalization
• Hospitalizations among children nationwide is trending down from all-time highs
• In Michigan, hospitalizations for those 0-17 years are not at all-time highs but are increasing since July
United States Hospital Admissions | 0 -17 years Michigan Hospital Admissions | 0 -17 years
Note: Gray bar indicates lag period where data may be updated
Sources: *CDC COVID Data Tracker > New Hospital Admissions; † COVIDNET
Public Health Other Science
National Comparison Spread Severity
Response Indicators Round-upSARS-CoV-2 can Negatively Impact Children Directly and Indirectly
• Children can experience severe health outcomes from COVID-19 including MIS-C and Hospitalization
• Nationally, nearly half of children hospitalized have no reported underlying conditions†
• In Michigan, 50% of children hospitalized have no reported underlying conditions
U.S. Pediatric Hospitalizations | Underlying Medical Conditions MI Pediatric Hospitalizations | Underlying Medical Conditions
Proportion of Medical Conditions Among Pediatric COVID-NET Cases (N=112)
100
80
50.0%
Percentage
46.4% 60
40
20
0
Sources: *CDC COVID Data Tracker > New Hospital Admissions; † COVIDNET
Public Health Other Science
National Comparison Spread Severity
Response Indicators Round-upSARS-CoV-2 can Negatively Impact Children Directly and Indirectly
Multisystem Inflammatory Syndrome in Children (MIS -C)
• Higher community transmissions is followed by higher incidence of MIS-C cases
• Many of those who experience MIS-C in Michigan are admitted to intensive care, school age, and are
Black/African American
Source: MDHHS and MIS-C Data and Reporting
Public Health Other Science
National Comparison Spread Severity
Response Indicators Round-upHow to Reduce SARS-CoV-2 Transmission in Schools
• An estimated 1,801 (1.5%) schools have
had closures attributed to SARS-CoV-2
between Aug 1 and Sep 17, 2021
• Counties without school mask policies
experienced larger increases in pediatric
COVID-19 case rates after the start of
school compared with counties that had
school mask requirements
• In Arizona, the adjusted odds of a school-
associated COVID-19 outbreak in schools
with no mask requirement were 3.5 times
higher than those in schools with an early
mask requirement
• CDC recommends universal indoor
masking in K–12 schools regardless of
community transmission levels, in addition
to other multicomponent prevention
strategies, including vaccination,
screening testing, and physical distancing
Sources : Jehn M., et al. Association Between K–12 School Mask Policies and School-Associated COVID-19 Outbreaks — Maricopa and Pima Counties, Arizona, July–August 2021. MMWR Morb Mortal Wkly Rep. ePub: 24 September
2021. DOI: http://dx.doi.org/10.15585/mmwr.mm7039e1; Parks SE, et al. COVID-19–Related School Closures and Learning Modality Changes — United States, August 1–September 17, 2021. MMWR Morb Mortal Wkly Rep. ePub: 24
September 2021. DOI: http://dx.doi.org/10.15585/mmwr.mm7039e2; Budzyn SE, et al. Pediatric COVID-19 Cases in Counties With and Without School Mask Requirements — United States, July 1–September 4, 2021. MMWR Morb Mortal
Wkly Rep. ePub: 24 September 2021. DOI: http://dx.doi.org/10.15585/mmwr.mm7039e3
Public Health Other Science
National Comparison Spread Severity
Response Indicators Round-upMI School Districts and Mask Policy as of Sept 27, 2021
Yes – Any masking policy in some subset of school grades
No – No mask policies (includes unknown)
NUMBER OF SCHOOL DISTRICTS NUMBER OF STUDENTS* IN SCHOOL
WITH MASK POLICIES IN K-12 DISTRICTS WITH MASK POLICIES
SETTINGS
No, 465151
Yes, 251
No, 282
Yes,
787657
• 47% (251/533) of K-12 school districts have mask policies
• School districts with mask policies cover 63% (787,657/1,252,808) of K-12 students*
• Not all K-12 grades or students may be covered by masks polices; examples include policies for those through K-6, or only during higher levels
of community transmission
* Student size based on school enrollment numbers; Buses and public transportation are federally required to enforce mask mandates
Source: Executive Office of Governor School District Mask Policy
Public Health Other Science
National Comparison Spread Severity
Response Indicators Round-upWhat do we know about
COVID-19 vaccine
safety
Public Health Other Science
National Comparison Spread Severity
Response Indicators Round-upFDA and CDC Advisory Committees:
3rd Dose Safety Data
CDC V-SAFE Reports show 3rd
dose side effects are
comparable to 2nd dose:
Israel national data shows myocarditis events are rare (1 case of myocarditis of 2,914,605
people, with no myocarditis under 30 years of age after 3rd dose)
Source: https://www.cdc.gov/vaccines/acip/meetings/downloads/slides-2021-09-22/07-COVID-Talbot-508.pdfAppendix
August 2, 2021
August 9, 2021
August 16, 2021
August 23, 2021
August 30, 2021
September 6, 2021
September 13, 2021
September 20, 2021
You can also read