MID-YEAR UPDATE - An Indepth Forecast Of The Year 2021 - James Investment
←
→
Page content transcription
If your browser does not render page correctly, please read the page content below

MID-YEAR UPDATE

An Indepth Forecast Of The Year 2021       jamesinvestment.com

Second Quarter Recap
Despite a slight decline in early June, the stock market continues to reach new highs in the face of rising
inflation and uncertainties about the Federal Reserve Bank (Fed) potential taper. During the second quarter
of 2021, the Russell 3000 Index*, a broad measure of the stock market, rose by 7.9% and reached an all-
time high on June 30, 2021. However, the market saw a market leadership rotation from small to large as
the large-cap Russell 1000 Index* outpaced the small-cap Russell 2000 Index* by almost 2.7%. In addition,
growth outperformed value during the quarter. This shift in style was more pronounced when looking at large
growth versus small value. The large growth gained almost twice as much as small-cap value, a reverse of
what happened in the first quarter.

The bond market rebounded during the second quarter as interest rates declined. The U.S. Aggregate Bond
Index* made 0.9% on a total-return basis in the second quarter after losing 3.4% during the first quarter.

Additionally, the shift was more pronounced in the long end of the curve as the 20+ Year U.S. Treasury Bond
Index* made 3.64% in the second quarter after losing 13.8% in the first quarter.

Both the equity and fixed income markets saw a sharp rise in volatility as the debate between the
“permanent” and “transitory” inflation camps have reached a crescendo. This is occurring with the publication
of the latest reading on the Consumer Price Index (CPI) and the Fed’s hawkish reaction in its June’s meeting.

The importance of this debate cannot be overstated because of the impact of inflation on financial assets
and the increasing dependency of financial markets on the Fed’s policy support. Rising inflation can cause
the Fed to raise interest rates in an effort to slow down the economy and keep even higher inflation at bay.

                                                                                                                2
The Inflation Debate:                                     Further, the sudden surge in consumer demand
Transitory or Permanent?                                  caused by the economic reopening is outstripping
                                                          supply, but according to the “transitory” inflation
The “transitory” inflation camp, championed by            camp, the supply bottlenecks are likely to ease in the
Fed Chairman Powell and Treasury Secretary                months ahead. In addition, this surge will lessen once
Yellen, argues current inflation is temporary and is      consumers have spent their stimulus checks.
essentially driven by a combination of base effects,
short-term demand-supply imbalances, and the              A negative output gap suggests the actual economic
negative domestic output gap.                             output is less than what the economy could produce
                                                          at full capacity. Historically, inflation pressures are
The base effect relates to the very low rate of           the highest when the economy is at full capacity. This
inflation during the pandemic period and its impact       has been especially true when the unemployment
on the current year-over-year (YOY) CPI index.            rate is very low. With over 7 million unemployed,
According to Powell, “…they’ll disappear over the         many believe we are not yet at full capacity.
following months. And they’ll be transitory. They
carry no implication for the rate of inflation in later   The labor market remains the most important
periods...”. In addition, inflation may not be as high    sector to watch as wage growth is a crucial driver
as it seems, if one compares current price levels to      of inflation. The recent sharp rise in wages for
the price levels two years ago to adjust for the base     low skilled workers is perhaps more an indication
effects as the chart below shows.                         of a skill mismatch typical of a post-recession
                                                          environment rather than the harbinger of a “wage-
                                                          price spiral” type of inflation.

                                                          The additional unemployment benefits may be
                                                          keeping some workers on the sidelines.

                                                          On the other hand, the surge in consumer spending,
                                                          rising commodity prices and other input costs,
                                                          trillions in government aid, decoupling from China,
                                                          and the rise of de-globalization in general, are all
                                                          arguments for a lasting spike in inflation.

                                                          So far, both bond and stock markets are buying
                                                          this transitory narrative. However, the outcome of
                                                          this debate is likely to guide the Fed’s future policy
                                                          responses.

3
Federal Reserve Policy Support                              The news was enough to rattle markets in mid-June.
                                                            However, the concern was short-lived and dissipated
Since the pandemic began in 2020, the stock market
                                                            within a few days. The market rebounded, and by the
has enjoyed a very accommodative Fed as it tried to
                                                            end of the month, it was back to setting new highs
provide support through these unprecedented times.
                                                            and ended the month on a solid note. Investors should
Trillions of dollars were pumped into the system as
                                                            see this as a sign the economic recovery is strong.
the Fed’s balance sheet expanded well above levels
                                                            Even Fed Chairman Powell said policy shifts in the
last seen during the financial crisis. However, it
                                                            future should be a sign of confidence the economy has
appears the support from the Fed may be waning, or
                                                            rebounded and is in a much better place.
at least they are talking about reducing support in the
future. The unexpected strength of the recovery over        Fortunately, we have seen a similar scenario before
the past year has been greater than almost                  in regards to “tapering” bond purchases. Back in May
anyone expected.                                            of 2013, the Fed hinted at tapering purchases as the
                                                            economy recovered from the financial crises of the
As a result, some Fed officials are expecting to raise
                                                            time. The news jolted the markets and stocks fell.
rates earlier than initially thought. The policy change
                                                            The good news for stock investors is the markets
is reflected in the revisions to the “dot plot” (Fed
                                                            ultimately brushed off the announcement and stock
officials’ rate expectations), which now hint at an
                                                            prices were much higher by the end of the year.
increase in 2022, one year earlier than they expected
                                                            However, tapering and tightening chatter introduce
just a few months ago. The other major news
                                                            short-term volatility in the stock market. The chart
centered on discussing “tapering” bond purchases,
                                                            below shows, over the last decade, each time the
which the Fed began during the crisis. Currently, the
                                                            Fed’s balance sheet stopped expanding U.S. stocks
Fed purchases $80 billion in U.S. Treasuries and $40
                                                            struggled in the short term.
billion in Agency Mortgage-Backed securities
every month.

The concern for investors is whether the Fed can
time this correctly. If they are too early, they could
stall the recovery. On the other hand, if the Fed is late
to the game and wrong on inflation, they could lose
confidence among investors while inflation
runs amok.

                                                                                                               4
A major tailwind for stocks has been the robust            How Long Will The Value/Cyclicals
economy with growth for the year on pace to be in          Rotation Last?
the range of 6-8%. The unemployment rate should
fall in the months ahead as additional unemployment        Thanks to rapid vaccine development and distribution
benefits end and people begin to fill the nearly 9         and the reopening of the economy, the value/cyclical
million job openings in the U.S. The Fed will likely       trades have enjoyed a phenomenal run for the last
remain supportive and keep short-term rates low as         6 to 9 months. However, these trades (notably in
the labor market recovers.                                 Energy, Financials, Industrials and Materials) are very
                                                           sensitive to future fluctuations in the business cycle.
However, the likely earlier announcement of any            In the early part of the economic cycle, they usually
tapering may happen in September and will probably         thrive as they were the hardest-hit sectors during the
involve mortgaged-backed securities to slow                recession. As one might expect, they typically bounce
down the booming housing market. The National              back the most as the economy enters the early stage
Association of Realtors just reported a 23.7% YOY          of economic recovery. So, the question now is: are
growth in the median price for existing homes and          we exiting the early part of the economic cycle and
one of the Fed Presidents warned that “you don’t           entering the mid-cycle yet?
want too much exuberance in the housing market.”
                                                           A typical business cycle has four distinct phases
In the coming months, we will need to monitor how          (Early, Mid, Late, and Recession).
inflation materializes. During the last Taper Tantrum
in 2013, we saw the 10-year U.S. Treasury yield rise       However, the COVID-19 recession is unique because
sharply between the announcement and the actual            of the complete shutdown of the economy. Therefore,
tapering. If history repeats itself, we could see rising   it is likely that some economic sectors are already
interest rates after a tapering announcement. As           transitioning into a mid-cycle while others are still in
such, we continue to suggest a duration slightly           the early phase.
below that of the benchmark level.                         The U.S. economy is delivering solid performance
With continued strength in the economy and stock           with the tailwinds provided by substantial pent-up
market, credit spreads on corporate bonds are tight.       consumer demand, supportive fiscal and monetary
There is little room for drastic improvement, yet we       policies, improving business confidence, favorable
would consider this sector a hold as we are too early      credit conditions, a reopening momentum and a
in the economic cycle to see concern for a rapid           potential infrastructure deal.
widening. We believe short-term corporates, senior         We believe this strong performance should continue
bank loans, and even floating rate securities may          in the rest of 2021, albeit at a more moderate pace.
prove beneficial and provide slightly higher income        Most economists expect a 13% YOY Gross Domestic
than Treasury securities.                                  Product (GDP) growth for the second quarter and
                                                           a 2021 growth rate of around 7%. Even though
                                                           the growth is slowing down from a staggering
                                                           13% number, a 7% rate is considered very high by
                                                           historical standards. This high rate of economic
                                                           growth should favor the value/cyclical trades.

5
The sharp bounce in corporate profits, strong balance
sheets, and still-low interest rates are favorable for
                                                          Risks To Our Outlook
the overall market. According to FactSet, S&P 500
earnings are expected to grow by more than 62%            What If Inflation Does Not Prove
from a year ago and slow down to 23% and 18%              Transitory?
growth in Q3 and Q4 2021. The 62% growth rate             Our view is the current high inflation is transitory, and
is not sustainable, but the 23% and 18% are still         we should come back to a more manageable core
substantial. These high earnings growth numbers are       CPI beginning next year as base effects fade away
also likely to favor value/cyclical trades.               and reopening-related bottlenecks ease. However,
                                                          there is a risk that higher than average inflation
These strong numbers and higher than expected
                                                          become more permanent. The Fed’s policy responses
inflation readings led the Fed to be more hawkish in
                                                          will have enormous consequences for the bond and
the recent June meeting as mentioned earlier. The
                                                          equity markets. Interest rates in the long end of the
week that followed saw several voting Fed members
                                                          curve are likely to rise and, by implications, volatility
delivering different views about monetary policies in
                                                          in the stock market.
the future. This growing Fed chatter about tapering is
likely to be a headwind for the value/cyclical trades
and a tailwind for large secular growth.                  Stretched Market Valuations
The economy is growing at a fast pace, which is a         Valuations are at extreme levels, not seen since the
plus for value/cyclical. However, a rising chorus for     dot-com bubble as indicated by the Shiller’s Cyclically
the Fed to taper is beneficial for large growth, making   Adjusted Price to Earnings (CAPE) ratio, which
diversification key.                                      currently stands at 38, and the Buffet Indicator of
                                                          total market cap to GDP of over 236%, which is 89%
Given the considerable impact the Fed’s action or         higher than the long-term trend line. Some argue
inaction has on the financial markets, the back and       that with historically low interest rates, valuation
forth change in leadership between large growth and       measures do not look as stretched.
cyclical/value trades during the last two quarters is
likely to continue as Fed officials take to
the airwaves.

                                                                                                                  6
Euphoric Sentiment Indicators                              If the Fed is late to the game and wrong on inflation,
                                                           they could lose confidence among investors, and
Speculators are betting the farm on stocks. We
                                                           inflation could hurt consumption and slow down
now have bullish positioning in the stock market
                                                           the recovery.
as seen from extreme leverage using margin debt
(money borrowed in brokerage accounts), fund flows
in leveraged exchange traded funds (ETFs), and             Rising Dollar
small speculators net positions in S&P 500 future          The U.S. dollar is technically in a bearish trend.
contracts. Additionally, Investors Intelligence advisor    However, since the Fed pivot during the June
sentiment of percentage of bulls minus bears is            meeting, it has rallied as a more hawkish Fed bodes
over 40%, which in the past marked danger zone for         well for U.S. interest rates going higher and attracting
stocks. However, as for valuation metrics, sentiments      more foreign inflows, especially as some foreign
indicators are historically not great sell timing tools,   developed interest rates are negative. If this trend
but they can exacerbate any selloff.                       continues, this is bearish for U.S. equities, especially
                                                           large-cap U.S. stocks, which derive 35% of their
Fed Policy Missteps & Increasing                           revenue from outside the U.S. Hence, a stronger
Federal Reserve Taper Chatter                              dollar typically hurts the currency exchange of their
                                                           foreign sales.
The concern for investors is whether the Fed can
time tapering bond purchases and rate liftoff
correctly and smoothly with minimum impacts on the
economy; avoiding a monetary policy error. If they
are too early, they could stall the economic recovery.

7
Conclusion
Overall, we believe we’ll see more volatility during the third quarter because the tug of war between the
“permanent” and “transitory” inflation camps will likely not be settled anytime soon. The uncertainty about the
long-term trajectory of inflation and the Fed policy response to it will continue to rattle the market. Will they
taper too soon and choke the recovery, or taper too late and lose market confidence on inflation?

The economy continues to expand, and most economic indicators are flashing green. Both consumers
and businesses have healthy balance sheets; corporate credit spreads are near historic lows, banks have
cleared stress tests and are paying hefty dividends and considering share buybacks again, and a bipartisan
infrastructure bill is in the works.

However, the recent meteoric rise in headline inflation, the recent Fed hawkish tone, and the potential Delta
variant of COVID-19 may spoil the party. In this environment, broad diversification across sizes and styles
relative to the market is critical. We believe the reflation trade will probably continue but at a slower pace, and
we still recommend being very selective by looking for value and quality stocks, without neglecting exposure to
secular growth areas.

                                                                                                                    8
For Investors:

    Equities
    ―Secular bull market trends should remain intact, with
     strong reopening momentum through the end of the
     year, a potential infrastructure bill and robust earnings
     growth and both consumers and businesses have
     healthy balance sheets
    ―Our opinion is to lower exposure on reflation rallies,
     but maintain a tilt to cyclical and economically
     sensitive sectors
    ―It is suggested to be very selective by looking for value
     and quality stocks, without neglecting exposure to
     secular growth areas as we transition to mid-cycle
    ―International markets may provide more diversification

    Fixed Income
    ―Continue to keep portfolio duration below the
     benchmark level, with the potential for another taper
     tantrum
    ―Credit spreads are historically tight, but don’t expect
     spreads to widen given where we are in the economic
     cycle
    ―Short-term corporates, senior bank loans and floating
     rate securities may prove beneficial and provide
     slightly higher income than treasury securities

    What Can Go Wrong
    ―Inflation not proven to be transitory
    ―The Fed forced to taper too soon or signal earlier
     rate hike than anticipated, which could choke the
     economic recovery
    ―Federal Reserve to taper its bond purchases and raise
     rates sooner than expected due to an unexpected rise
     in inflation
    ―The threat of the Covid-19 Delta variant harming the
     ongoing recovery
    ―Higher taxes and regulations
    ―Record high valuation and overly optimistic sentiment

9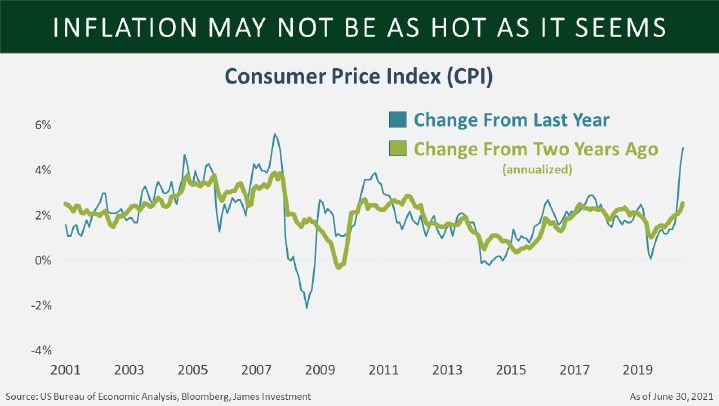
1-888-426-7640                             1-888-99-JAMES                              1-800-475-8618
  1-937-426-7640                                                                         1-937-429-7384

Disclosure
This information is of a general nature and does not constitute financial advice. It does not take into account your individual financial situation, objectives or needs, and
should not be relied upon as a substitute for financial or other professional advice to assess, among other things, whether any such information is appropriate for you
and/or applicable to your particular circumstances. In addition, this does not constitute an offer to sell, or the solicitation of an offer to buy, any financial product, service
or program. The information contained herein is based on public information we believe to be reliable, but its accuracy is not guaranteed.
Investing involves risks, including loss of principal. Past performance is no guarantee of future results.
ALPS Distributors, Inc. 1290 Broadway, Ste. 1000, Denver, CO 80203 (Member FINRA). ALPS is not affiliated with James Investment Research, Inc. or James Capital
Alliance, Inc.
Investors should consider the investment objectives, risks, and charges and expenses of the James Advantage Funds (the Funds) carefully
before investing; this and other information about the Funds is in the prospectus, which can be obtained by calling 1-800-99-JAMES. Read the
prospectus carefully before you invest.

Definitions
Reflation Trade: the name given to the belief that assets that benefit from a strengthening economy and a pickup in inflation will outperform safer and steadier
ones.
Large Cap: are defined as the group that account for the top 70% of the total market capitalization of the U.S. equity market.
Small Cap: are defined as the group that account for the bottom 10% of the total market capitalization of the U.S. equity market.
Growth Stock: A growth stock is any share in a company that is anticipated to grow at a rate significantly above the average growth for the market and have
typically higher valuation multiples than the market.
Value Stock: is a stock with a price that appears low relative to the company’s financial performance, as measured by such fundamentals as the company’s
revenue, dividends, yield, earnings and profit margins.
Consumer Price Index (CPI): Measures the average change in prices over time that consumers pay for a basket of goods and services.
Shiller’s Cyclically Adjusted Price to Earning (CAPE) ratio: a measurement that adjusts past company earnings by inflation to present a snapshot of stock market
affordability at a given point in time.
Buffet Indicator: a valuation multiple used to assess how expensive or cheap the aggregate stock market is at a given point in time.
Agency Mortgage-Backed securities: mortgage bonds which have underlying mortgages backed by Fannie Mae, Freddie Mac and Ginnie Mae.
10-year U.S. Treasury Yield: used as a proxy for mortgage rates. It’s also seen as a sign of investor sentiment about the economy.
Dot-com bubble: was a stock market bubble caused by excessive speculation of Internet-related companies in the late 1990s.
*Russell 1000 Index: The Russell 1000® Index measures the performance of the large-cap segment of the U.S. equity universe. It is a subset of the Russell 3000®
Index and includes approximately 1,000 of the largest securities based on a combination of their market cap and current index membership. The Russell 1000®
represents approximately 92% of the U.S. market.
*Russell 2000® Index: measures the performance of the small-cap segment of the U.S. equity universe. The Russell 2000® Index is a subset of the Russell 3000®
Index representing approximately 10% of the total market capitalization of that index. It includes approximately 2,000 of the smallest securities based on a
combination of their market cap and current index membership.
*Russell 3000 Index: The Russell 3000® Index measures the performance of the largest 3,000 US companies representing approximately 98% of the investable US
equity market.
*Russell 1000 Growth Index: measures the performance of the large- cap growth segment of the US equity universe. It includes those Russell 1000® companies
with higher price-to-book ratios and higher forecasted growth values.
*Russell 2000 Value Index: measures the performance of small-cap value segment of the U.S. equity universe. It includes those Russell 2000 companies with
lower price-to-book ratios and lower forecasted growth values.
*S&P 500 Index: S&P (Standard & Poor’s) 500 Index: a market-capitalization-weighted index of the 500 largest U.S. publicly traded companies.
*The Bloomberg Barclays U.S. Aggregate Bond Index: a broad base, market capitalization-weighted bond market index representing intermediate term
investment grade bonds traded in the United States.
*ICE U.S. Treasury 20+ Year Bond Index: part of a series of indices intended to the assess U.S. Treasury market.
*Indexes are not managed. One cannot invest directly in an index.
JAF000643 Exp. 12/31/2021

P.O. Box 8 Alpha OH 45301 | (888) 426-7640 | info@jamesinvestment.com
You can also read