Middlesex County Needs Assessment 2020 - December 15, 2020 Middlesex County Human Services Advisory Council - NJ.gov
←
→
Page content transcription
If your browser does not render page correctly, please read the page content below

Middlesex County
Needs Assessment
2020

December 15, 2020

Middlesex County Human Services Advisory Council
Authored by: Michael J. Davidson, MSW

                                             1
NEEDS ASSESSMENT

                   Table of Contents
                   PART 1
                   Executive Summary
                   Introduction
                   County Description
                   Needs Assessment Methodology

                   PART 2
                   Key Findings Across All Needs

                   Key Findings for Each Basic Need Area

                    •   Housing
                    •   Food
                    •   Health Care
                    •   Community Safety
                    •   Employment and Career Services
                    •   Child Care

                   PART 3
                   Key Findings for Specialized Service Need Areas

                    •   Services for Families Caring for a Child of a Relative
                    •   Behavioral/Mental Health Services for Children
                    •   Behavioral/Mental Health Services for Adults
                    •   Substance Use Disorder Services
                    •   Domestic Violence
                    •   Parenting Skills Services
                    •   Legal and Advisory Services

                                    2
PART 1

         3
Executive Summary
         Established by the New Jersey Department of Human Services (DHS) regulation and appointed
by the County Board of Commissioners, the Middlesex County Human Services Advisory Council
(HSAC) works closely with both State and County entities, making recommendations for the allocation
of funds, monitoring, and maintaining a large advocacy role on behalf of the needs and concerns of
the County residents. HSACs seek to facilitate and enhance the delivery of human services through
collaborative relationships across the county, as well as between counties and State agencies.
Comprised of Middlesex County Office of Human Services Staff and both community providers and
community members, the HSAC members strive to enhance the network of resources and supports
available to the residents of Middlesex County.
         The New Jersey Department of Children and Families (DCF) launched the 2020 DCF Needs
Assessment for Middlesex County in 2019. The Assessment was comprised of three phases of data
gathering (Survey, Focus Group, and Key Informant Interview) intended to understand the quality and
availability of services related to Basic Needs (Housing, Health Care) and Service Needs (Behavioral
and Mental Health Services for Children; Domestic Violence Services) within Middlesex County. DCF
partnered with the local HSAC in each county to deploy each of the data collection phases of the
Assessment and the creation of the Final Report to be delivered January 15th, 2021.
         Prior to the launch of the 2020 DCF Needs Assessment for Middlesex County, the global
COVID-19 virus pandemic occurred, causing major panic and necessitated lockdowns across the
nation. The pandemic generated a number of logistical problems for Middlesex County and the HSAC
to overcome at different phases of the Assessment process. The New Jersey Department of Health
(DOH) restrictions cancelled all in-person meetings and forced the County to cancel any attempts to
implement in-person surveys and focus groups. The HSAC was forced to re-create them in a virtual
format. The Middlesex County HSAC was able to utilize an HSAC community provider’s Survey
Monkey account to transfer the survey questions from a physical to a digital platform that was then
distributed to residents and providers in the community.
         Similarly, the Focus Group phase needed to be conducted in a virtual manner to adhere to the
social distancing guidelines from the CDC. Middlesex County utilized the Microsoft TEAMS platform
to conduct these virtual groups of community members which presented its own challenges that
needed to be overcome. Ensuring Focus Group members had proper technology to participate, the
ability to access the TEAMS platform, and that the group members had taken the survey prior to
participation were paramount to the success of the Assessment.
         Participation from the community was a major challenge during the 2020 Coronavirus
Pandemic. Simply put, community members were faced with evictions, lack of nutritional food, mass
layoffs and unemployment claims and other major issues that were prioritized over participating in
the Needs Assessment. 110 surveys were returned completed from the various community members
and providers and there were 35 participants across 13 different Focus Groups. During the final
phase of the Assessment, the HSAC conducted four Key Informant Interviews with individuals across a

                                                 4
diverse set of community experience. These interviews were also conducted using either a phone call
or Microsoft TEAMS.
         Future deployments of the DCF Needs Assessment should consider utilizing virtual methods
enabling participation by members of the community. Some community members may not have the
ability to travel to a location and would benefit from being able to participate through virtual means,
particularly for the Focus Group phase of the Assessment. Future Focus Groups would be enhanced
by including individuals who may not be able to travel but still want to be included and should be
offered a virtual option. For those economically and technologically challenged though, in person
focus groups and interviews should still be conducted. Middlesex County also has a particularly
diverse population, which often precipitate language translation needs. This also was problematic
due to the pandemic and the lack of free/ low cost translation services
         Similarly, the survey should also be available digitally to participants as an option. This
enables participation from residents who may not have the time to dedicate to completing the survey
in a single session. Overall, participants mentioned the length of the survey as being a barrier to
completing all the questions. Future surveys may benefit from shortening the number of questions
and content areas to reduce the time participants spent completing the survey. There was also
evidence of significant survey fatigue, which happens when the survey taker becomes apathetic,
bored or just tired of the survey process, this can result in the abandonment of the survey, ineffective
or inaccurate survey results. Significant Survey Fatigue was noted during the 2020 deployment of the
DCF Needs Assessment Survey. The further individuals worked through the survey; the more people
started to drop off (abandonment). Future surveys would benefit by rotating the content areas in the
survey to ensure that this drop off from survey participants does not occur only in the later content
areas.
         There were several key findings of note that were realized during the 2020 DCF Needs
Assessment. In many of the content areas, there were a significant number of participants who did
not know about the availability, quality or access to services in the county. This indicates that the
county and the network of providers need to do more to inform the community of the services being
offered. Increased marketing by the county through its website and social media outlets should be
expanded to increase awareness of services. Likewise, when asked about barriers to accessing
services in the county the most common barriers mentioned were Lack of Awareness of Services,
Transportation, Cultural Barriers, Waitlists, and Stigma. As Middlesex County is a very populated and
diverse county, it is important for service providers to take cultural differences and competency into
account when they are offering services. Many respondents also pointed to lack of transportation
as a major barrier to accessing services in the county.
         Finally, it is crucial to point out that during the 2020 DCF Needs Assessment the global
community faced the impacts of the COVID-19 Pandemic. This crisis not only made it increasingly
difficult to complete the Assessment, but it also has had a great impact on many of the content areas
observed during this process. The data observed in this assessment, while premature indicate that
issues in Housing, Food, Behavioral and Mental Health Services for both youth and adults, and
domestic violence services have increased. Experts have predicted a three to four-year period of
                                                         5
economic recovery before the nation reaches pre-pandemic levels, which will continue to adversely
effect those seeking services for a long time into the future.
        Moving forward, the HSAC of Middlesex County intends to distribute these findings to both
the County Commissioners, our larger HSAC membership, and community partners. In addition, the
findings will be shared with the Middlesex County Destination 2040 team to ensure that the
recommendations are included into the strategic planning process of the county. Similarly, the HSAC
of Middlesex County will also be reviewing the report and working to discern which issues or barriers
are able to be addressed at the county level, and those which are not. As one of the major barriers is
related to a lack of awareness of services available, the HSAC will be working with the Office of
Human Services of Middlesex County to create a new social media campaign related to the variety of
services available in the county and how to access them. Finally, the County Office of Human Services
and representatives of the HSAC will continue to support the work of Women Aware (The State
designated Domestic Violence Provider) and their efforts to develop and roll out their Family Justice
Center.

                                                  6
Introduction
Purpose
The N.J. Department of Children and Families is partnering with human services organizations in each
county to undertake an assessment of local strengths and needs. The goal of this assessment is to collect
the information needed to make sure the right mix of services and activities are available in every county
in New Jersey to support families. The findings from the needs assessment can be used to support the
development of local recommendations to assist with decision making; the identification of high priority
human service needs and barriers to service delivery for New Jersey’s communities; the coordination
and improvement of services to the Departments' target populations; the planning, funding,
coordination and implementation of Department Initiatives.

This statewide approach to county-specific needs assessments aligns with DCF’s existing county based
continuous quality improvement review cycle, in which each county is evaluated every two years. The
findings from the needs assessment will be embedded into the DCF’s existing ChildStat process and
shared with DCF staff and stakeholders during the county’s ChildStat session. ChildStat is a learning,
management, and accountability tool used by DCF to support continuous quality improvement, foster
a shared sense of accountability and promote system-wide problem solving around critical issues
affecting child and family outcomes. A ChildStat session incorporates analysis and interpretation of
administrative data to support planning and dialogue between DCF executive management and senior
leadership and system partners.

                                                   7
County Description
Narrative: In the Words of the County

Geography
        Middlesex County is geographically located in the center of the State of New Jersey.
Strategically situated between several major US cities (New York, Philadelphia, Boston, Washington
D.C), the county encompasses over 320 miles and is comprised of 25 municipalities. Consisting of
largely coastal lowlands, Middlesex County also features several major river systems (Raritan River,
Rahway River; South River) and several moderately sized bodies of waters (Farrington Lake, Carnegie
Lake).

Population
         In 2019, the United States Census Bureau estimated that the total population living within the
borders of Middlesex County was 825,062. The average population density is 2,578 individuals per
square mile, which is greater than both the State average (1,207.5/ sq. mi.) and National average (91.4/
sq. mi.) population density. The majority of the population of Middlesex County are between the ages
of 18 and 64 (62.88%). The percentage population below the age of 18 is the next largest group
(21.63%) followed closely behind by individuals older than 65 (15.50%). The median age of residents
living in Middlesex County in 2019 was estimated to be 39.3 years old. The five largest municipalities
(by population) per the 2011-2015 American Community Survey were Edison, Woodbridge, Old Bridge,
Piscataway and New Brunswick.

Ethnic/ Racial Demographics
        Middlesex County is one of the most widely diverse counties in New Jersey. The American
Community Survey (ACS), conducted in five-year intervals by the United States Census Bureau, showed
that between 2013 and 2017 the percentage of the population living in Middlesex County that identifies
as White, Non-Hispanic was trending down (by 3%), while the population that identifies as Asian was
trending up (by 2%). The population identifying as Black, American Indian or Alaskan Native, and
Hispanic trended roughly the same throughout the same time period. The population of foreign-born
individuals has trended upwards from 31% to 32.8%; and the population of the County who are foreign-
born individuals (32.8%) is higher than the state’s percentage of foreign-born individuals (22%).
        Largely English speaking, the population of the county that speak English only has been trending
down for the last five years and is currently 56.9%. Perth Amboy hosts the lowest population of
individuals speaking English only, while Milltown had the highest proportion of residents speaking
English only. The proportion of residents who speak English only in Middlesex County (56.95) is lower
than the states average of 69%.

                                                    8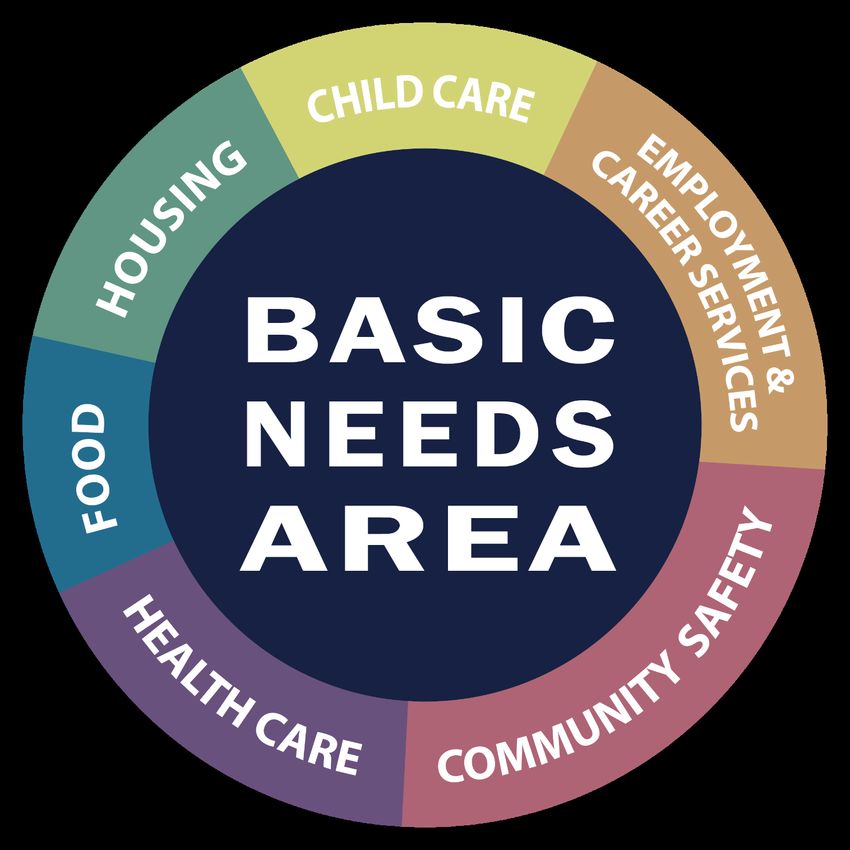
Income and Poverty Data
         Statistically, the median number is a more accurate depiction of the average income of
individuals due to the ability for very large or very small incomes skewing the average. In 2019, the
median household income (and benefits) in Middlesex County, New Jersey was $89,533 according to
the US Census Bureau ACS estimates. The average weekly wage has remained steady between 2016
and 2018 to around $1,262 per week. Median income for men ($65,990) was higher than for women
($52,699) between 2013 and 2017. It is important to note, that both men and women in Middlesex
County earn a median income that is higher than both the State and National median incomes. Also,
during the same time period, median incomes for women increased slightly (approximately $1,000)
while median income for men has remained the same. However, the median wage difference between
men and women in Middlesex County was still around $14,000.
         New Jersey is also one of the more highly taxed states in the nation. In the United States, the
average property tax rate is 1.19, while in New Jersey this rate is 2.19. Municipal tax rates in Middlesex
County are also significantly higher than the national average, and in the majority of municipalities,
twice as high as the state average. In several of the municipalities in the county, this rate is nearly
three times the state average, with the highest municipal tax rate belonging to the municipality of
Dunellen (12.17).
         Per the Economic Policy Institute, in 2018, the estimated monthly cost of living in Middlesex
County (for a two parent, two child family) was $8,495 for a “modest, yet adequate standard of living”.
Over 19% was attributed to childcare costs, 19% for Housing, 14% in taxes, 14% in transportation costs,
14% in health care costs, 12% in other necessities costs and 9% in food costs. According to the Policy
Institutes estimates, Middlesex County is the fifth most expensive county in New Jersey to live in with
a yearly cost of living estimate at $101,927 (for a two parent, two child family). The average household
size in the county of Middlesex is 2.84 people.
         Following similar dips and ebbs in the State rate of unemployment, the county’s unemployment
rate dropped from 3.9% to 2.6% between June 2018 and May 2019, consistently well below the State’s
unemployment rates during the same time period (4.4% to 3.0%). Middlesex County also has a slightly
lower percentage of households experiencing “severe cost burden” (spending 50% or more of the
income on housing costs) than the state average (17% vs. 19%). Rates of food insecurity in the county
has trended down between 2015 and 2017 (8.8% to 8.2%). Like the unemployment rates and the cost
burden percentages, the county (8.2%) is again below the State (9.6%) and National (12.5%)
percentages for food insecurity and ranks 7th in the state for lowest food insecurity percentage by
county.
         In Middlesex County, the Housing Continuum of Care Committee has worked with the county
non-profit corporation Coming Home to develop the Housing and Urban Development Point in Time
Homeless Count Survey every year. Between 2019 and 2020 the rates of sheltered families, homeless
children, and sheltered households (without kids) all increased, while the rates of unsheltered
individuals and chronically homeless households decreased. The rates of veteran (individual)

                                                     9
homelessness remained steady. The majority of the homeless surveyed reported their last permanent
address in New Brunswick and Perth Amboy. In 2020, for all homeless individuals, there was a
significant increase in households from “Out of County” for the second year in a row (28%, or 15
households). It is important to note that the direct focus of Coming Home and the Housing Continuum
of Care Committee has been on reducing the chronically homeless population, which they have been
able to do successfully by housing 66 chronically homeless households in 2017, 88 individuals in 2018,
and 132 individuals in 2019.
Economic Output
Middlesex County’s location, situated between four major United States Cities, provides for
excellent economic opportunities for entrepreneurs and business owners. The county boasts over
27,000 total businesses with over 360,000 total employees and has 5 Foreign Trade Zones. Several
sectors of business were trending upwards with employee growth seen in transportation and logistics,
health care practices, health care support, business and financial, and construction and extraction.
Education
Middlesex County has an excellent school system, consisting of nearly 200 schools across 25
districts. In fact, the county is home to many award-winning elementary schools and high schools. Per
the 2017 Middlesex County Needs Assessment, the national percentage of individuals obtaining a
bachelors or graduate degree (ages 25+) was 29.8% (in 2015), while the NJ state percentage of the
population with a bachelors or graduate degree was 36.8%. However, in Middlesex County the
percentage of the population with a bachelors or graduate degree was 41% indicating the county is
successful in attracting highly educated individuals. Similarly, the population percentage of people
living in county with a high school diploma or GED (88.8%) is higher than the state (88.6%) and national
averages (86.7%). This higher level of academic and educational achievement may be bolstered by the
fact that a top 100 ranked university (Rutgers University) and three nationally ranked and named
National Blue Ribbon (US Department of Education Award) vocational/ technical schools and career
academies are located within its borders.
Needs Assessment Methodology
10Quantitative and qualitative data from various sources and stakeholders related to housing, food,
health care, community safety, employment and career services, child care, services for families caring
for a child of a relative, behavioral/mental health services for children, behavioral/mental health
services for adults, substance use disorder services, domestic violence services, parenting skills
services, and legal and advocacy services were collected to inform this needs assessment.
County Data Profile
DCF provided a county data profile to the County Human Service Advisory Council (HSAC) to support
the HSAC in identifying key topics to be explored in more depth. The data profile consists of the most
recently available administrative data related to demographic population and selected indicators of
poverty, housing, food security, childcare, health care, transportation, employment, community safety,
mental health and substance use. The sources for the data included in the profile include a combination
of federal databases. The primary purpose of the county data profiles is to support the HSAC needs
assessment team in identifying key areas to prioritize during the focus group data collection efforts.
Approach for Prioritizing Needs
In November of 2019, the State Department of Children and Families provided the Middlesex County
Office of Human Services with a county-specific data profile related to the 2020 County Needs
Assessment. This data profile was compiled by Rutgers University School of Social work and utilized
data sets from a variety of sources, reports and surveys dating between 2013 and 2019. Included within
the “profile of Family and Community Indicators” was the county ranking when compared to the other
20 counties in the state. The Middlesex County Human Services Advisory Council reviewed the
provided county profile for trends that matched similar issues that were the focus of prior needs
assessments.
The county profile showed a comparison between Middlesex County and the other 20 counties
within the state of New Jersey among a variety of both Basic Needs (food, clothing, shelter) and Service
Needs (domestic violence, mental health). This comparison showed several needs areas that the
county was ranked lower than the other counties in the state. It is important to note that several of
these needs areas contained within the Rutgers School of Social Work Data Profile did not directly
translate into the Basic Needs or Service Needs areas. This allowed for a little bit of flexibility when
choosing which needs to prioritize and enabled the Middlesex County Office of Human Services to
combine two or more areas of need together.
These needs areas provided by Rutgers were brought to the Human Services Advisory Council
Executive Committee and were presented to gauge interest in specific needs areas. Within the data
profile provided, it was shown that Middlesex County had low numbers of NJ Family Care participation,
low numbers of children under 18 with health insurance, and high rates of reports of lack of or late
prenatal care. This indicated that the first basic need that should be prioritized was Health Care.
Similarly, the profile showed the County had higher rates of household income being spent on housing
and a larger average travel time to work, demonstrating that the second basic need to prioritize was
Housing. Similarly, the data profile showed that Middlesex County had low numbers of reported
11domestic violence incidents to law enforcement and low numbers of children receiving special
educational services and children receiving early intervention services. These indicated that the County
should prioritize Domestic Violence Services and Behavioral and Mental Health Services for Children.
After receiving the confirmation from the Middlesex County HSAC, the four prioritized needs
areas and the data profile were discussed with Office of Human Services Leadership. It was agreed that
the four prioritized needs areas should be: Housing, Health Care, Behavioral and Mental Health Services
for Children, and Domestic Violence Services.
The four need areas selected by the county to be the focus areas and primary topics in the qualitative
data (e.g. focus groups and key informant interviews) collection included:
1. Housing
2. Health Care
3. Behavioral and Mental Health Services for Children
4. Domestic Violence Services
Focus Groups
In an effort to implement a uniform needs assessment approach across counties to support statewide
trend analysis, DCF required HSACs to conduct a series of focus groups. The purpose of the focus groups
was to collect qualitative information to better understand the scope, nature and local context related
to addressing community needs that influence families.
Focus groups sessions were scheduled for approximately one and half hours with the first thirty
minutes being designated for introductions and survey completion and the remaining hour being
designated for the focus group dialogue. In each focus group session, participants were asked to
complete a standard survey to gather data about the key topic areas outlined in the aforementioned
data profiles. The survey was developed to identify areas of strength and areas in need of improvement
related to county-based supports and service array. The survey consists of demographic data and
approximately 10 questions related to each of the eleven basic and service needs. Six of the questions
are based on a five-point Likert scale ranging from Strongly Disagree to Strongly Agree.
Upon completion of the surveys, the focus group participants were asked to transition into the dialogue
component of the session. The dialogue requirement was intended to allow participants to highlight
their experiences and perceptions as community members and provide opportunity for a deeper
discussion and assessment of top barriers in each area of need. Group members discussed two selected
basic and service need priority areas. Facilitators use a structured protocol to explain the purpose,
goals, confidentiality, and informed consent and objectives of the focus group.
12Recruitment.
Focus Group Recruitment
Due to the nature of the unprecedented global Pandemic causes by the COVID-19 virus, many
aspects of this assessment were changed to adapt to in-person restrictions placed upon the State of
New Jersey. The COVID-19 virus also negatively impacted participation in all phases of the Needs
Assessment, but particularly in the Focus Group phase. As a result of these challenges, the Middlesex
County HSAC decided to include two extra questions in the beginning of the online survey. The first
question dealt with participant consent for both the survey and the future focus group. Participants
provided a digital signature to confirm their consent to use their survey answers and for participation
in the focus group phase. The second question asked participants to provide an email address that
would be used to invite them to the next phase (focus group) of the Needs Assessment.
Every week from the deployment of the Needs Assessment survey, the Middlesex County Office
of Human Services pulled the list of new email addresses. These email addresses were then added to
a master list of completed surveys and potential focus group participants. The HSAC then scheduled
the ten, distinct, focus groups throughout the end of October and beginning of November 2020. Once
a list of the dates and times were compiled along with the Microsoft TEAMS links for each meeting, the
email list was sent a welcome email. The email detailed the next steps in the assessment and invited
the survey participants to RSVP for their specific group’s focus group date. It was soon evident that
scheduling a single date for a specific group of potentially up to ten people would be difficult, if not
impossible.
To alleviate some of the difficulty with scheduling the focus groups, the HSAC decided to open
the focus group dates for any participant to pick from. Very quickly responses came in RSVPing for the
dates and times that fit their individual schedules. It seemed that opening these dates up for anyone
to pick from did two things that increased the success of participation: (1) allowed flexibility for
participants’ schedules (encouraging more participation), and (2) increased diversity of participation in
the focus groups (provided for more and better conversations on the topics). As more surveys were
completed, participant’s emails were continued to be added to the master list and requests for RSVPs
continued to go out.
Focus Group Participants. A total of 13 focus groups were conducted in this county as part of this needs
assessment. These focus groups were conducted from October 27, 2020 to December 7, 2020. There
was a total number of 35 participants. The number of participants in each focus group ranged from a
minimum of one and a maximum of six participants. Each focus group participant was required to
complete the survey prior to participation
Key Informant Interviews
Key informant interviews were conducted to gather additional feedback from County Human Services
Directors and other identified individual selected by the HSACs regarding considerations for addressing
13the needs and concerns that were highlighted in the data profiles and focus group sessions. Facilitators
use a structured protocol to explain the purpose, goals and objectives of the focus group.
Recruitment.
Key Informant Recruitment
The Key Informant recruitment process was conducted in a similar fashion as the Focus Group
recruitment. The Human Services Advisory Council Executive Committee met and discussed the
requirements and needs for this phase of the assessment. It was determined that there would be six
individuals targeted in the community as the Key Informants, all representing different areas of the
assessment, specifically: Housing, Behavioral and Mental Health for Children, and overall county
knowledge. The HSAC did intend to try and obtain key informants for all four prioritized needs areas;
however, time constraints, participation, and communication all inhibited the ability to do so.
Of the six individuals who were invited to participate, four agreed, RSVP’d, and then showed up
on the date and at the time of the interview. Each interview was conducted in a one-on-one format
with individuals from the HSAC leadership or Office of Human Services county staff. Two of the
individuals who acted as key informants worked within the county OHS leadership, while the remaining
two worked in local Not-For-Profits as executive leadership.
Key Informant Interview Participants. A total of Four interviews were conducted in this County as part
of this Needs Assessment. The total number of participants included was four. These interviews were
conducted from December 1, 2020 to December 11, 2020. There was a total of four surveys completed
during the interview sessions.
Participant Demographics
As described in the above sections, both focus group and interview participants completed the needs
assessment survey. Below we combine information for all participants to provide an overview of the
participant demographics.
Number of
Role in the Community (not mutually exclusive) Participants
County Resident 42
Staff or Volunteer with a Community-Based Organization (e.g., Health and 48
Human Services providers, Planning Board Participants)
Staff or Volunteer with a Public Service Organization (e.g., paramedics, fire 5
fighter, police officers, military, judges)
Local Business Owner in the County 1
Community leader and advocate in the county (e.g., hold a volunteer office, 7
clergy, activist)
Other 4
14Number of
Age Participants
Under 18 2
18-24 4
25-34 21
35-44 22
45-54 17
55-64 27
65 and over 13
Number of
Gender Participants
Female 82
Male 21
Non-binary, third gender/transgender 0
Prefer Not to Say 2
Other 0
Number of
Race Participants
American Indian or Alaska Native 0
Asian 2
Black or African-American 21
Native Hawaiian or Other Pacific Islander 0
White or Caucasian 71
Multi-Race (2 or More of the Previous) 6
Other 6
Number of
Ethnicity Participants
Hispanic, Latino or Spanish Origins 25
No Hispanic Latino or Spanish Origins 64
Not Applicable 17
15Number of
Education Level Participants
Grades Preschool-8 0
Grades 9-12-Non-Graduate 4
High School Graduate or GED 4
High School/GED and Some College/Trade 6
2 or 4-Year College/Trade School Graduate 30
Graduate or Other Post-Secondary School 63
Number of
Employment Status Participants
Employed: Full-Time 84
Employed: Part-Time 6
Unemployed-Looking for Work 4
Unemployed-Not Looking for Work 1
Retired 10
Student 0
Self Employed 0
Unable to Work 1
Number of
Years of Community membership Participants Range
How many years have you been a member of this community? 110 >1 - 30+
Number of
Services Accessed by a Household Member within the last 2 Years Participants
Yes 23
No 82
Household Member History of Involvement with NJ Division of Child Protection Number of
and Permanency Participants
Yes 10
No 95
Participants represented the following municipalities
Branchburg, Carteret, Chatham, Dayton, Denville, Dunellen, East Brunswick, East Windsor, Edison,
Elizabeth, Helmetta, Highland Park, Joint Base MDL, Linden, Long Branch, Manville, Metuchen,
Middlesex, Millstone, Milltown, Monroe, New Brunswick, North Brunswick, Oceanport, Old Bridge,
Perth Amboy, Piscataway, Princeton, Rahway, Scotch Plains, Somerset, South Brunswick, South
Plainfield, South River, Spotswood, Union, Woodridge
16Additional Data Collection Methodologies
The Human Services Advisory Council has endeavored to provide as complete a picture of
Middlesex County as possible. This included not only the Survey data, Focus Groups, Key Informants
and the Rutgers Profile, but also utilized outside data that had been previously collected. Available to
anyone with a computer and internet access, these extra and outside sources of information enabled
the HSAC to paint a picture of the County in as many colors and textures as possible. This context can
sometimes provide more in-depth details on things like the scope and nature of the need, but also
provide longitudinal data that can determine the duration of the need or the barriers to obtaining help
with those needs.
One of the first data sets that the HSAC looked at was the 2017 Middlesex County Needs
Assessment that was commissioned by the two Middlesex County Community Action Program (CAP)
agencies, Jewish Renaissance Foundation (JRF) and Puerto Rican Action Board (PRAB), and done in
partnership with the Middlesex County OHS, United Way of Central Jersey, and WellCare Health Plans.
The information obtained in this assessment provided crucial data on all the content areas contained
within the Department of Children and Family’s Needs Assessment but dated as far back as 2012. The
assessment also contained recommendations that directly related to Housing and Health Care (the two
Basic Needs that were prioritized).
Several additional sets of data were obtained directly from the United States Census Bureau
website. Every year the Census Bureau collects social, economic, housing and population data that is
provided to states and counties in two waves per year. The HSAC of Middlesex County used this data
to provide 2019 Census Bureau estimates on population size and demographics, while also using the
2013-2017 5-year data set to demonstrate longitudinal trends in barriers and needs across content
areas. Similarly, the 2017 Middlesex County Needs Assessment also included Census Bureau data.
Another additional data source that the HSAC chose to use was the Middlesex County Point in
Time report for 2019. Federally mandated, the County is required to produce yearly data related to
homelessness in the County and report this data to the U.S. Department of Housing and Urban
Development (HUD). In partnership with the County Housing Continuum of Care Committee and
Coming Home of Middlesex County, this data is useful in depicting the homeless situation in the County
and the longitudinal steps in reducing these numbers.
Obtained through the County Office of Workforce Development, the 2018 Workforce
Development Board (WFDB) Annual Report provided crucial information related to programs and
providers who offer job and skills training, navigation support, and career assistance for individuals
located within the county. Similarly, the County Health Needs Assessment from 2019 was obtained
and utilized to provide information related to the health care provider networks and data on health
care needs and barriers. Further, information on the County Health Rankings for 2019 was obtained
through the County Health Rankings website.
Finally, the Advocates for the Children of New Jersey (ACNJ) produces a Kids Count Report that
is available on a state-by-state effort, founded by the Annie E. Casey Foundation. Focused primarily on
17children throughout the state, the Kids Count report provides information on child well-being on the
county and state levels. Data sets include information on child and family economics, child health and
protection, early care, education and more.
18PART 2
19Key Findings Across Needs
Several noticeable trends were observed during the review of the 2020 DCF Needs Assessment
for Middlesex County data. Most respondents felt that there were not enough services available across
the basic and service needs areas. Similarly, across nearly all needs areas targeted in the survey,
participants did not agree that services were available to those who need, nor were these services
widely known and advertised by the County. This trend indicates that the County and the service
providers need to try and reach more of the residents in the county with the information regarding
these services, while also working to develop a larger quantity of these services. It may also indicate
that there are increasing needs related to these services due to population changes, the current COVID-
19 Pandemic, and other societal differences. Interestingly, there was a different response to questions
regarding the quality of the staff and facilities providing these services in the county. Most respondents
agreed that the basic need areas took demographic factors into account when delivering services.
When asked about service need areas, most respondents did not know if they took demographic
factors into account when delivering services. Similarly, there was more of a spread among
respondents when asked about the quality of the facility and the skill and knowledge base of the staff.
Overall, most respondents agreed that the quality of the staff and the facilities were good, however
there were several content areas (Parenting Skills Services, Families Caring for a Child of a Relative)
where the majority did not know about the quality of these services. These results may indicate a need
for a review of the services being offered, particularly through the lenses of racial and ethnic equity.
An analysis of the barriers selected by the respondents to the 2020 DCF Needs Assessment showed
similar trends noted during prior assessments. Unsurprisingly, Transportation and Lack of Awareness
of Services were the top two-barriers chosen by participants. In most of the assessments and reports
that were reviewed for this report, transportation was referenced frequently as a major barrier to
accessing services. In some cases, respondents stated that transportation access is not the same across
the county, with more rural areas having less access to mass transportation. Many respondents
suggested that the County encourage reinvestment into mass transportation to expand into these
transportation deserts, while others suggested tying transportation funding to social service programs.
Other top barriers mentioned by respondents were Cultural Barriers, Stigma Leads to Avoidance,
Financial Cost, and Waitlists. During the Focus Groups and Key Informant Interviews, participants were
asked to consider the impact of these barriers on subpopulations living in the county. Many
respondents believed that individuals with disabilities living in the county are impacted by these
barriers at a greater rate than others. The biggest barrier facing this subgroup was transportation, as
individuals with physical disabilities often deal with transportation companies and services that are
frequently late and of poor quality. Similarly, many respondents believed that there were significant
disparities among racial and ethnic breakdowns on service delivery and access. These responses
suggest that a deeper examination of the services available in the County and how people access them,
specifically through a racial and ethnic equity lenses. Participants were asked if there were any steps
that the County could take to address one or more of these barriers to service. Many suggested utilizing
20social media and other platforms to discuss the issues presented in many of the different needs areas.
This could reduce the lack of awareness of these services, while also humanizing them, potentially
reducing the stigma that is observed. Another suggestion was to increase the transportation shuttle
system to assist with employment travel. Many employees face tremendous costs associated with
travel to and from their place of employment. Expanding the County shuttle system could generate
revenue for the County while also reducing the overhead faced by County residents. Finally, many
participants suggested deepening ties to the various agencies and departments that provide services
within the County. Encouraging providers to get into the community to educate their potential clients
on the services offered and who is eligible, while also continuing to develop a resource guide for the
County.
21Basic Need Areas
22Need Area: Housing Status: Prioritized Need Area
Housing includes the availability of affordable, stable, permanent and acceptable living
accommodations. This need area seeks to assess the sufficiency of housing in the County and the
degree to which residents are homeless or threatened with eviction, as well as the existence of
community supports (e.g., subsidy, vouchers, etc.) and services aimed at ensuring housing for all (e.g.,
Homelessness Prevention Program, Housing Resource Center, community shelters, County Board of
Social Services, Section 8, affordable housing, housing authorities, etc.)
In Middlesex County , 17 percent of households experienced severe cost burden (50% of income or
more is spent on housing) for housing in 2017. This percentage is less than the percentage for the state
of New Jersey (American Community Survey; see County Data Profile for Additional Source
Information). In 2019 the latest year of data made available in the county profile packet, 20 percent of
households experienced at least one of four severe housing problems: 1.) overcrowding determined
by high person-per-room, persons-per-bedroom, or unit square footage-per-person; 2) severe cost
burden, 3) lack of kitchen facilities, or 4) lack of plumbing facilities (Comprehensive Housing
Affordability Strategy; data compiled by HUD; see Data Profile for Additional Source Information).
Need Assessment Key Findings
Summary: Scope of the Need
Housing has been a source of continued consternation among the residents in Middlesex
County. Per the survey portion of the 2020 DCF Needs Assessment, over 80% of participants within
stated Housing was the first basic need that should be addressed. While one of the wealthier New
Jersey counties in both income and employment, the continued high housing costs within Middlesex
are still straining individual’s and households’ budgets. Many renters and owners together are feeling
the squeeze of higher property and municipal taxes across the county.
Each year the Middlesex County Continuum of Care Committee (MCHC3), Coming Home of
Middlesex County, and several of the local homeless service providers conduct the Point In Time (PIT)
Count of the homeless, which is federally mandated by the US Department of Housing and Urban
Development (HUD). The snapshot provided by the PIT count can enable local providers and
government agencies to plan for future programming and apply for state and federal grants. In 2019,
the PIT Count showed there were 666 individuals (456 households) that reported being homeless, with
the largest number of respondents stating their last permanent address was located in New Brunswick.
245 were sheltered without children, 103 were sheltered with children (300 individuals) and 99 were
unsheltered households (101 individuals). 74% of the homeless individuals responding to the PIT self-
reported as Male. The Ethnic and Racial breakdown of homeless individuals showed that a large racial
disparity in homelessness. While the Black population in the County represents just 10% of the
population, they disproportionately make up 42% of the homeless population. Similarly, the Latinx
23population in the county represents 22% of the total County population and 31% of the homeless
population.
There are robust community supports within the County related to housing. The MCHC3
coordinates with many local providers, not-for-profits and for-profit developers to work on reducing
the numbers of homeless here. There are currently over 2,200 HUD funded Housing Choice Vouchers
(aka section 8 vouchers) in use within the County and administered through housing authorities in
Carteret, Edison, Highland Park, New Brunswick, Old Bridge, Perth Amboy, Sayreville, South Amboy and
Woodbridge, as well as the County’s Division of Housing located in New Brunswick. There is a Rotating
Shelter for single women and families that is operated through the FISH Hospitality Program, as well as
the Ozanam Men’s and Family Shelter’s run by Catholic Charities, Diocese of Metuchen. There are
several homeless prevention programs that are operated in the County that provide financial
assistance with rental arrears, security deposits and temporary rental assistance for persons at
imminent risk of homelessness. There are also Rapid Re-Housing programs that provide the same type
of financial assistance to individuals and households that are currently homeless. Many providers,
including MIPH Mission First Housing Group, Catholic Charities, and Triple C Housing provide
Permanent Supportive Housing for households that were formerly homeless. The Middlesex County
Board of Social Services also operates a temporary hotel/ motel placement program for residents that
qualify until more appropriate housing is found.
Summary: Nature of the Need
There is a total of 303,457 housing units in Middlesex County per the US Census Bureau. Of
these units, 285,906 (94.2%) are occupied, while just 17,551 (5.8%) of units are vacant. Over 63% of
these units are “Owner Occupied” (181,453), while 36.5% are considered “Renter Occupied” (104,453).
Average household size is not that different from owner occupied to renter occupied (2.86; 2.70
respectively). 95.8% of all units have an average occupants per room of 1.0 or less. 42.7% of all units
in the County are two bedrooms or less, while 55.9% are three bedrooms or more, representing a good
diversity in the unit size’s available to individuals and families. One particularly concerning housing
need in the Middlesex County is the lack of units available for large families (six or more members),
especially for those with federal housing authority vouchers which have occupancy limits attached to
them (ex: two same-sex children per bedroom)
The median housing unit cost in Middlesex is 359,000 USD, while over 90% of housing units in
the County cost more than 200,000 USD. These high costs to purchase a home (or rent) translates into
hardships for individuals and families located here. 61% of housing units with a mortgage pay more
than 20% of their household income on their housing costs. Of those units without a mortgage, 34.8%
pay more than 20% of their household income on housing costs. Median rent in the county is 1,527
USD per month with the 2-bedroom fair market rent rate being 1,770 USD per month. 72.3% of renters
living in Middlesex County pay more than 20% of their household income on housing costs. 38.8%
spend 35% or more of their household income on housing costs.
Of all the housing units available within the County, the vast majority of them are older than 30
years old. 75.5% of units are 30+ years old, with almost half of all available housing units being 50+
24years old (47.8%). Conversely, the percentage of housing units less than 30 years of age was 24%.
More than 80% of housing units are heated using utility gas (Ex. PSE&G), 12.7% are heated using
electric, and just over 4% use fuel oil, kerosene etc.
When asked about housing services within the County, respondents predominantly disagreed
(68%) that there were enough housing services available in the County disagreed (57%) that anyone
was able to access these housing services; and disagreed (62%) that housing services are widely
advertised and known in the County. When asked about race, ethnicity and gender, there was a bit
more of a diversity in opinion: 25% disagreed or strongly disagreed that services take race, age, gender,
ethnicity and more into account when delivering housing services; while over 37% stated that they did
agree or strongly agreed. Just under half of respondents (43%) stated they agreed that facilities
providing housing services were of good quality, while over 60% stated they agreed that the housing
services staff were knowledgeable and provide good customer service. The top three barriers
mentioned by respondents to the survey were (in order): Waitlists, Transportation and Lack of
Awareness of Services.
Summary: Local Considerations for Addressing the Need for County Prioritized Need Area
Focus group members mentioned individuals looking for help related to housing would reach
out to family, friends, and co-workers or use word of mouth to obtain shelter. This could mean
doubling up in a relatives’ home, couch surfing with a friend, or literally getting recommendations on
where to go for help. Similarly, many of the focus group members suggested individuals reach out to
2-1-1, the state’s homeless hotline for placement and coordinated assessments. Other common
suggestions were reaching out to faith-based communities, the Board of Social Services, and the County
Housing Division.
There were several common barriers that consistently came up during the focus group
meetings. Transportation came up frequently as a barrier to getting to housing opportunities. Many
respondents stated housing options and transportation to and from these locations can be tenuous.
The variety of services available was also a common barrier mentioned, as many people may find it
difficult to navigate the complex system. Stigma against asking for help and waitlists were also
common barriers mentioned during these focus groups. Another common stigma was on the behalf of
the landlords who might not be willing to accept voucher clients into their rentals.
There was a plethora of responses to what the County might be able to do to address some or
all of these barriers. One suggestion was to work with municipalities to develop more subsidized and
affordable housing units. In the State, municipalities operate under “Home Rule”, making it difficult
for the County to enforce affordable housing mandates and rulings. Participants suggested developing
an educational campaign on affordable housing and try to dispel the myths surrounding it. Another
notable suggestion was to think more outside of the box with delivering information to the community
on housing projects. Many residents still use traditional means of information dissemination (Print
Media, Radio, TV) and it is crucial that information be provided in as many methods as possible, not
just contemporary methods. Finally, participants suggested instituting a rental cap to restrain rental
pricing and to keep them affordable for the majority of the renting population in the County.
25If applicable: Additional Notable Focus Group Trends for County Prioritized Need Area
26Need Area: Survey Results
Item Total Strongly Disagree Agree Strongly Don’t Total
Number of Disagree Agree Know
Respondents
1. There are enough services 102 28.43 % 40.20 % 14.72 % 3.92 % 12.75 % 100 %
available in the county to help those
who have this need.
2. Anyone in the county is able to 102 15.64 % 42.16 % 25.49 % 4.90 % 11.76 % 100 %
access services.
3. Services are widely advertised and 102 22.55 % 40.20 % 24.51 % 4.90 % 7.84 % 100 %
known by the county.
4. Services take race, age, gender, 102 4.90 % 21.57 % 37.25 % 5.88 % 30.39 % 100 %
ethnicity and more into account.
5. Facilities that provide service to 102 5.88 % 14.71 % 43.14 % 8.82 % 27.45 % 100 %
meet this need are of good quality
(e.g., clean, well-supplied).
6. Staff are well-trained, 102 4.90 % 7.84 % 43.14 % 14.71 % 29.41 % 100 %
knowledgeable and provide good
customer service.
Key Barriers
Barrier Total Number of Number of Times Percentage
Respondents Identified of Responses
Wait Lists 102 74 72.55
Services do not exist 102 33 32.35
Transportation 102 72 70.59
Cannot contact the service provider 102 25 24.51
Too expensive 102 35 34.31
Lack of awareness of service 102 63 61.76
Cultural Barriers 102 45 44.12
Services provided are one-size fits all, and don’t meet 102 30 29.41
individual needs
Stigma Leads to Avoidance 102 47 46.08
Eligibility Requirement (explain below) 102 36 35.29
Other (explain below) 102 9 8.82
27Need Area: Food Status: General Need Area
Food security is the availability and ability to acquire nutritionally adequate and safe foods. This area
of need seeks to assess the level to which residents throughout the county have adequate food and
the existence of community services and supports to address unmet food needs (e.g., food banks, soup
kitchen, local pantry, community-based organization, Supplemental Nutrition Assistance Program
(SNAP), food stamps, Women, Infants, Children (WIC) Supplemental Nutrition Program, etc.)
In Middlesex County , the food insecurity rate for households was approximately 8.2 percent in 2017,
the most recent date of available data (U.S. Census Bureau Current Population Survey and U.S.
Department of Agriculture Economic Research Service; see County Data Profile for Additional Source
Information). This percentage is less than the percentage rate for New Jersey.
Need Assessment Key Findings
Summary: Scope of the Need
Per the Rutgers University County Profile provided to the county prior to the start of the Needs
Assessment, the estimated (2018) cost of food for a family of four (two adults, two children) was $764
per month. The county has a lower rate of households experiencing severe cost burden (17%) and a
lower percentage of families with children under 18 living in poverty (9%) than the state rates (19%;
12%). Similarly, between 2015 and 2017 the rates of food insecurity in the county has trended down
from 8.8% to 8.2%. This is consistently lower than the state rate between the same time period (10.8%
- 9.6%) and much lower than the national rate between the same time period (13.4% - 12.5%). 43% of
survey respondents to the 2020 DCF Needs Assessment for Middlesex County identified Food as the
first basic need that should be addressed in the county.
Per the United States Census Bureau 2019 ACS 1-Year Estimate, in 2019 there were 285,906
total households, 18,485 of which were receiving Food Stamps/ Supplemental Nutrition Assistance
Program (SNAP) in Middlesex County (6.5%). Of these households receiving SNAP benefits, 53.1%
include an individual over the age of 60 (46.9% did not). When you compare that to the actual
percentages and totals of the population, households with one or more people over 60 represents
42.6% of the population, indicating that the older the household, the more likely the participation in
SNAP.
In 2019, 31.4% of SNAP benefit households were married couple families, however the total
population of married-couple families was 56.6%, indicating that married couple families were less
likely to participate in the SNAP program. 36.4% of households receiving benefits through SNAP were
considered “other family” households (single parent) while the total household population in county
considered “other family” was 16.8%, indicating that single-parent households were more likely to
participate in SNAP. When broken down by male-headed and female-headed households, female-lead
households were more likely to require SNAP benefits (28.9%) than male-lead households (7.5%).
Similarly, when comparing the actual population percentages of female vs male-lead households,
female-lead households were more prevalent than male-lead households. Finally, Non-Family
28households made up 32.3% of SNAP participating households, while only comprising 26.6% of the total
population, indicating that individuals who live alone, or in congregate settings (roommate etc.) are
more likely to obtain SNAP benefits in Middlesex County.
For families with children under 18 years old, SNAP participation is 46.4%, while the total
population of households in the county with children under 18 is 34.6%. Families without children
under 18 years old represented 53.6% of total SNAP recipients, while comprising 65.4% of the total
population of households. This shows that while SNAP representation is high among all households,
individuals with children under 18 years old are more likely to participate in the program. When looking
at “work status” of these households/ families, 34.5% had two or more workers employed within the
past 12 months, while 46.6% had one worker employed in the past 12 months. 18.9% of households
had no workers in the past 12 months. This indicates that the majority of these households (81.1%)
had at least one person employed within the past 12 months, while over 1/3rd had two or more workers
employed while receiving SNAP benefits.
SNAP participation is not equal among the different race and ethnic demographics in the
county. 39.2% of SNAP participants reported “White/Caucasian alone, not Hispanic or Latino” as the
origin of the householder, while the percentage of the total White Alone, not Hispanic or Latino
households was 48.9%. This shows that White alone, not Hispanic or Latino origin households are less
likely to participate in the SNAP benefits program. Participants reporting Black or African American
householder origin was 16.2%, while the percentage of the total Black or African American householder
origin was only 10.4%. This indicates that Black or African American’s participate in the SNAP benefits
program at a disproportionate rate compared to their total population in the county. Even more
significant, the percentage of participants reporting Hispanic or Latino householder origin was 34.2%
while the total population is only 18.3%. This indicates that Black or African American and Hispanic or
Latino Households are more likely to participate in the SNAP benefits program and at disproportionate
rates when compared to their actual population percentage.
Summary: Nature of the Need
To address some of the issues facing county residents regarding food, MCFOODS was formed.
A collaboration of many partnerships working together to end hunger, the Middlesex County Food
Organization and Outreach Distribution Services (MCFOODS) comprises local governments, nonprofit
agencies, community food pantries, food banks, soup kitchens, social service organizations, businesses,
schools and houses of worship. MCFOODS hosts events to raise monetary and food donations for
pantries and soup kitchens across the County with the goal to help all residents in Middlesex County
achieve food security and provide access to nutritionally adequate food and other basic necessities. In
2019, MCFOODS received and distributed over 2.2 million pounds of food (fresh produce, dairy and
meat) to over 130 county wide partners. MCFOODS also distributes, both virtually and via print, a full
directory of local food assistance locations delineated by township for residents to access.
Survey respondents to the 2020 DCF Needs Assessment for Middlesex County disagreed or
strongly disagreed (47%) that there were enough services in county to address the food needs. 40% of
respondents disagreed or strongly disagreed that anyone in the county could access the services
29You can also read