Midterm review zero rate VAT for electric vehicles
←
→
Page content transcription
If your browser does not render page correctly, please read the page content below
2020

                Midterm review
       zero rate VAT for electric vehicles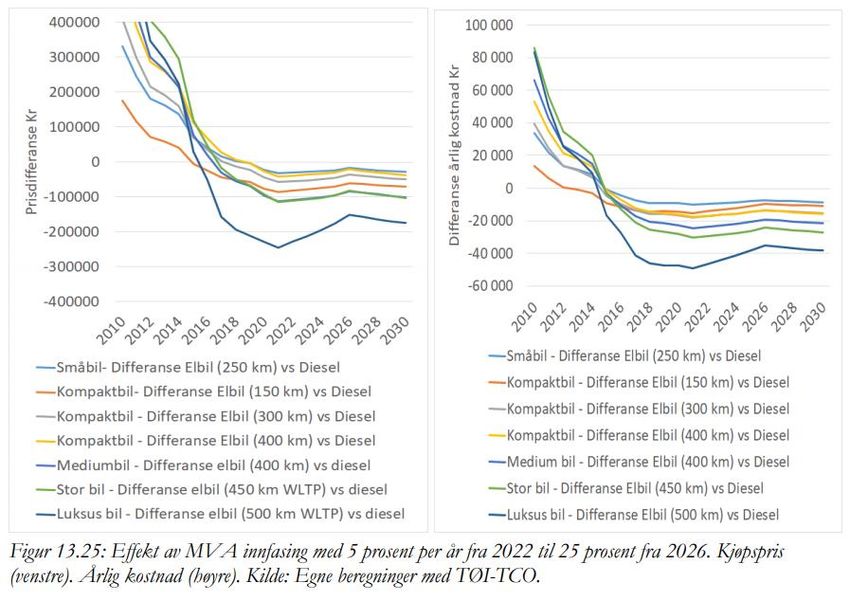
CONTENT

1   The Notification revisited ............................................................................................... 3
    1.1 The Norwegian government’s climate policy and policy for zero emission
    vehicles ............................................................................................................................. 3
    1.2 Market development and BEV market share in Norway and other European
    vehicle markets ............................................................................................................... 4
    1.3 Price and cost comparisons between comparable BEVs and ICEs ................ 10
    1.4 Technological changes and expected development......................................... 14
    1.5 Comparison of the situation in 2017 and 2020 .................................................. 20
2   VAT zero rate and consumer prices for BEVs ........................................................... 21
    2.1 Predictions from existing literature ................................................................... 21
    2.2 Empirical model and analysis ............................................................................. 22
3   VAT zero rate and demand for BEVs .......................................................................... 23
    3.1 Studies with empirical estimates of tax changes .............................................. 23
    3.1.1 ‘The demand for new automobiles in Norway – a BIG model analysis, TØI-
    report 1665/2018 ........................................................................................................... 24
    3.1.2 ‘Greening the vehicle fleet: Norway’s CO2-Differentiated registration tax’.
    Yan S. and G. S. Eskeland. 2018 .................................................................................. 25
    3.1.3 ‘Evaluation of changes in the registration tax for new passenger cars’,
    (‘Evaluering av endringer i kjøpsavgiften for nye biler’). Vista Analyse. 2012 ....... 26
    3.1.4 Simulated effects of changes in the VAT zero rate based on earlier
    estimates ........................................................................................................................ 26
    3.2 Survey results ....................................................................................................... 26
    3.2.1 ‘Charging infrastructure experiences in Norway - the worlds most
    advanced EV market’. Lorentzen et al. 2017 .............................................................. 26
    3.2.2 ‘Elbilbarometeret 2019’ A Nordic survey by Opinion in collaboration with
    the Norwegian EV Association, and ‘Elbilisten 2019’ A survey by the Norwegian
    EV Association ............................................................................................................... 27
    3.2.3 ‘Battery electric vehicle user experiences in Norway’s maturing market’.
    TØI-report 1719/2019 ................................................................................................... 28
    3.3 Various studies evaluating aggregate performance of Norwegian measures28
    3.3.1 ‘360 graders analyse av potensialet for nullutslippskjøretøy’, TØI-rapport
    1744/2019....................................................................................................................... 28
    3.3.2 EEA-study from 'The European Topic Centre on Air Pollution and Climate
    Change Mitigation’. 2019 .............................................................................................. 29
    3.3.3 ‘Dagens and morgendagens bilavgifter’. TØI-rapport 1708/2019 .............. 29
    3.3.4 ‘Incentives for Electric Vehicles in Norway’. Ecofys and Adelphi. 2018 ... 29
    3.3.5 ‘E-vehicle policies and incentives - assessment and recommendations’.
    TØI-report 1421/2015 ................................................................................................... 30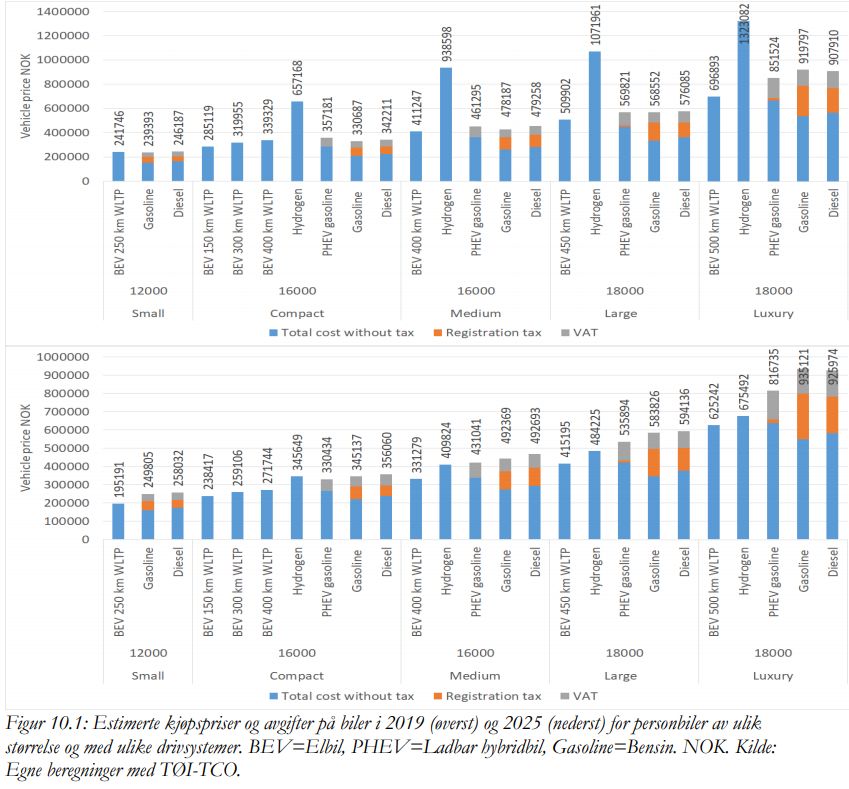
3.3.6 NOU 2019:11 Enklere merverdiavgift med én sats ..................................... 30
        3.3.7 Klimakur 2030. The Norwegian Environment Agency ............................... 30
        3.3.8 Global EV Outlook 2019. International Energy Agency .............................. 31
        3.4 Summary of findings ........................................................................................... 32
4       Concluding remarks ..................................................................................................... 32

        Appendix A: Price data for new passenger cars
        Appendix B: VAT zero rate and consumer prices for BEVs

1       THE NOTIFICATION REVISITED
The plan for the midterm review states that the review will present updated information
regarding the following topics:
    -     Norwegian government’s climate policy and policy for zero emission vehicles
    -     Statistics about the market development i.e. electric vehicle1 (EV) market share,
          in the light of the Norwegian government’s goals for zero emission vehicles.
          This should also include numbers for other relevant European vehicle markets
    -     Examination of the technological changes and review the supply and sales of
          models in different segments
    -     Price and cost comparisons between comparable battery electric vehicles
          (BEVs) and internal combustion engines (ICEs).

The updated information will be compared with the information in the notification and
the development is discussed to assess whether the assumptions and conclusions from
2017 are still valid. Based on the analysis, it should be possible to assess whether the
conclusions that the scheme is necessary and proportionate, are still valid.

1.1 The Norwegian government’s climate policy and policy for zero emission
    vehicles
As a part of the Paris Agreement, Norway is committed to take action to keep global
warming in line with the global long-term temperature goal. Under the Paris
Agreement, Norway has committed to reduce emissions by at least 50 per cent and
towards 55 per cent by 2030 compared to 1990-levels. In EEA Joint Committee Decision
No 269/2019, the EU, Iceland and Norway formally agreed to cooperate on fulfilling
their respective emission reduction targets. By that decision, Iceland and Norway take
part in all three pillars of the EU climate framework. This includes participation in the
Effort Sharing Regulation, which regulates emissions not covered by the EU ETS.
Through the participation in the Effort Sharing Regulation, Norway has a legal
commitment to reduce the non-ETS emissions by 40 per cent by 2030 compared to 2005
levels. The Government intends to reduce the non-ETS emissions by 45 per cent

1
 In Norway electric vehicles (EVs) commonly is used as a reference to battery electric vehicles, but
internationally EV often includes both battery electric vehicles and (chargeable) hybrid vehicles. To avoid
possible unclarity, battery electric vehicles (BEV) are used most places in these document.

Page 3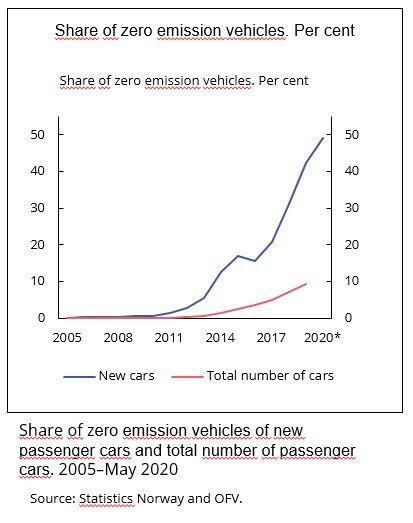
compared to 2005 levels. This represents a fulfilment beyond the 40 per cent
commitment Norway will get under the Effort Sharing Regulation. The ambition is to
reduce these emissions through domestic action. If strictly necessary, the flexible
mechanisms within the Effort Sharing Regulation may be used.
Since Norway will receive an annual emission allocation for each year in the period
from 2021 to 2030 under the Effort Sharing Regulation, it has a value to start the roll-out
of available zero emission technology early.
Reducing GHG-emissions from transportation through the introduction of zero
emission technology is therefore a cornerstone of the Norwegian government’s climate
strategy, with EVs in the passenger car segment being the most mature technology
today.
In its White paper on the National Transport Plan for 2018–20292, the Government
established several new targets:
In 2025, 100 per cent of new private cars and light vans will be zero emission
vehicles. All new city buses will either be zero-emission vehicles or use biogas.
By 2030, all new heavy vans, 75 per cent of new long-distance buses, and 50 per
cent of new lorries will be zero-emission vehicles.
By 2030, the distribution of goods in major city areas will be more or less
emission free.
The White Paper on National Transport Plan 2018–2029 was adopted by the Parliament
in June 2017. According to a recent report, Klimakur 20303, the target for zero emission
passenger cars has by far the largest potential to reduce GHG emissions in the period
2021-2030. To achieve these targets, the Government relies on technological
development.
Klimakur 2030 estimates that reductions in GHG emissions could be almost 6 million
tons CO2-eq. in the period 2021-2030 if the Norwegian Government meets the targets
for zero emission vehicles in the National Transport Plan 2018-2029. This is more than a
quarter of the cazlculated emission gap for Norway in the non-ETS sector, given a
target of 45 per cent reduction.
1.2 Market development and BEV market share in Norway and other
European vehicle markets
During the last few years, there has been a substantial growth in the sales of battery
electric passenger cars in Norway. In 2017, the year of the last notification, 21 per cent
of new passenger cars were battery electric. In 2018 and 2019, battery electric
2 https://www.regjeringen.no/en/aktuelt/a-national-transport-plan-for-better-and-safer-daily-
travel/id2548623/, https://www.regjeringen.no/en/dokumenter/meld.-st.-33-20162017/id2546287/
3
Klimakur 2030 is a report written by Norwegian public agencies, led by the Norwegian Environmental Agency.
In the report, the authors have calculated the GHG reduction potential in Norway in the non-ETS sector in the
years 2021-2030. The report also points to what measures can be implemented in order for Norway to reach the
GHG reduction potential. The report was published on the 31st of January 2020.
https://www.miljodirektoratet.no/globalassets/publikasjoner/m1625/m1625.pdf
Page 4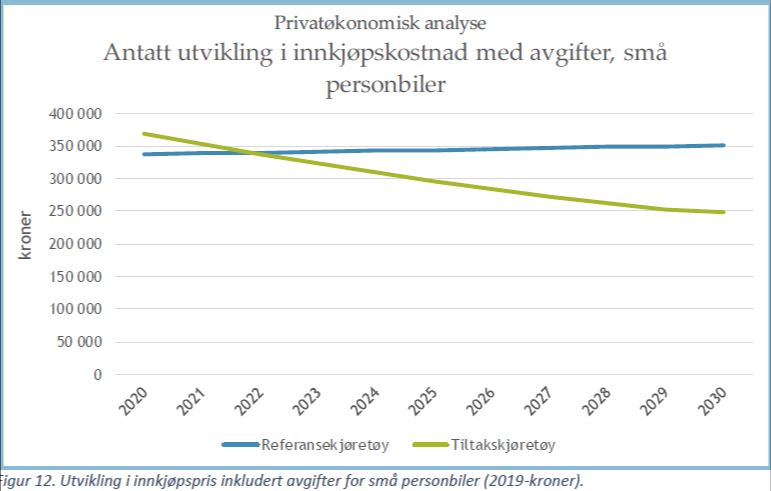
passenger cars had a market share of 31 per cent and 42 per cent of the cars
respectively. From January to May 2020, battery electric passenger cars had a market
share of 49 per cent. In the same period, conventional petrol and diesel cars have been
losing market shares. In 2017, about 48 per cent of new passenger cars were
conventional petrol or diesel engine cars. This market share has decreased steadily,
and from January to May 2020, 21 per cent of all new passenger cars have been
conventional petrol and diesel cars.

Figure 1.1 Market share of new passenger cars

Source: Opplysningsrådet for veitrafikken (OFV)

The sales of battery electric passenger cars have changed the Norwegian car fleet.
From the statistics on registered passenger cars, we see that the number of registered
petrol and diesel passenger cars have decreased by more than 122 000 cars from 31st of
December 2017 to 31st of December 2019. At the same time, the number of passenger
cars increased by about 80 000 cars in total. This development has been spurred by the
growth in battery electric vehicles, plug in hybrids and regular hybrids. Actually, the
number of BEVs increased as much as the number of petrol and diesel cars decreased
in the period.

Page 5
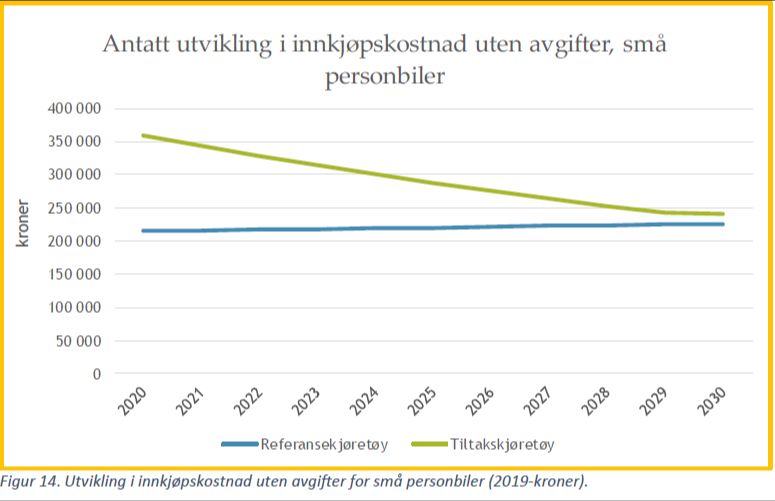
Figure 1.2 Total number of registered passenger cars in Norway 2017-2019

                                         Registered passenger cars
    1500000

    1250000

    1000000

     750000

     500000

     250000

           0
                    Petrol          Diesel       Battery electric   Hydrogen   Plug-in hybrid   Hybrid

                                                   2017     2018    2019

Source: Statistics Norway4
Though the share of new BEVs has increased significantly, the total number of electric
vehicles is still small compared to the number of conventional fossil fuel vehicles in
Norway. The development in the shares of new passenger cars and the total vehicle
stock is compared in figure 1.3. The blue line represents the new car share, which
reaches 49 per cent in 2020, and is much higher than the red line, which represents the
share of the total stock of passenger cars, that reached 9.3 per cent at the start of 2020.

4
    https://www.ssb.no/transport-og-reiseliv/statistikker/bilreg

Page 6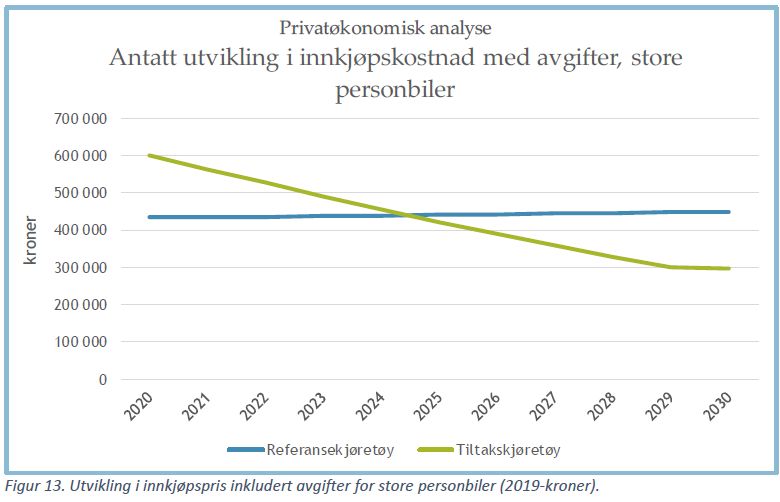
Figure 1.3 Shares of battery electric vehicles per year of new passenger cars and of the stock
of passenger cars in Norway 2005-May 2020

In 2019, the share of BEVs in the Norwegian passenger car fleet corresponded well with
the share of passenger car kilometres driven by BEVs, which was 9.6 per cent of
passenger car kilometers5. This was a substantial increase from 6.7 per cent in 2018 and
4.7 per cent in 2017.

Figure 1.4 shows the number of registered sales of new battery electric vehicles in
selected European countries from 2015 to 2019. As seen from the figure, Norway has
been the largest market for BEVs in Europe for many years. In fact, from 2000 to 2019,
it was only in 2019 that Norway was not the largest BEV market in Europe in absolute
terms. The Norwegian passenger car market represents roughly 1 per cent of the
European passenger car market. Nevertheless, more than 16 per cent of all new BEVs
sold in Europe last year, were sold in Norway.

5
    https://www.ssb.no/transport-og-reiseliv/artikler-og-publikasjoner/mindre-kjoring-med-personbiler

Page 7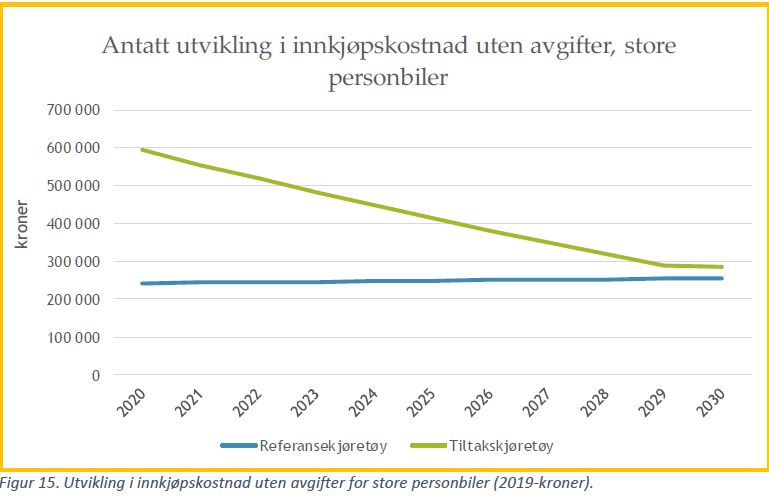
Figure 1.4 Registered new battery electric vehicles in European countries from 2015 to 2019

                                      Registered BEVs
 70000

 60000

 50000

 40000

 30000

 20000

 10000

     0
              2015             2016              2017          2018            2019

           Netherlands    Germany       France      Sweden    UK       Italy    Norway

Source: European Alternative Fuels Observatory (EAFO)

Figure 1.5 shows the BEV market shares in the major BEV markets in Europe. Since
2017, the time of the last notification, the BEV share in Norway has more than doubled,
from around 20 per cent to around 45 per cent.

Page 8
Figure 1.5 Market share of battery electric vehicles in the new car sales in European
countries from 2015 to 2019
BEVs - market share (%)
50
45
40
35
30
25
20
15
10
5
0
2015 2016 2017 2018 2019
Netherlands Germany France Sweden UK Italy Iceland Norway
Source: EAFO
Average type approved CO2 emissions, measured in gram CO2 per kilometre, is an
important measure of emissions from new vehicles. From figure 1.6, we see that
emissions in Norway followed the European trend until 2013/2014. Since then, the
average type approved CO2 emissions from new passenger cars in the Norwegian
market has followed quite a different path than any other European country. In 2019,
the type approved CO2 emissions from new registered passenger cars in Norway was
about half of what it was in 2013 (60 gCO2/km in 2019 – 122.9 gCO2/km in 2013). The
EU average declined from 126.7 gCO2/km in 2013 to 120.8 gCO2/km in 2018. The EU
average in 2018 was about the same as the Norwegian average in 2013. The EU actually
has an upward-sloping trend when it comes to average type-approved CO2 emissions
from new passenger cars, recording increases since 2016.
Page 9Figure 1.6 Average type approved CO2 emissions from new passenger cars in European
countries from 2010 to 2019.
Average type approved CO2 emissions (gram CO2 per
kilometer) from new passenger cars
160
140
120
100
80
60
40
2010 2011 2012 2013 2014 2015 2016 2017 2018 2019
France Germany Netherlands Sweden
United Kingdom Norway EU-28 + Iceland
Source: EEA https://www.eea.europa.eu/publications/co2-emissions-from-cars-and-vans-2018 and
numbers from OFV for Norwegian average type approved CO2 emissions.
The market for fuel cell vehicles (FCV) will still be limited in 2025. In the recent
analysis in Klimakur 2030, the Norwegian Environmental Agency chooses to merely
look at battery electric passenger cars, as the only realistic zero emission technology in
the passenger car segment. BEVs will be more competitive than fuel cell electric
passenger cars at least until 2030. Both the production cost of fuel cell vehicles, fuel
cells and the hydrogen itself relies on large scale production. According to Statistics
Norway, 146 FCVs were registered in the beginning of 2020. Only 29 new FCVs were
registered in Norway in 20196, a reduction from 51 in 20187. There was an explosion in a
hydrogen fuelling station outside of Oslo in the summer 2019. Since the explosion,
there has only been a single registration of a new FCV.
1.3 Price and cost comparisons between comparable BEVs and ICEs
In the early phase of BEV introduction, many car models came in both battery electric
and conventional fuel versions. Today, the car market is to a much larger degree
dominated by unique battery electric models without specific conventional fuel
counterparts. This makes the task of comparing cars on a model to model basis more
difficult. Therefore, the comparison is presented on segment level. Figure 1.7 presents
an overall distribution of new passenger cars by segment, showing that the most
6
https://ofv.no/bilsalget/bilsalget-i-2019
7
https://ofv.no/bilsalget/bilsalget-i-2018
Page 10popular segments are SUV/luxury cars, followed by the group medium, large cars, compact SUV and thereafter, compact cars and small/mini cars. Figure 1.7 Distribution of new passenger car sales. Source: OFV We have collected data for the new passenger car sales from January to May 2020. In total almost 48 000 new passenger cars were sold in those five months. The cars included in the analysis comprise about 75 per cent of total sales in this period. The most popular models for each segment differentiated on fuel type within those segments are chosen. There are actually 22 different segments recorded in the data from OFV, that are merged into four broader segments in the presented comparison. As a result for instance a segment called "medium, large cars, compact SUVs" and another "SUV/luxury". The data used in this analysis is provided in appendix A. After choosing how to group the different segments, one has to decide what cars to include. The most popular models of the different fuel types in the different segments are presented. However, these models are also differentiated into different versions in the data we have. Therefore, like it was done in 2017, the numbers for the "cheapest" version in all the data are presented. The guiding price is merely the price that the importer pays. There are also some costs related to freight and other administrative costs. However, these costs should be fairly equal between the different cars. In Klimakur 2030, one assumed a one-off investment in home charging infrastructure for BEVs which is priced at NOK 20 000. This was considered reasonable, as most BEV buyers have this expenditure connected to a BEV purchase. We have chosen to follow the example for Klimakur 2030 to better reflect the "real" purchase price of a BEV. In figure 1.8 below, these prices are compared between different types of vehicles. Figure 1.8 summarizes the results. Page 11
Figure 1.8 Prices including taxes and charger8

                              PRICES INCLUDING TAXES AND CHARGER
                                               Electric                 PHEV                Petrol             Diesel                Hybrid

                                                                                                                                                       778 522
                                                                                                                                                                 707 500
                                                                                                               526 925

                                                                                                                                             506 560

                                                                                                                                                                           462 500

                                                                                                                                                                                               440 633
                                                                                                                                                                                     413 900
                                                                                                                                   395 000
                                                    374 100

                                                                                                     354 933

                                                                                                                         351 800
                                                                        345 225
                                                              334 933
                                          326 050

                                                                                  313 067
          247 817

                    242 633

                                234 600

        MINI/SMALL CARS                             COMPACT                                     MEDIUM AND LARGE                                       SUV/LUXURY CAR
                                                                                                 CARS / SMALL SUV

Source: OFV

The purchasing price is relatively similar between all technologies in the two smaller
segments. The PHEV models are typically more expensive, but that might be explained
by the fact that the PHEVs are relatively heavy, with an average weight higher than the
average weight for the BEV models.

The differences in prices between battery electric, petrol and diesel technologies in the
segment comprising medium and large cars and small SUVs are small. However, plug-
in hybrids stand out. The explanation seems to be that these cars are relatively large
and more costly to produce. Three out of four of the best-selling PHEV models are
heavier than the best-selling BEV models in the segment. The average weight of the
PHEV models is nearly 200 kg higher than for the BEVs. In comparison, the BEVs are
on average about 300 kilos heavier than the petrol and diesel passenger car models.

The results of the price comparison in the SUV/luxury car segment differ somewhat
from the other segments. In this segment, BEVs have substantially higher prices than
conventional fuel cars, and even higher prices than PHEVs. However, an important
explanation is that among the most popular models in the segment labelled
"SUVs/luxury cars", only BEVs classified as luxury cars are present (among the most
popular models). Three out of six of the BEV models in the segment are luxury cars.
These are the Porsche Taycan (321 sales), Tesla Model X (176 sales) and Tesla Model

8
    The sale of diesel cars and PHEVs in the segment mini/small cars is marginal.

Page 12
S (69 sales). These cars push the average price among the BEV models in the segment
significantly upwards. For instance, the price difference between the Porsche Taycan
and the most popular BEV model in the segment, the Audi e-Tron (5165 sales), is NOK
340 000. The guiding price for an Audi e-Tron is NOK 617 480. If the luxury EV models
are left out, the average of the remaining models are NOK 627 000. This gives a pattern
with more resemblance to the other segments, even though the segment still stands out
with significantly higher prices for BEVs than conventional fuel models. The results
from 2017 showed the same pattern with larger BEVs being far more expensive than
larger conventional cars.
The data collected for the sales from January to May 2020 is quite similar to the last
notification from 2017. The price for all segments have increased from 2016/2017 to
2020, which is to be expected given inflation. Perhaps the most substantial change is
the number of EV models available and the segments they belong to. Until May 2020,
32 different EV models have been registered as new passenger cars. At the end of 2017,
16 different EV models were registered as new passenger cars. In the last notification in
2017, there were only two BEV models classified as medium cars or larger. Today, nine
BEV models are classified as medium cars or larger.
One can also compare prices before taxes.
Figure 1.9 Prices before taxes, assuming that taxes are fully shifted over to consumer prices.
PRICES BEFORE TAXES (NOK)
Electric PHEV Petrol Diesel Hybrid
756 122
518 640
410 276
332 533
303 650
297 360
243 242
241 289
239 867
236 749
235 963
225 417
214 439
213 103
173 073
157 910
MINI/SMALL CARS COMPACT MEDIUM AND LARGE SUV/LUXURY CAR
CARS / SMALL SUV
Source: OFV
Before taxes, the EV models in all the segments are substantially more expensive than
the petrol and diesel models in the same segment.
Page 131.4 Technological changes and expected development The global electric car fleet exceeded 5.1 million in 2018, up by 2 million since 2017. This almost doubled the amount of new registrations in 20179. A continued reduction in battery costs, dedicated production lines for BEVs and production for a broader consumer market is expected. A combination of reduced costs and increased energy efficiency in batteries will initially increase the range of these cars, and subsequently reduce the cost for a given range. This means that BEVs should become competitive in the not too distant future, with less tax incentives than what is currently the case in Norway. A plethora of reports point to EVs becoming competitive, without tax subsidies, before 2030 (see for instance Klimakur 2030, Miljødirektoratet 2020; BNEF 201910; and TØI 2020). However, BEVs are still more expensive than conventional vehicles, and will potentially have other disadvantages for consumers. Such disadvantages may be long charging time and lack of charging infrastructure in some areas. Some consumer groups have extra demanding vehicle use, while others have little to gain from buying an electric vehicle. Thus, there is still a need for significant incentives for BEVs. Klimakur 2030 shows expected development in investment for small and large passenger cars, with and without taxes. Klimakur 2030 finds that with current benefits and incentives, small BEVs will be monetarily profitable to buy compared to a conventional vehicle, around 2022. The same scenario for larger BEVs is around 2025. The results from Klimakur 2030 are illustrated in figure 1.10-1.14 below. 9 https://www.iea.org/reports/global-ev-outlook-2019#key-findings 10 https://about.bnef.com/blog/battery-pack-prices-fall-as-market-ramps-up-with-market-average-at-156-kwh-in- 2019/ See also: https://about.bnef.com/blog/electric-cars-reach-price-parity-2025/ for the same argument in 2017. Page 14
Figure 1.10. Expected development in purchaser price after taxes for small passenger cars.

Figure 1.11 Expected development in purchaser price before taxes for small passenger cars.

Page 15
Figure 1.12 Expected development in purchaser price after taxes for large passenger cars.

Figure 1.13 Expected development in purchaser price before taxes for large passenger cars.

In the report “360 graders analyse av potensialet for nullutslippskjøretøy”,
Transportøkonomisk institutt (TØI) has used the model TCO to estimate purchase
price and taxes for zero emission vehicles and conventional fuel vehicles in 2019 and
2025 in different segments. The results are presented in the charts below. TØI finds
that in 2019, small and compact cars have approximately similar prices as conventional
fuel cars, due to the purchase taxes that is included in the prices of the latter. In the
larger segments, the prices of zero emission vehicles are a little lower. Without the tax

Page 16
advantages, zero emission vehicles are a substantially more costly than conventional
vehicles. The production cost for hydrogen cars are far higher than for other vehicle
technologies.

TØI estimates that the production cost of zero emission vehicles will still be higher in
2025, but they will have the lowest prices in all segments if the tax advantages remains
unchanged during the time period.

Figure 1.14 Estimated purchase prices and taxes for passenger cars in 2019 (upper) and
2025 (lower) for passenger cars of different sizes and different engine technology,

The prices are different in the reports from TØI and from the Norwegian
Environmental Agency. One reason is that the latter includes the purchase of a charger,
which is about NOK 20 000. However, the most important reason is that the different
reports compare different vehicles. The purchasing price is therefore merely
instructive. It is, for instance, not straightforward to decide which model of a

Page 17
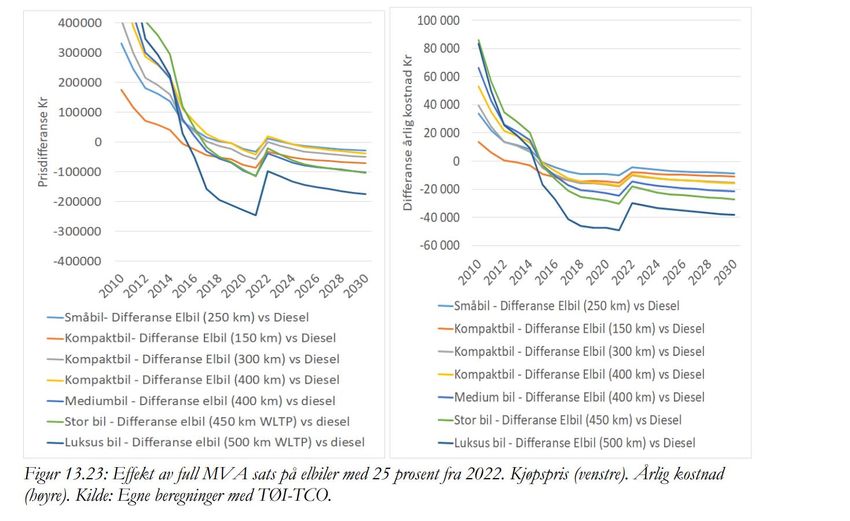
conventional car that is equivalent to a certain BEV. The choice of the specific model
will affect the comparison.

The graphs and analyses above show the purchase price of different types of vehicles,
and do not take into account any difference in cost between BEV and conventional cars
over the lifetime of the car. A BEV owner will have lower expenditures related to fuel
costs and maintenance (regular motor services for example) over the lifetime of the car.

In addition to comparisons of purchaser prices, TØI presents calculations of total cost of
ownerships over the lifetime of the vehicle, based on their cost model TØI-TCO. A
comparison is given in figure 1.15 below, where the left panel shows the development in
purchaser price differences, and the right panel shows total annual cost differences.
The downward sloping curves illustrate that a gradual decrease in price and annual cost
of BEVs relative to ICEs is expected. TØI presents several different scenarios with
different set of changes in tax advantages, but figure 1.16 shows a scenario where the
VAT exemption is removed and replaced by the general VAT rate at 25 per cent in 2022.
In the years before 2022, the calculations are shown with the current tax benefits in
place. The figure show that the total annual cost are lower for BEVs, but that removing
the VAT exemption significantly increases the total annual cost of BEVs and reduces
the advantage compared to conventional diesel vehicles.

However, there is still a positive total cost advantage for BEVs over the lifetime of the
car. A more gradual withdrawal of the VAT exemption is shown in figure 1.16.
Compared to figure 1.15, this option does not alter the total change over the period, but
the increase in the price and total annual cost of BEVs is smoothed over time. However,
uncertainty about the cost and price development, as well as behavioural responses to
tax changes, suggests that there are advantages related to choosing a gradual
approach.

Page 18
Figure 1.15 Differences between price (left) and annual cost (right) between diesel vehicles
and BEVs with introduction of general VAT rate on BEVs in 2022.

Figure 1.16 Differences between price (left) and annual cost (right) between diesel vehicles
and BEVs with introduction of gradual increase in VAT rate from 2022 to 2026.

Page 19
1.5 Comparison of the situation in 2017 and 2020
The sales of electric vehicles in Norway is still high compared to other countries, as it
was in 2017. Although the sales of battery electric vehicles has increased considerably
since the last notification, from about 21 per cent in 2017 to about 49 per cent from
January to May 2020, we are still far from reaching the target of zero emission vehicles
constituting 100 per cent of new passenger car sales in 2025.
Since 2017, Norway has strengthened the ambitious climate policies, and kept the
ambitious targets for the introduction of zero emission vehicles. In 2020, as in 2017, the
target for passenger cars is that 100 percent of new private cars and light vans will be
zero emission vehicles in 2025. Improvements in technological maturity so that zero
emission vehicles will be competitive to conventional vehicles, is a precondition for the
targets.
In February this year, Norway became the first and so far the only western country to
report a strengthened climate target within the UN deadline. Norway significantly
strengthened the reduction target from 40 percent to 50 - 55 percent (from 1990 to
2030).
As expected in the last notification, the cost of producing BEVs has been decreasing
since the last notification. The production costs, and hence the sales prices, excluding
taxes, are higher for BEVs than for comparable gasoline and diesel cars. Furthermore,
there are still disadvantages for BEV buyers, including limitations in range and
charging capacity. This can represent significant disadvantages of owning a BEV,
leading to a reduced demand. There is still a need for economic incentives to promote
the purchase of EVs.
The VAT exemption for electric vehicles is an important economic measure that gives
incentives in favour of zero emission vehicles at the time of purchase. With the VAT-
exemption in place together with other measures, we have seen an increase in the BEV
share. After a halt in the increase in the years 2015–2017, the increase picked up in the
following years. In 2017, the future development in the share of BEVs was uncertain,
and the increase the last years has been above the expectations in 2017, but in line with
what the Government was aiming towards.
The pace we have observed the last years is approximately in line with what is
necessary to reach the target for introduction of zero emission vehicles in 2025. The
future is uncertain, but the past development gives reason to expect that with the
measures in place, the increase in the BEV share will continue. Furthermore, the
updated information about policy, market, cost and prices are in line with the
assumptions in the notification in 2017. This supports the conclusion from 2017, that the
scheme is necessary and proportionate.
The topics of special concern, whether the zero VAT rate leads to lower prices and to
increased demand, are addressed in the two following parts of the midterm review.

Page 20
2   VAT ZERO RATE AND CONSUMER PRICES FOR BEVS
During the package meeting September 26 2019, ESA clarified their expectancies
regarding an analysis of the assumption that the VAT zero rate leads to lower consumer
prices. In the plan for the midterm review from December 2019, we stated the
following:

“We will examine and seek to verify that the VAT zero rate results in lower price for the
consumer. We intend to analyse pass-through by collecting prices for different EV-models in
Norway as well as one or more comparable countries, such as Sweden. We will need to
identify the price net of taxes and transform it into a comparable currency. This method
will reveal whether the cars are sold at different prices in different countries, and thereby
try to estimate the level of pass through of the zero VAT-rate in Norway. In the analysis we
will describe factors that can affect price level for EVs in the countries, present assumptions
that have been applied in the analysis and discuss the importance of these factors and
assumptions with regard to the robustness of the results.”

Since December, we have developed an empirical model designed to reveal the causal
relationship between the price of Norwegian BEVs, and the VAT zero rate. The
following paragraphs will give a brief summary and discussion of existing literature on
tax incidence, before we present our model, results and key assumptions. For an in-
depth description of our analysis, we refer to appendix B.

2.1 Predictions from existing literature
Economic theory states that for markets with perfect competition, or markets
characterised by oligopolistic price competition with homogenous products, the rate of
which an ad valorem tax is passed through to the consumers by an increase in market
prices depends on the elasticities of demand and supply. A perfectly elastic supply curve
(constant marginal costs) implies that the tax is fully passed through to consumers,
while a perfectly elastic demand curve implies that the tax has no effect on prices. The
assumptions for these kinds of markets, however, do not hold for the market for motor
vehicles. Motor vehicles are sold in markets with imperfect competition, where
products are differentiated both vertically and horizontally by having different
characteristics and through marketing/branding. Furthermore, the market is
characterised by vertical integration, where some producers sell directly to consumers
via fully integrated dealerships, some may sell through non-integrated, but exclusive,
dealerships, while others will sell their vehicles trough “independent” dealerships.
Producers might also choose a combination of the above. In markets with imperfect
competition, the level of pass through depends on the exact characteristics of each
market.

There has been a number of publications giving an overview of how ad valorem taxes
affect prices and welfare in markets with imperfect competition, under different market
conditions. The theoretical predictions vary greatly, however, the most common result
seems to be that ad valorem taxes are undershifted; meaning consumer prices increase

Page 21
less than the amount of tax per unit. The theoretical results are backed by several
empirical studies. Empirical findings vary, depending on product, country and empirical
strategy, confirming the heterogeneity of the theoretical predictions.

The heterogeneous nature of tax incidence makes it difficult to use earlier theoretical
and empirical studies to draw conclusion regarding the Norwegian VAT zero rate on
BEVs without a comprehensive analysis of market conditions, industry integration and
the relationship between dealerships and producers. We have not been able to find any
papers or reports including such an analysis, and we consider performing such an
analysis to be beyond the scope of this midterm review.

In the plan for the midterm review, and the preceding meetings, the issue has been
whether the VAT zero rate on Norwegian BEVs has been passed on to consumers in
the form of reduced prices. Pass through is a central part of the tax incidence literature,
but theoretical predictions and empirical estimates usually hinges on the fact that VAT
rate reductions is introduced in mature markets. The VAT zero rate on BEVs was
introduced in 2001, long before there existed a substantial commercial market for
BEVs. While this may seem trivial, it has some important implications. Phenomena
such as price stickiness and tacit collusion help explain why reduced rates are not
passed on to consumers, but these phenomena will only occur if there is a price before
the reduced rate is introduced. One must therefore use great care when drawing
conclusions about the Norwegian VAT zero rate on BEVs based on empirical estimates
for other goods or markets.

2.2 Empirical model and analysis
Given the special circumstances of the VAT zero rate, instead of determining the level
of pass through, we wish to study what would happen to BEV prices if we introduced
VAT on BEVs in Norway. Our proposition is that if prices are unaffected by the
introduction of VAT (equivalent to the tax exemption not being passed through), there
must exist an ad valorem mark up on BEVs in Norway that is contingent on the VAT
zero rate. We collect price data for 51 BEVs and 23 conventional vehicles in Norway and
Sweden and employ a model similar to the difference in difference model used in causal
empirics.

By comparing the price difference between battery electric and conventional vehicles in
each country, we eliminate any factors that affect prices of either conventional or
battery electric vehicles in both countries, and any factors that affect prices of both
battery electric and conventional cars in one of the countries. Since we also adjust for
differences in taxation, any positive difference in price differences should be caused by
the existence of a mark-up caused by reduced sales taxes on BEVs . If the difference in
price differences is equal to zero, we may conclude that there is no mark up on BEV
prices, and that the VAT zero rate leads to lower consumer prices for BEVs in Norway.

Page 22
When calculating the average difference in differences for our sample, under the
assumption that VAT and one-off registration taxes in the Norwegian and Swedish
market is fully passed through, we find the difference to be negative. This result
indicate that prices of BEVs in Norway are lower than the reduced VAT rate should
imply. Our analysis is sensitive to the level of pass through of taxes in Sweden and on
conventional cars in Norway. If we allow for overshifting of these taxes, meaning a 25
percent VAT rate leads to price increases larger than 25 percent, the difference in price
differences becomes zero.

The negative sign on the average difference in price differences may be caused by the
fact that the underlying assumptions of our model does not hold. A key assumption is
that BEVs are sold with constant marginal costs. Based on our knowledge of the car
industry, we believe this to be likely on the production level, and on the dealership
level. Even if there are economies of scale present, we argue that the relative size of the
Norwegian and Swedish market, combined with the geographical proximity of the two
countries, makes any economies of scale negligible for the purpose of this analysis. The
negative sign could also be caused by a country and vehicle specific factor that is
omitted from our model. For this to be the case, the factor would have to be substantial.
We are not able to identify what this factor could be, and while it is impossible to
completely rule out the existence of such a factor, we deem it unlikely that the results
are skewed by an omitted factor.
Our empirical analysis may have some limitations, but when combining it with the vast
theoretical and empirical literature on tax incidence, we find it very unlikely that prices
on electric vehicles would be unaffected by the introduction of a VAT, and hence that
the VAT exemption is passed on to the consumer. We therefore conclude that the VAT
zero rate benefits consumers through reduced prices.

3   VAT ZERO RATE AND DEMAND FOR BEVS
In the plan for the midterm review, it is stated that we attempt to verify that the VAT
zero rate increases demand for BEV. There is a large number of studies and surveys on
electric cars, car taxation and similar topics. The most relevant studies are briefly
presented below. In the plan for the midterm review, a report commissioned by the
Ministry of Climate and Environment from TØI, is specifically mentioned. Much
information from this report, “360 graders analyse av potensialet for
nullutslippskjøretøy” is included earlier in the first part of this midterm review. In
addition, the report is included in the list below. The studies and surveys presented are
divided in three subgroups, as specified in more detail below.

3.1 Studies with empirical estimates of tax changes
The VAT exemption is part of a comprehensive set of measures and, have been in place
since 2001. Therefore, the effect of the exemption on the demand for BEVs is difficult to
estimate. Results from studies that use different models have tried to simulate the effect
of the changes in the car taxation on the car sales in Norway, are summarized below.

Page 23
3.1.1 ‘The demand for new automobiles in Norway – a BIG model analysis, TØI-report
      1665/2018
In this report, TØI analyses how different tax changes affect the composition of car
sales, CO2 emissions and revenues. To simulate responses to different tax changes they
use the model BIG, a disaggregated discrete choice model of passenger car purchases.
The model uses information about virtually all 1.8 million new automobile transactions
in Norway during 2002–2016, to derive direct and cross demand price elasticities for
gasoline, diesel, ordinary hybrid, plug-in hybrid and battery electric passenger cars.
The direct and cross demand elasticities are shown in figure 3.1.
Figure 3.1 Price elasticities of demand for five vehicle types in 2016, derived with respect to
the retail prices of cars.

Source: TØI
The direct demand elasticity for battery electric vehicles is 0.99, i.e. a one per cent
increase in the price of BEVs is expected to give a close to one per cent reduction in the
sale of BEVs.
In their report, TØI analyses some specific tax changes as shown in figure 3.2,
including:
   -      Introduction of general VAT rate of 25 per cent for BEVs. The results would have
          reduced the share of new passenger car purchases in 2016 from 16 to 4 per cent.
          The result implies that a large price increase could have significant negative
          impact on the sale.
   -      Introduction of a registration tax for BEVs similar to that of PHEVs would only
          result in a small reduction in the sales of BEVs. One important reason for this
          result is that this tax change only would result in only a few BEVs (the heavy
          ones) getting a positive registration tax, leaving the majority unaffected by the
          change.

Page 24
Figure 3.2. Observed market shares in 2016 and calculated market shares under eight
different tax regimes.
-
Source: TØI
To summarize, this study shows that car buyers respond to tax changes, but the
magnitude of the response depends on which changes are made. Large tax changes,
like removing the VAT exemption or the CO2 component in the registration tax, can
possibly imply large adjustments and changes in the composition of the new passenger
car purchases. Less dramatic changes, like 10 per cent higher registration tax for all
cars, can result in relatively limited changes in the composition.
3.1.2 ‘Greening the vehicle fleet: Norway’s CO2-Differentiated registration tax’. Yan S.
and G. S. Eskeland. 2018
The study analyses the CO2-differentiation of the vehicle registration tax. They find that
a 1 000 NOK tax increment reduces vehicle sales by 1.06–1.58 %. The study presents an
elasticity of average CO2-intensity to average car price of -0.53, with a pass through of
the tax to car prices of 88 %. They conclude that tax significantly shifts consumers
toward lower-emission vehicles. Simulations done in the study, suggest that high-
emission vehicle segments lose market shares and become less CO2-intensive, while
low-emission segments gain market shares.
The topic of the study is the registration tax, not VAT-advantages and it uses data for
the period from 2006–2011, that is before the numbers of EVs increased substantially.
Nonetheless, the study finds significant shifts in choice of cars due to tax incentives.
Page 253.1.3 ‘Evaluation of changes in the registration tax for new passenger cars’,
(‘Evaluering av endringer i kjøpsavgiften for nye biler’). Vista Analyse. 201211
The study evaluates the introduction in 2007 of environmental differentiation of the
registration tax. From 2006 to 2011 the average CO2-emissions from new passenger
cars fell with 24 per cent. Vista Analyse finds that the tax changes can explain between
50 and 60 per cent of the observed emission reduction in the period. The findings that
the CO2-component in the registration tax have had significant influence on the CO2-
emissions from new cars, also strengthens the hypothesis that tax advantages at the
time of purchase like the VAT-exemption, impacts the composition of car sales.
3.1.4 Simulated effects of changes in the VAT zero rate based on earlier estimates
In the plan for the midterm review, it is stated that if possible, estimated elasticities will
be used to calculate probable effects of the VAT zero rate. The elasticities that most
easily lends itself to an exercise like that, is the estimate from TØI shown in figure 3.1
above. If the direct demand price elasticity for BEVs of roughly -1 per cent is used as
basis for estimation, introduction of low tax for BEV, for example 10 per cent of the
price, will give a moderate, but significant, reduction in the demand, with a magnitude
around 10 per cent. With a BEV share of 50 per cent so far in 2020, a change like this
would implicate a reduction of five percentage points. As mentioned earlier, the result
TØI calculates for reduction in the BEV share if general VAT rate is introduced,
indicates that bigger changes can imply large adjustments.
Even though there is considerable uncertainty about the range the estimated elasticity
is valid, as well as changing market conditions due to the rapid change in the vehicle
marked, the estimate may serve as an indication of the magnitude of the change in the
composition of new cars, it is reasonable to expect with a moderate introduction of tax
on BEVs.
3.2 Survey results
Surveys can give insight of how buyers value different measures and perceive the
importance of advantages. Results from different surveys are presented below.
3.2.1 ‘Charging infrastructure experiences in Norway - the worlds most advanced EV
market’. Lorentzen et al. 2017
The paper has a focus on charging infrastructure and experiences, but also discusses
more general aspects of the Norwegian EV policies. They argue that the Norwegian
experience shows that there is a substantial number of potential early users who will
buy BEVs even without a comprehensive fast charging network. They contrast this by
comparing with Denmark, where the charging infrastructure network is quite well-
developed, but the BEV sale is sluggish. The assessment is that this implies that other
incentives are more important than a charging network on its own. However, the paper
11
Report by Vista Analyse: https://vista-analyse.no/no/publikasjoner/evaluering-av-endringer-i-kjopsavgiften-
for-nye-biler-fra-2006-2011/
Page 26does comment that as we are moving to a mass market adoption of BEVs, there is an
obvious need for a large scale fast charging network as new user groups are preparing
to move into the world of BEVs and as a growing number of BEV owners do not rely on
conventional cars as backup.
Regarding the need for public support for fast charging, the paper argues that the
business model related to fast charging, is starting to come apparent with as little as
around 115 000 BEVs, or around 3 per cent of the light car fleet being BEVs. The paper
draws the conclusion that this shows that there is a limited need for public support after
a relatively short introduction phase. They highlight that a future challenge will be
charging possibilities at home for the population living in apartment buildings.
The paper also presents some results of an EV owner survey from 2017, showing that
the Norwegian BEV users values the tax breaks at time of purchase and other
economic incentives, the highest.
3.2.2 ‘Elbilbarometeret 2019’ A Nordic survey by Opinion in collaboration with the
Norwegian EV Association, and ‘Elbilisten 2019’ A survey by the Norwegian EV
Association
Elbilbarometeret is a Nordic survey by Opinion in collaboration with the Norwegian EV
Association. The survey has 4 778 respondents, approximately 1 000 respondents from
each of the Nordic countries, a bit less from Iceland. The purpose of the survey is to
examine the demand for and attitudes towards EVs, in the Nordic countries. The 2019-
survey is carried out in 2018 and 2019.
According to the survey, 65 per cent have the opinion that tax relief is important for
Norwegians to be buying an EV next time they replace their car. In Norway, it is
perceived that the most important barrier to buying an EV is lack of range. This is the
same as in Iceland, but in Denmark, Sweden and Finland the price is the most
important barrier.
Elbilisten is an annual survey by the Norwegian EV Association since 2013. In 2019, the
survey was sent to 70 000 EV owners (both member and non members of the
association) and received 16 125 answers. The purpose of the survey is to examine
Norwegian EV owners car use, attitudes and experiences with EV and charging.
According to the survey, the VAT exemption is the most important EV advantage.
When asked to choose the three most important EV advantages for themselves, the
VAT exemption is chosen by the highest share, 69 per cent. Following second and third
are the exemption from the registration tax (58 per cent) and free or low toll roads (50
per cent). When asked if they would buy an EV today without the VAT exemption, 28
per cen answered ‘yes’, 47 per cent ‘no’ and 24 per cent answered ‘not relevant/unsure’.
When asked what they would buy without exemption for the VAT and registration tax,
41 per cent answered ‘EV’, 34 per cent answered ‘new or used petrol or diesel car’, 6 per
cent would not buy a car and 19 per cent answered ‘do not know’.
The surveys show that the VAT advantage is considered as an important, maybe even
the most important, measure to increase the purchase of EVs. The answers from
Page 27existing EV owners in Norway, indicate that a significant share of the EVs would not
have been purchased without the VAT exemption.
3.2.3 ‘Battery electric vehicle user experiences in Norway’s maturing market’. TØI-
report 1719/2019
We also refer to results from an online survey from June 2018 of BEV owners and
owners of conventional cars. The results are compared with a similar survey from 2016.
Young men with high education, in work and in bigger households with above average
income drive a BEV more often than the average car driver. However, from 2016 to
2018, the difference between the BEV driver and the average driver has diminished.
BEV owners have in average 35 per cent longer travel distance to work than owners of
conventional cars. The survey finds that in the opinion of owners of conventional cars,
the following are the largest drawbacks with BEVs: Limited range, car size and practical
characteristics like trunk size and lack of possibility for towbar – properties that are
important when it comes to longer journeys and flexible car use. For BEV owners,
driving economy is the most important reason for the car choice for 56 per cent, while
only 8 per cent of the conventional car owners say the same. For the latter, reliability
and practical properties are the most important. The share who want to buy a BEV as
their next car is increasing. To summarize, the survey shows that a growing number of
consumers is considering BEVs a viable alternative. However, for the owners of other
cars than BEVs, properties of the car is important, and in their opinion, there still is
important disadvantages with BEVs compared to conventional cars.
3.3 Various studies evaluating aggregate performance of Norwegian measures
3.3.1 ‘360 graders analyse av potensialet for nullutslippskjøretøy’, TØI-rapport
1744/2019
The report investigates goals, incentives and results with regard to EVs in Finland,
Sweden, Denmark, Germany, France and China. All these countries have incentives in
place, which can have a value of up to EUR 60 000, but typically less. Many of the
incentives take form of favourable taxation rules for the private use of electric company
cars. None of the countries comes close to Norway when it comes to market shares for
EVs. A conclusion of the report is that countries with the most incentives have the
highest EV shares. Further, a finding which is reported is the importance of the long-
term nature of the Norwegian EV incentives, and the relative predictability. This has
been very important for there to be a functioning second hand market, which is
imperative when taking a decision of buying a car. It seems that Norwegian EV owners
have trusted that there will be a second hand market for EVs. The dynamic might have
had the opposite effect in many countries, which may also explain to some degree why
the privately owned EVs have a marginal share of the total EVs owned. Lastly, in the
report one points toward the relative simplicity of the Norwegian EV incentives, as
compared to the other countries.
Page 28It also seems that many other countries have set ambitious targets for the sales of new
EVs, mirroring the Norwegian goal, albeit not as ambitious.
3.3.2 Briefing No 6/2019 Summary of ‘Fiscal instruments favouring electric over
conventional cars are greener’ by The European Topic Centre on Air Pollution
and Climate Change Mitigation. European Environment Agency. 201912
One of the conclusions from this study, is the following: Countries such as Norway and
the Netherlands, that have promoted electric vehicles more than any of the other
countries in the study, managed to achieve significant reductions in emissions, both in
terms of CO2 and air pollutants. Many electric vehicles were introduced into these
countries’ fleets, because policies specifically target these technologies. The leading
country in terms of emission savings, is Norway. One likely reason for this relatively
high performance is strong incentives for promoting purchase and ownership of PHEVs
and BEVs.
3.3.3 ‘Dagens and morgendagens bilavgifter’. TØI-rapport 1708/2019
The report presents and evaluates the existing system for car taxation and proposes
improvements. In the assessment of the VAT, it states that the VAT exemption for
BEVs plays a significant role for the choice of the car purchasers, and thereby is an
important measure in the climate policy in the transportation sector. In the concluding
remarks of the evaluation of the VAT, it is stated that the exemption for zero emission
vehicles is decisive for the competiveness and market share of these cars.
The report also presents projections of passenger cars transportation until 2030. To see
the effects of the purchase taxes, it is important to look quite far ahead. In this part of
the report, the necessary strength of the EV-incentives to reach the zero emission
targets, is discussed. It is considered an open question whether the existing BEV
incentives will be sufficient to achieve the zero emission targets for new passenger cars
in 2025 and 2030. Different aspects are discussed and it is stated: “All in all it is little
doubt that the tax exemptions for zero emission vehicles in a decisive way has affected the
choices of the car purchasers. The climate effect of this is limited in the short run, but
significant when looking 10 to 20 years ahead.”13
3.3.4 ‘Incentives for Electric Vehicles in Norway’. Ecofys and Adelphi. 2018
The article presents and discusses different aspects of the Incentives for electric
vehicles in Norway. It states that the most important incentives for Norway are
financial. Norway’s approach is outstanding insofar as the total cost of ownership
(TCO)14 is lower for PHEVs in comparison to internal combustion engine vehicles.
12
https://www.eea.europa.eu/publications/fiscal-instruments-favouring-electric-over
13
«Alt i alt er det likevel liten tvil om at avgiftsfritakene for nullutslippsbiler på en avgjørende måte har påvirket
bilkjøpernes valg. Klimaeffekten av dette er beskjeden på kort sikt, men betydelig når en ser 10 til 20 år
fremover.»
14
A TCO consists of a car’s purchase price, its maintenance and fuel costs, and the infrastructure costs over the
lifespan of the vehicle. Sometimes, insurance and financing costs are also included in this calculation.
Page 29You can also read