MILKING THE PLANET HOW BIG DAIRY IS HEATING UP THE PLANET AND HOLLOWING RURAL COMMUNITIES - Institute for Agriculture and Trade Policy
←
→
Page content transcription
If your browser does not render page correctly, please read the page content below

iatp.org

MILKING THE PLANET
 HOW BIG DAIRY IS HEATING UP
 THE PLANET AND HOLLOWING
     RURAL COMMUNITIES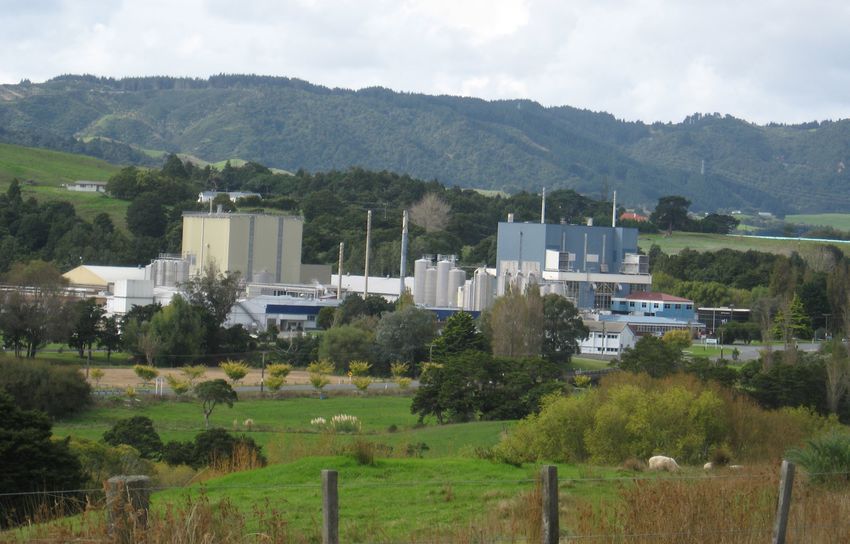
Emissions Impossible Series
                Milking the Planet: How Big Dairy is heating up the planet and hollowing rural communities

                                                   By: Shefali Sharma

                                                  Published June 2020

With special thanks to the Heinrich Böll Foundation and the Rockefeller Brothers Fund for support of this publication.

Special thanks also to Devlin Kuyek, Nevena Zujko, Darrin Qualman and Elena Alter for help with data, Cecelia Heffron
             and Ben Lilliston for editing and last, but not least, Colleen Borgendale for layout and design.

To read the first publication of the Emissions Impossible series, Emissions Impossible: How big meat and dairy are heating
                    up the planet, co-published with GRAIN, visit www.iatp.org/emissions-impossible.

                        The Institute for Agriculture and Trade Policy works locally and globally
         at the intersection of policy and practice to ensure fair and sustainable food, farm and trade systems.
                                                     More at iatp.org

                                        Minneapolis | Washington, D.C. | Berlin
TABLE OF CONTENTS
EXECUTIVE SUMMARY .  .  .  .  .  .  .  .  .  .  .  .  .  .  .  .  .  .  .  .  .  .  .  .  .  .  .  .  .  .  .  .  .  .  .  .  .  .  .  .  .  .  .  .  .  .  .  .  . 4
      Dismantling supply management, hastening rural and climate crises .  .  .  .  .  .  .  .  .  .  .  .  .  .  .  .  .  .  .  .  .  . 4
         The COVID-19 crisis is amplifying calls for supply management .  .  .  .  .  .  .  .  .  .  .  .  .  .  .  .  .  .  .  .  .  .  .5
      Global Dairy Crisis . .  .  .  .  .  .  .  .  .  .  .  .  .  .  .  .  .  .  .  .  .  .  .  .  .  .  .  .  .  .  .  .  .  .  .  .  .  .  .  .  .  .  .  .  .  .  .  .  .  .5
         The view from four regions . .  .  .  .  .  .  .  .  .  .  .  .  .  .  .  .  .  .  .  .  .  .  .  .  .  .  .  .  .  .  .  .  .  .  .  .  .  .  .  .  .  .  .5
      Way Forward . .  .  .  .  .  .  .  .  .  .  .  .  .  .  .  .  .  .  .  .  .  .  .  .  .  .  .  .  .  .  .  .  .  .  .  .  .  .  .  .  .  .  .  .  .  .  .  .  .  .  .  .  .6
         Redirect, Regulate, Regenerate .  .  .  .  .  .  .  .  .  .  .  .  .  .  .  .  .  .  .  .  .  .  .  .  .  .  .  .  .  .  .  .  .  .  .  .  .  .  .  .  .6

KEY FINDINGS .  .  .  .  .  .  .  .  .  .  .  .  .  .  .  .  .  .  .  .  .  .  .  .  .  .  .  .  .  .  .  .  .  .  .  .  .  .  .  .  .  .  .  .  .  .  .  .  .  .  .  .  .  . 7
         Figure 1: The top 13 global dairy companies combined increased greenhouse gas e                                                             missions
         by 11% in two years .  .  .  .  .  .  .  .  .  .  .  .  .  .  .  .  .  .  .  .  .  .  .  .  .  .  .  .  .  .  .  .  .  .  .  .  .  .  .  .  .  .  .  .  .  . 7
         Figure 2: Change in the greenhouse gas emissions of the top 13 global dairy companies in two
         years . .  .  .  .  .  .  .  .  .  .  .  .  .  .  .  .  .  .  .  .  .  .  .  .  .  .  .  .  .  .  .  .  .  .  .  .  .  .  .  .  .  .  .  .  .  .  .  .  .  .  .  .  .8

RISING PRODUCTION, RISING EMISSIONS .  .  .  .  .  .  .  .  .  .  .  .  .  .  .  .  .  .  .  .  .  .  .  .  .  .  .  .  .  .  .  .  .  .  .  .  . 8
         Figure 3: Top 13 global dairy companies and emission targets .  .  .  .  .  .  .  .  .  .  .  .  .  .  .  .  .  .  .  .  .9

EMISSIONS INTENSITY .  .  .  .  .  .  .  .  .  .  .  .  .  .  .  .  .  .  .  .  .  .  .  .  .  .  .  .  .  .  .  .  .  .  .  .  .  .  .  .  .  .  .  .  .  .  .  .  . 9
      Reducing emissions per litre of milk hides environmental costs of overproduction .  .  .  .  .  .  .  .  .  .  .  .  .  .9

DISMANTLING SUPPLY MANAGEMENT, HASTENING RURAL AND CLIMATE CRISES  .  .  .  .  .  .  .  .  .  .  .  . 10
        Figure 4: Dairy price volatility and price crashes  .  .  .  .  .  .  .  .  .  .  .  .  .  .  .  .  .  .  .  .  .  .  .  .  .  .  .  . 10
        BOX 1: COVID 19: Rising calls for supply management amidst COVID 19 crisis .  .  .  .  .  .  .  .  .  .  .  . 12

THE GLOBAL DAIRY CRISIS .  .  .  .  .  .  .  .  .  .  .  .  .  .  .  .  .  .  .  .  .  .  .  .  .  .  .  .  .  .  .  .  .  .  .  .  .  .  .  .  .  .  .  .  .  . 13
     The view from four regions .  .  .  .  .  .  .  .  .  .  .  .  .  .  .  .  .  .  .  .  .  .  .  .  .  .  .  .  .  .  .  .  .  .  .  .  .  .  .  .  .  .  .  .  . 13
        Europe .  .  .  .  .  .  .  .  .  .  .  .  .  .  .  .  .  .  .  .  .  .  .  .  .  .  .  .  .  .  .  .  .  .  .  .  .  .  .  .  .  .  .  .  .  .  .  .  .  .  .  .  .  . 13
            Figure 5: The European Union and dairy .  .  .  .  .  .  .  .  .  .  .  .  .  .  .  .  .  .  .  .  .  .  .  .  .  .  .  .  .  .  .  .  . 14
        U.S.  .  .  .  .  .  .  .  .  .  .  .  .  .  .  .  .  .  .  .  .  .  .  .  .  .  .  .  .  .  .  .  .  .  .  .  .  .  .  .  .  .  .  .  .  .  .  .  .  .  .  .  .  .  .  .  . 15
            Figure 6: The United States and the dairy industry .  .  .  .  .  .  .  .  .  .  .  .  .  .  .  .  .  .  .  .  .  .  .  .  .  .  . 15
            Figure 7: Milk: Cost of production vs. price paid to farmers in the U.S. from 2010-2017 . .  .  .  .  .  . 16
        New Zealand .  .  .  .  .  .  .  .  .  .  .  .  .  .  .  .  .  .  .  .  .  .  .  .  .  .  .  .  .  .  .  .  .  .  .  .  .  .  .  .  .  .  .  .  .  .  .  .  .  .  . 16
            Box 2: Fonterra’s climate targets, growth and impacts . .  .  .  .  .  .  .  .  .  .  .  .  .  .  .  .  .  .  .  .  .  .  .  . 17
        India .  .  .  .  .  .  .  .  .  .  .  .  .  .  .  .  .  .  .  .  .  .  .  .  .  .  .  .  .  .  .  .  .  .  .  .  .  .  .  .  .  .  .  .  .  .  .  .  .  .  .  .  .  .  .  . 17
            Figure 8: Dairy - Exports for India. Forecast for last 5 years. Reported on: 7/2019 .  .  .  .  .  .  .  .  .  . 18

WAY FORWARD .  .  .  .  .  .  .  .  .  .  .  .  .  .  .  .  .  .  .  .  .  .  .  .  .  .  .  .  .  .  .  .  .  .  .  .  .  .  .  .  .  .  .  .  .  .  .  .  .  .  .  . 19
      Redirect, Regulate, Regenerate .  .  .  .  .  .  .  .  .  .  .  .  .  .  .  .  .  .  .  .  .  .  .  .  .  .  .  .  .  .  .  .  .  .  .  .  .  .  .  .  .  . 19

ENDNOTES . .  .  .  .  .  .  .  .  .  .  .  .  .  .  .  .  .  .  .  .  .  .  .  .  .  .  .  .  .  .  .  .  .  .  .  .  .  .  .  .  .  .  .  .  .  .  .  .  .  .  .  .  .  . 21

ANNEX 1 .  .  .  .  .  .  .  .  .  .  .  .  .  .  .  .  .  .  .  .  .  .  .  .  .  .  .  .  .  .  .  .  .  .  .  .  .  .  .  .  .  .  .  .  .  .  .  .  .  .  .  .  .  .  .  . 24
      Endnotes .  .  .  .  .  .  .  .  .  .  .  .  .  .  .  .  .  .  .  .  .  .  .  .  .  .  .  .  .  .  .  .  .  .  .  .  .  .  .  .  .  .  .  .  .  .  .  .  .  .  .  .  .  .  . 25

ANNEX 2 .  .  .  .  .  .  .  .  .  .  .  .  .  .  .  .  .  .  .  .  .  .  .  .  .  .  .  .  .  .  .  .  .  .  .  .  .  .  .  .  .  .  .  .  .  .  .  .  .  .  .  .  .  .  .  . 26
      Definitions of Scope 1, 2 and 3  .  .  .  .  .  .  .  .  .  .  .  .  .  .  .  .  .  .  .  .  .  .  .  .  .  .  .  .  .  .  .  .  .  .  .  .  .  .  .  .  .  . 26
      Companies’ Targets and Offsets . .  .  .  .  .  .  .  .  .  .  .  .  .  .  .  .  .  .  .  .  .  .  .  .  .  .  .  .  .  .  .  .  .  .  .  .  .  .  .  .  . 26
      Endnotes .  .  .  .  .  .  .  .  .  .  .  .  .  .  .  .  .  .  .  .  .  .  .  .  .  .  .  .  .  .  .  .  .  .  .  .  .  .  .  .  .  .  .  .  .  .  .  .  .  .  .  .  .  .  . 28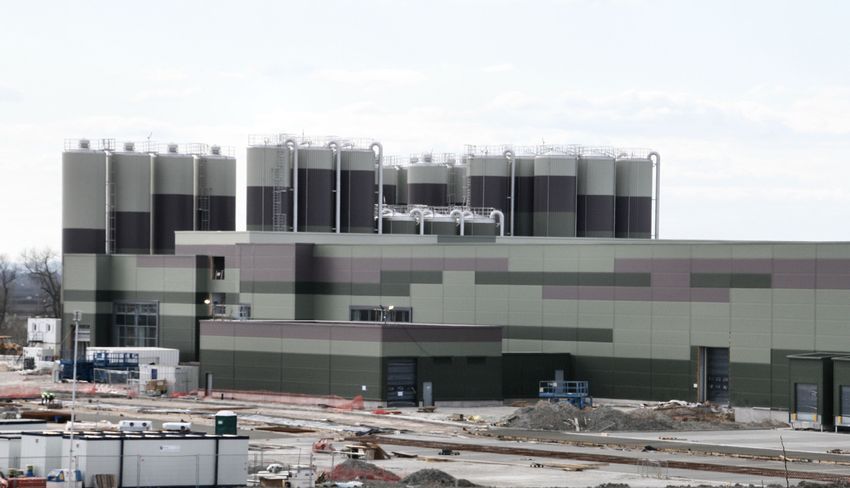
EXECUTIVE SUMMARY
Thirteen of the world’s largest dairy corporations              The emissions rise occurred amidst a dramatic crash in
combined to emit more greenhouse gases (GHGs) in                global dairy prices in 2015-2016. This crash was fueled
2017 than major polluters BHP, the Australia-based              partially by increased production from mega-dairies and
mining, oil and gas giant or ConocoPhillips, the United         global dairy corporations that dumped excess dairy into
States-based oil company. Unlike growing public scru-           the global market, pushing prices down below the cost
tiny on fossil fuel companies, little public pressure exists    of production and forcing out many small to mid-sized
to hold global meat and dairy corporations accountable          dairy farmers. COVID-19 has dramatically compounded
for their emissions, even as scientific evidence mounts         the dairy crisis rural communities face (COVID-19 box).
that our food system is responsible for up to 37% of all
global emissions.                                               Since our first global assessment in 2018 with GRAIN,
                                                                Emissions Impossible: How big meat and dairy are heating
The total combined emissions of the largest dairy corpo-        up the planet, the global dairy industry has continued to
rations rose by 11% (Figure 1) in just two years (2015-2017)    expand and scale up into new territories through mergers
since we last reported on them. Even as governments             and acquisitions, expanding its collective production by
signed the Paris Agreement in 2015 to significantly rein        8% in just two years (Annex 1).
in global emissions, these companies’ increase of 32.3
million tonnes (MtCO2eq) of GHGs equates to the pollu-          None of these companies are required by law to publish
tion stemming from 6.9 million passenger cars driven in         or verify their climate emissions or present plans to help
one year (13.6 billion litres or 3.6 billion gallons of gaso-   limit global warming to 1.5˚C. Fewer than half of these
line). Some dairy companies increased their emissions           companies are publishing their emissions (Annex 1 and
by as much as 30% in the two-year period (Figure 2).            2). Zero out of the 13 have committed to a clear and abso-
                                                                lute reduction of emissions from their dairy supply
                                                                chains or emissions from the animals themselves.

                                        Emissions Intensity
    REDUCING EMISSIONS PER LITRE OF MILK HIDES ENVIRONMENTAL
                   COSTS OF OVERPRODUCTION
Emissions from dairy animals in the supply chain                reduced emission intensity by 11% between 2005-2015, its
account for over 90% of corporate dairy emissions.              overall emissions increased by 18% in that same period.
Yet, only three companies out of the 13 have pledged to
address scope 3 (dairy supply chain) emissions to any           The European Union (EU), United States (U.S.) and
degree (Annex 2). Companies such as Danone and Arla             New Zealand alone account for nearly half (46%) of all
track their supply chain emissions through “emissions           global dairy production. The companies headquartered
intensity” reduction targets. However, what ultimately          in these and other industrialised countries account for
counts for a warming climate is whether these compa-            the lion’s share of global dairy emissions, and these
nies are reducing their overall emissions at a scale that       governments are the best placed to enact policies that
matters, not their emissions reductions per litre. For          enable a Just Transition for dairy producers towards
example, a FAO study reveals that while the industry            much more climate resilient and agroecological prac-
                                                                tices in line with ambitious 2030 and 2050 emissions
                                                                reduction targets.

4                                                                             INSTITUTE FOR AGRICULTURE AND TRADE POLICY
Dismantling supply management,
hastening rural and climate crises
Governments must begin to address both the rural In their absence, global dairy prices have become vola-
and climate crises associated with the dairy sector by tile with boom and bust cycles. From 2008-2018, the
listening to rural communities about their economic global dairy price crashed twice (Figure 4). Competition
and social needs. Fewer and much larger mega-dairies policies (or lack thereof) in favour of large corporations
are flooding the market, pushing out small to mid-sized have further increased corporate buyer power by driving
dairies and hurting rural economies. There is growing mergers and acquisitions, pushing down prices even
support for supply management, a crucial policy that more. Dairy prices for the last decade and more have been
could address dairy’s twin crises. Supply management below the actual cost of production (Figure 5A and 7).
schemes prevent overproduction, balance supply and
demand and stabilise prices.
THE COVID-19 CRISIS IS AMPLIFYING CALLS
FOR SUPPLY MANAGEMENT
As countries shut down and corporations stopped triggers supply controls in various stages when the milk
buying milk, farmers have been forced to dump milk price begins to fall below a certain index. U.S. family
on the streets. The European Milk Board, representing farm groups are pointing to their Canadian neighbors to
over 100,000 producers, is calling on governments advocate for the return of supply management.
to implement a Market Responsibility Program that
Global Dairy Crisis
THE VIEW FROM FOUR REGIONS
As market concentration and production has increased U.S.: 93% of family farms have shuttered since the 1970s.
in every major dairy production region, indebtedness, Yet, overall dairy production in the U.S. continues to
farm loss and bankruptcies in rural communities have rise due to new or expanding mega-dairies. These are
also increased: often funded by outside investors and propped up by a
number of Farm Bill programmes. The lack of environ-
EU: Four out of five dairy farms disappeared between mental enforcement, particularly of their GHG emis-
1981-2013 (Figure 5C). EU’s milk quota removal in 2015, sions, further abets mega-dairies.
along with other factors, contributed to the second global
dairy crisis in 10 years. The EU accounts for over a quarter NEW ZEALAND: Half of the country’s emissions come
of the world’s exports. Its dairy corporations remain from the livestock sector, agricultural emissions having
competitive in the global market by paying EU farmers risen by 12% since 1990 with the doubling of its dairy
below the cost of production and dumping “cheap” dairy herd and a 600% increase in fertilizer use. New Zealand
exports into developing country markets. If the EU is exports 95% of its milk, largely through Fonterra, the
serious about its climate ambition, not only must the world’s second largest dairy processor. Fonterra’s nearly
EU dramatically reform the Common Agriculture Policy 10,000 farmer shareholders incurred huge losses last
(CAP) to incentivise environmental resilience, but also year, calling into question Fonterra’s corporate structure
regulate the market so that companies pay producers and investment strategy. In 16 years (2003-2019), New
their cost of production plus a reasonable profit. Zealand’s on-farm debt increased by NZ$11 billion. In
2019, New Zealand became the first country to set GHG
reduction targets for agriculture in its new Climate Law.
MILKING THE PLANET: HOW BIG DAIRY IS HEATING UP THE PLANET AND HOLLOWING RURAL COMMUNITIES 5INDIA: India’s Amul, a state-supported dairy coopera- market at low prices — sending small dairy producers
tive, recorded the largest increase in emissions due to and local markets into a tailspin. In the last 16 years,
the massive increase in production between 2015-2017. over 5.2 million households with one or two cows have
However, unlike Fonterra or Lactalis, Amul’s emis- stopped dairying. With growing feed and fodder short-
sions are embedded in a complex relationship between ages, feeding animals constitutes 60-70% of the costs
millions of Indian dairy producers and government of Indian dairying, squeezing poorer farmers out of the
policies. Over 16.5 million farmers are integrated into market. The Government of India plans to double its
Indian dairy cooperatives such as Amul and Mother milk processing capacity by 2025 with policies that seem
Dairy, one-third of them women. Between 2013 and to be driving India’s dairy sector away from benefitting
2015, India went from exporting 130,000 tonnes of skim the poor and marginalised towards a highly capitalised
milk powder to just 30,000 tonnes. The rest was recon- industrial system of dairying.
stituted into liquid milk and dumped into the Indian
Way Forward
REDIRECT, REGULATE, REGENERATE
There is an exit out of this dead end: by redirecting public would benefit, and the country would be less dependent
funds away from industrial agriculture, regulating the on a fickle global market.
public health, environmental and social impacts of this
extractive model of production and designing incentives Finally, proper implementation of India’s National Food
to regenerate rural communities through agroecology. Security Act through financial and policy support will
help revitalise local and decentralised dairy markets.
There is growing public support in the U.S., the second Thoughtful and progressive agriculture, climate, trade
largest milk producer, for a dairy supply management and investment policies that holistically uplift the
system to limit production and ensure that small multifunctional role of animals in Indian food and
and mid-sized dairy farmers stay on the land. There farming systems would help support millions of small
are rising calls for a U.S. moratorium on new and and marginal producers. Furthermore, such policies
expanding large-scale confined animal feeding opera- must strengthen the protection of natural resources and
tions (CAFOs). New national-level climate policy also respect human and indigenous peoples’ rights.
must place restrictions on GHG emissions from large-
scale, high-emitting CAFOs. Governments need to begin by integrating climate
goals within their national-level farm policies. These
In the EU, the CAP negotiations present perhaps the last climate goals should address strategies to build climate
opportunity to overhaul the perverse system of public resilience and reduce emissions. Critically, trade rules
subsidies that benefit large operations and perpetuate a must be reformed, having thus far driven an export-
destructive model of agriculture. The next reform, along focused agriculture system while ignoring the climate.
with a genuine European Green Deal, must help catalyse International development aid also needs to support an
a shift towards agroecological systems that support rural integrated set of social and environmental measures
communities, while preventing harm to small producers for agroecological systems that support small-scale
in the Global South. producers in the Global South.
New Zealand’s new climate law must be implemented For a real climate revolution in the agriculture sector,
in tandem with new trade and agriculture policies that governments have to transform farm and climate policy
diversify the economy away from its addiction to dairy in a way that shifts power away from these corporate
exports. This will require a dramatic reduction of the drivers. They must be courageous enough to enact policy
country’s dairy herd and the government to help dairy change towards agroecological systems that empower
producers and workers transition justly to agroecological rural producers to do the right thing for their families,
systems of production and other means of employment. communities and the planet.
New Zealand’s rural communities and the environment
6 INSTITUTE FOR AGRICULTURE AND TRADE POLICYKEY FINDINGS
Thirteen of the world’s largest dairy corporations The total combined emissions of the largest dairy corpo-
combined to emit more greenhouse gases (GHGs) in rations rose by 11% (Figure 1) in just two years (2015-2017)
2017 than either BHP, the Australia based mining, oil and since we last reported on them. Even as governments
gas giant or ConocoPhillips, the United States-based oil signed the Paris Agreement in 2015 to significantly rein
company. Both make the world’s top 20 list of the biggest in global emissions, these companies’ increase of 32.3
fossil fuel emitters, also known as the carbon majors.1 million tonnes (MtCO2eq) of GHGs equates to the pollu-
However, unlike growing public scrutiny on fossil fuel tion stemming from 6.9 million passenger cars driven
companies, little public pressure exists to hold global in one year3 (13.6 billion litres or 3.6 billion gallons of
meat and dairy corporations accountable for their emis- gasoline4). Some dairy companies increased their emis-
sions, even as scientific evidence mounts that our food sions by as much as 30% in the two-year period (Figure
system is responsible for up to 37% of all global emissions.2 2). Emissions data was obtained using the UN Food
Figure 1: The top 13 global dairy companies combined increased greenhouse gas
emissions by 11% in two years
Milk production in millions of tonnes annually
GHG emissions in millions tonnes of CO2-eq
340 195
190
330 185 11% GHG emissions
increase
180
320 175
170
310 165
160
300 155 8% milk production
increase
2015 2017
11%
increase in
combined global 13.6 16
GHG emissions billion litres billion kilograms
of gasoline burned of coal burned
Sources: 13,630,336,448 litres or 3,600,765,163 gallons of gasoline; 15,993,490,018 kg or 35,259,609,896 pounds of coal burned;
converted from 32 million metric tons CO2e using U.S. Environmental Protection Agency Greenhouse Gas Equivalencies
Calculator, for more information see Environmental Protection Agency, “Greenhouse Gas Equivalencies Calculator,”
March, 2020, https://www.epa.gov/energy/greenhouse-gas-equivalencies-calculator (accessed May 19, 2020).
MILKING THE PLANET: HOW BIG DAIRY IS HEATING UP THE PLANET AND HOLLOWING RURAL COMMUNITIES 7and Agriculture Organization (FAO)’s
GLEAM methodology and the IFCN dairy Figure 2: Change in the greenhouse gas emissions of the
research network’s calculation of compa- top 13 global dairy companies in two years
nies’ production quantities (Annex 1).
50%
The emissions rise occurred amidst a
dramatic crash in global dairy prices in
2015-2016. This crash was fuelled partially 40%
by increased production from mega-
dairies and global dairy corporations 30%
that dumped excess dairy into the global
market, pushing prices down below 20%
the cost of production and forcing out
many small to mid-sized dairy farmers. 10%
COVID-19 has dramatically compounded
the dairy crisis rural communities face 0
(COVID-19 box).
Public policies to redirect public funds -10%
Saputo Inc.
Amul (GCMMF)
Fonterra Co-oprative
Group Ltd.
Yili Group
California Dairies
FrieslandCampina
of America
Milchkontor GmbH
Nestle S.A.
Dean Foods
Le Groupe Lactalis
Danone SA
Dairy Farmers
Arla Foods
DMK Deutsches
away from highly polluting indus-
trial agriculture systems, regulate the
negative impacts and regenerate rural
communities and livelihoods through
agroecological systems are critical to
solving the climate crisis and to miti-
gating the worst effects of unanticipated
emergencies like COVID-19. Concrete and a slew of complementary agricultural and competi-
policies designed to address the overproduction of dairy, tion policies that support producers and workers must
including traditional supply management programmes be seriously considered to both increase rural incomes
and lower GHG emissions.
RISING PRODUCTION,
RISING EMISSIONS
Since our first global assessment in 2018 with GRAIN, production and emissions by 15%. Notably, the largest
Emissions Impossible: How big meat and dairy are heating increase in emissions came from Amul, the largest
up the planet, the global dairy industry has continued dairy cooperative in India, ramping up its production by
to expand and scale up into new territories through 43% in just two years (Annex 1), primarily for domestic
mergers and acquisitions, expanding its collective consumption with implications for small producers and
production by 8% in just two years (Annex 1). As a result, independent Indian cooperatives.
the third largest producer, Group Lactalis’s emissions
increased by a whopping 30% (Figure 2) as it expanded None of these companies are required by law to publish
into India, Turkey, Brazil, Mexico, Uruguay, Argentina, or verify their climate emissions or present plans to help
Hungary and Romania.5 Canada-based Saputo’s emis- limit global warming to 1.5˚C. Fewer than half of these
sions increased by 27%, acquiring businesses in the companies are publishing their emissions (Annex 1 and
U.K. and Australia. Even Danone, which has positioned 2).6 Only three have committed to targets that address
itself as a leader on climate mitigation, increased its their supply chains where up to 90% of the dairy sector’s
8 INSTITUTE FOR AGRICULTURE AND TRADE POLICYFigure 3: Top 13 global dairy companies and emission targets
Only five out of 13 companies Zero out of 13 companies have
are reporting their emissions. published plans to cut their
overall (absolute) emissions
from their dairy supply chains.
emissions reside. These are known as scope 3 emissions The UN Framework Convention on Climate Change
(Annex 2). However, zero out of the 13 have committed (UNFCC) is currently discussing agriculture in one of
to a clear and absolute reduction of emissions from its scientific bodies and at the next climate COP could
their dairy supply chains or emissions from the animals decide to include agricultural GHGs in the climate
themselves. Nestlé has committed to scope 3 absolute negotiations. As governments ratchet up their climate
emissions reductions, but given how diversified the goals for 2030 and 2050, the rise of large-scale dairy
company is, it is not clear that these emissions will also and public incentives that further increase corporate
include its dairy supply chain. dairy power, production and emissions must be stopped.
Rural livelihoods and our planet’s future depend on it.
EMISSIONS INTENSITY
Reducing emissions per litre of milk hides
environmental costs of overproduction
Emissions from dairy animals in the supply chain (also overall emissions at a scale that matters, not their emis-
known as scope 3 emissions) account for over 90% of sions reductions per litre.
corporate dairy emissions. Yet, only three companies
out of the 13 have pledged to address scope 3 emissions With increased attention on the meat and dairy sector,
to any degree (Annex 2). Companies such as Danone and some dairy companies such as Danone, Arla and
Arla track their supply chain emissions through “emis- Fonterra have pledged to reduce their absolute emissions.
sions intensity” reduction targets. For example, Danone However, they limit these “absolute” or total reduction
pledges a 50% reduction in “emissions intensity” of its pledges to how they operate their offices and processing
supply chain by 2030. This means in 10 years, every litre plants (scope 1 and 2), thereby excluding their supply
of milk it processes should emit half as many GHGs as it chain emissions (Annex 2). Nestlé is an exception. It
did in 2015. We argued in Emissions Impossible 2018 that includes a scope 3 absolute reduction target, but given its
given the level of technological “efficiency” gains in the highly diversified portfolio that includes coffee, cocoa,
industrial sector, this drastic reduction seems technologi- timber and so many other products, its dairy supply
cally unrealistic. Ultimately, what counts for a warming chain may not necessarily be included.
climate is whether these companies are reducing their
MILKING THE PLANET: HOW BIG DAIRY IS HEATING UP THE PLANET AND HOLLOWING RURAL COMMUNITIES 9Emissions intensity reduction pledges allow for green- Their study further suggests that the highest potential
washing because companies can highlight emissions for reducing dairy industry emissions through emis-
reductions per litre of milk even if their total emissions sions intensity reduction lies in low and middle-income
continue to rise due to increases in milk production and countries. This essentially suggests converting small-
rising numbers of animals in supply chains. This is clearly holder systems in the Global South to intensive and
demonstrated by the Global Dairy Platform, an associa- more industrial dairy systems with more concentrated
tion of some of the largest global dairy corporations. The feed utilisation and higher milk production per cow as
Dairy Platform’s joint study with the FAO reports that key pillars to their strategy. Yet, the European Union,
the industry reduced emission intensity by 11% between United States and New Zealand alone account for nearly
2005-2015; however, its overall emissions increased by half (46%) of all global dairy production. The compa-
18% in that same period.7 This is because these compa- nies headquartered in these and other industrialised
nies dramatically increased their worldwide operations countries account for the lion’s share of global dairy
and the number of animals in their supply chains, even as emissions, and these governments are the best placed
they reduced emissions per litre of milk processed. to enact policies that enable a Just Transition for dairy
producers towards much more climate resilient and
agroecological practices in line with ambitious 2030 and
2050 emissions reduction targets.
DISMANTLING SUPPLY
MANAGEMENT, HASTENING
RURAL AND CLIMATE CRISES
Figure 4: Dairy price volatility and Alongside the rise in production and emissions is the
price crashes shift toward fewer, but much larger mega-dairies that
are flooding the market, pushing out small to mid-sized
60 dairies and hurting rural economies. As mega-dairies
50 increase, much of the opposition to them is led by rural
residents, who are critical of the extensive water and
40
USD/100 kg
air pollution associated with these operations. Govern-
30 ments must begin to address both the rural and climate
crises associated with the dairy sector by listening to
20
rural communities about their economic and social
10 needs. There is growing support, for instance, for supply
0
management, a crucial policy that could address dairy’s
2006 2008 2010 2012 2014 2016 2018
twin crises. This agriculture policy, currently working
in Canada, limits production while providing a viable
Average price 2007 - 2015 income to small and mid-sized dairy farms. Since
Average price 2016 - September 2018 governments in the U.S. and EU have systematically
IFCN Combined World Milk Price Indicator dismantled supply management policies that managed
the amount of milk produced and thus entering the world
Source: Reincke, Katrin, Amit Saha, Łukasz Wyrzykowski.
The Global Dairy World 2017/18, International Farm market, a handful of powerful dairy corporations have
Comparison Network, accessed April 25, 2020. been able to game the system. With an unregulated milk
https://ifcndairy.org/wp-content/uploads/2018/10/Dairy- supply, mass production results in low prices to farmers,
Report-Article-2018.pdf. which in turn induces farmers to expand production
10 INSTITUTE FOR AGRICULTURE AND TRADE POLICYSkeeze / Pixabay
to stay afloat. These economies of scale increase the to subsidise their operations. The weak enforcement
dairy sector’s climate footprint (more cows, more milk). of water and air pollution protections when it comes to
They also lead to declining farm incomes and inflated mega-dairies is another form of government support. In
corporate profits. Competition policies (or lack thereof) essence, governments subsidise Big Dairy’s growth at
in favour of large corporations have further increased the expense of rural communities and the planet. They
their buyer power by driving mergers and acquisitions, do so through a variety of national and regional level
pushing down prices even more. farm policies such as the U.S. Farm Bill and the EU’s
Common Agriculture Policy (CAP).
Supply management schemes prevent overproduction,
balance supply and demand and stabilise prices. In their
absence, global dairy prices have become volatile with
boom and bust cycles. From 2008-2018, the global dairy
price crashed twice: 2014-2016 and just five years prior
from 2008-2009 (Figure 4).
Dairy prices for the last decade and more have been
below the actual cost of production (Figure 5A and
7). In addition, they fail to include environmental
or public health costs of industrial scale production.
Because farmers integrated into these global chains
are paid below production costs, governments step in
MILKING THE PLANET: HOW BIG DAIRY IS HEATING UP THE PLANET AND HOLLOWING RURAL COMMUNITIES 11BOX 1: COVID 19: RISING CALLS FOR SUPPLY MANAGEMENT AMIDST COVID 19 CRISIS
“You can’t shut down cows. You can’t turn them off like a faucet.”
-Zoey Nelson, 27, a sixth-generation dairy farmer in Waupaca, Wisconsin8
Beginning in China, COVID-19 created a massive ripple In one week, as much as 7% of all milk produced in
across the dairy sector as governments shut down the U.S. was dumped, while milk processors encour-
restaurants, cafes, schools and large parts of the food aged farmers to dispose milk, cull herds or stop milking
service industry. China’s lockdown led a massive decline their cows earlier.13 Recently approved U.S. COVID-19
in dairy imports, even as unseasonably mild weather aid programmes would purchase additional fluid and
in parts of the U.S. and Europe allowed for increased powdered milk, cheese and other dairy products
milk production. Lockdowns also created difficulties in in connection with food banks. The impact of these
procurement and logistics in the processing industry, upcoming purchases on the dairy market is still unclear.
compounded by workers getting sick and all coinciding
with a collapse in demand.9 The result: farmers with too The U.S. dairy industry has proposed a Milk Crisis Plan to
much milk and nobody to sell it to. restrict milk supply by 10% in the coming months to gain
access to part of the $9.5 billion government bailout for
Though European dairy prices were on the rise in the farmers. An additional $14 billion discretionary fund is
fourth quarter of 2019, and higher prices were expected available to help commodity farmers and could be part
after a long downturn in the U.S., the series of shutdowns of government purchases of dairy products. However,
sent milk prices tumbling with a glut of liquid milk. In the family farm-based groups worry that the bulk of these
global system where dairy corporations favour over- payments will only reinforce a system of overproduc-
supply and low milk prices, calls for supply management tion that benefits big agriculture at the cost of farmers,
and fair prices are getting louder. especially those whose regional and direct markets
were abruptly eliminated due to the lockdowns. Farmers
In March, the European Milk Board, representing over movements including the California Dairy Campaign,
100,000 milk producers, once again proposed an Wisconsin Farmers Union and National Family Farm
EU-wide Market Responsibility Programme (MRP), a Coalition want direct payments from the virus aid14
coordinated supply management scheme that would to become part of a systemic change to implement a
be enacted in three phases to reduce supply as milk supply management programme. Such a programme
prices fall until the crisis is averted.10 The programme is would limit production and hence new or expanded
based on a market index that considers several factors mega-dairies and the number of cows with the associ-
including production cost margins. An Index over 100 ated need for feed grains. It would also create predict-
means that farmers are meeting costs of production, able and fair prices for farmers.15 The organisations point
including a fair income. Anything below that number to Canada as an example with its long-standing dairy
indicates that production costs are not being met. In the supply management scheme.
first phase of the MRP, an early warning system is acti-
vated if the Index falls by 7.5%, including the opening of The supply management scheme enacted in Canada
private storage, more milk going towards suckling calves since the 1970s is providing a level of stability and income
and fattening heifers. When the Index falls by 15%, the support to farmers, lacking for their American counter-
crisis phase is activated and core measures of the MRP parts. Yet, in spite of the supply management scheme,
are launched, including bonuses for production cuts and the sudden panic buying at grocery stores, followed by
levies for overproduction. The final phase is activated a lockdown, created a market shock.16 Canadian farmers
when the Index falls by 25% and requires obligatory were also asked to dump milk due to sudden oversupply
production cuts by a set amount for a certain duration to manage prices.17 The Canadian example shows that
of time.11 Such a phased in approach is supposed to help milk supply cannot, in fact, be shut down from one day to
deal with unanticipated crises. the next. Supply management schemes must be comple-
mented with measures that lessen milk production
In the U.S., food service and institutional purchases for losses including storage, reserves and social protection
schools, hospitals and the like account for about 30% of programmes that provide a way to direct sudden excess
milk sales.12 With the shutdowns, dairy farmers poured
supply to food insecure people.
milk down drains as the virus came on the heels of a
debilitating six-year dairy price crash (see U.S. section).
12 INSTITUTE FOR AGRICULTURE AND TRADE POLICYTHE GLOBAL DAIRY CRISIS
The view from four regions
As every major dairy producing region (Europe, North America, New Zealand and India) has increased production,
indebtedness, farm loss and bankruptcies in rural communities have also increased. Aided and abetted by governments
and international organisations such as the International Finance Corporation,18 the World Bank’s private arm, dairy
corporations have been allowed to consolidate and ramp up production and emissions.
EUROPE
In the EU, four out of five dairy farms disappeared in Five out of the 13 largest dairy corporations are head-
a thirty-year period (1981-2013) (Figure 5C).19 EU’s quartered in the EU, plus Nestlé in Switzerland (Figure
removal of its milk quota in 2015, along with other 5B). Nearly all of them benefitted from low farm prices in
factors, contributed to the second global dairy crisis in these two years to boost their production and/or acqui-
the last 10 years. Between 1984 and 2009, the dairy quota sitions (Annex 1). This happened while dairy farmers
(the amount of milk allowed into the market) placed across Europe lost their farms or were on the verge of
limits on European production and stabilised prices bankruptcies. The EU and its member states then had
for dairy producers. In 2009, the EU started enlarging to step in with price supports, public subsidies and
the quota in order to eliminate it by 2015. Policymakers ironically initiated a “voluntary” milk reduction scheme
reasoned that the quota was no longer necessary due to which resulted in over 48,000 dairy farmers applying to
an increased global demand for milk that could absorb enter the programme.20
unlimited quantities of dairy. As milk flooded the global
market, the milk price paid to farmers crashed, to the The price crash impacted dairy producers worldwide
benefit of global dairy corporations. (Figure 4). The EU is a significant player in global dairy
markets, accounting for over a quarter of the world’s
An Arla dairy production facility that opened in 2013 in the U.K.
(Mick Baker)rooster / Flickr / CC
MILKING THE PLANET: HOW BIG DAIRY IS HEATING UP THE PLANET AND HOLLOWING RURAL COMMUNITIES 13FIGURE 5: THE EUROPEAN UNION AND DAIRY
Figure 5A: Milk production costs vs. milk price in Germany, Figure 5B: EU dairy corporations
France and the Netherlands
50
Milk production
costs in c/kg
45
5 of 13
40 top GHG emitting
dairy corporations
are based in the EU
35
Farm gate
milk price
in c/kg
30
25
2013 2014 2015 2016 2017
Figure 5C: Disappearing farms
France Germany The Netherlands
1981 2013
Source: European Milk Board. “What is the cost of producing milk?” accessed
February 20, 2020. http://www.europeanmilkboard.org/fileadmin/Dokumente/
Milk_Production_Costs/Gesamtbroschuere/Cost_study_2017_new.pdf/.
In a 30 year period, 4 out of 5 farms
in the EU disappeared
exports. Between 2016 and 2017, the EU increased its Misereor, a German Catholic charity, found that milk
skim milk powder exports by 35%.21 The EU Commis- powder imported from the EU was two to four times
sion expects 90% of additional demand for European less than the price of local milk procured in Burkina
agricultural products to come from global markets in Faso from the Fulani, a pastoralist ethnic group, depen-
the next 10 to 12 years. Getting access to other coun- dent on livestock and dairy farming.23 Companies such
tries’ dairy markets through free trade agreements as Arla, Friesland Campina and Danone have all made
is therefore central to the EU’s agribusiness growth expansion into Sub-Saharan Africa a priority for their
strategy. EU’s dairy corporations remain competitive economic growth plans.24
in the global market by paying EU farmers below the
cost of production and dumping “cheap” dairy exports It is an expansion on the backs of producers North
into developing country markets. In Sub-Saharan Africa, and South. In the EU, farmers paid below the cost of
EU’s milk powder exports increased by 20% between production by these processors are supported through
2007-2017, with countries such as Mali, Cameroon and public subsidies through the CAP which is currently up
Nigeria particularly hard hit.22 This destabilises local for reform. In 2017, 889 million euros went to meat and
dairy markets and rural communities heavily depen- dairy producing farms alone as part of “coupled” direct
dent on dairy animals in these countries. For example, payments from the CAP. This is in addition to millions of
14 INSTITUTE FOR AGRICULTURE AND TRADE POLICYeuros of direct payments provided through the CAP to but also regulate the market so that companies pay
farms with large landholdings. If the EU is serious about producers their cost of production plus a reasonable
its climate ambition, not only must the EU dramatically profit. This would not only curb overproduction, but
reform the CAP to incentivise environmental resilience, also prevent dumping into global markets.
U.S.
In the U.S., the number of family farms in dairy has This mega-dairy growth has come with enormous envi-
declined dramatically since the 1970s, with 93% of these ronmental costs, including growing water pollution in
farms since shuttered. The state of Wisconsin starkly states from Wisconsin to California. The U.S. Farm Bill
illustrates the North American dairy crisis. Between props up mega-dairies by subsidising the management of
2014 and 2019, Wisconsin lost nearly a quarter of its their giant manure lagoons through the Environmental
10,000 dairy farms.25 The crisis is directly linked to Quality Incentives Program. The Farm Bill provides
overproduction, creating a market glut that has pushed government-backed loans to construct new or expanding
prices down. But even though prices have dropped and mega-dairies through its Farm Service Agency. The
dairy farms have been lost, overall dairy production in dairies are further indirectly subsidised by Farm Bill
the U.S. continues to rise due to new or expanding mega- programmes that support below-cost animal feed
dairies (Figure 6). These mega-dairies, often funded by through farm commodity and insurance programmes.
outside investors, are also propped up by a number of
Farm Bill programmes and the lack of strong environ- In addition, the lack of environmental enforcement,
mental enforcement. particularly of their greenhouse gas emissions, further
abets mega-dairies. Only the state of California has
a regulatory approach through its climate policy to
reduce emissions associated with mega-dairies. But
FIGURE 6: THE UNITED STATES AND THE DAIRY INDUSTRY
Change in number of dairy farms over 20 years
125,000
dairy farms
54,000
dairy farms
38%
decrease in net
farm income
Source: Siena Chrisman. “The FoodPrint of Dairy,” FoodPrint, accessed March 23, 2020.
https://foodprint.org/wp-content/uploads/2019/07/2019_07_17_FP-Dairy-Report_1.pdf.
“Rebuilding America’s Dairy Farms,” Dairy Together, accessed March 23, 2020.
https://3725e235-d9ba-4970-b621-58e8d9573e38.filesusr.com/ugd/629d75_
e217c5b7093945dda62698dca467106a.pdf.
MILKING THE PLANET: HOW BIG DAIRY IS HEATING UP THE PLANET AND HOLLOWING RURAL COMMUNITIES 15Figure 7: Milk: Cost of production vs. price paid even in California, these mega-dairies are further
supported through public subsidies for controversial
to farmers in the U.S. from 2010-2017
methane digestors, which allow air and water pollution
$27 to continue even as they perversely incentivise addi-
$26 tional manure production.26 There are currently no such
Cost of Production
$25 national-level regulations, nor are there national-level
reporting requirements for mega-dairies.
$24
$23 In the U.S., Dean Foods’ lower 2017 carbon footprint
of 2% has a backstory. In 2016, Dean Foods terminated
$22
contracts with as many as 100 dairy farmers as Walmart,
$21 the retail giant, vertically integrated into dairy, directly
$20 contracting dairy producers for the milk sold in its
Milk Price
$19
stores.27 In November 2019, Dean Foods filed for bank-
ruptcy while initiating talks to merge with the Dairy
$18
Farmers of America (the world’s largest dairy emitter
$17 and milk producer).28
$16
2010 2011 2012 2013 2014 2015 2016 2017
Source: USDA Economic Research Service. “Dairy Data,”
accessed February 20, 2020. https://www.ers.usda.gov/
data-products/dairy-data/.
NEW ZEALAND
Half of New Zealand’s emissions come from the live- its new Climate Law as the following: reducing methane
stock sector, its agricultural emissions having risen by 10% below 2017 levels by 2030; and by 24-47% below
by 12% since 1990. The government attributes this rise 2017 levels by 2050.31 For New Zealand’s methane reduc-
to a doubling of its dairy herd and a 600% increase in tion targets, how Fonterra does business matters (Box 2).
fertilizer use.29 New Zealand exports 95% of the milk it
produces, largely through Fonterra,
the world’s second largest dairy
processor, supplying one-third
of all global exports (by revenue)
in 2018. In two years (2015-2017),
Fonterra increased its emissions
by 7% (Figure 2) due to a commen-
surate rise in its production. The
company claims that it accounts for
20% of New Zealand’s GHG emis-
sions “with 90% of those emissions
from farms; 9% from manufac-
turing and 1% from distribution to
markets across the world.”30
In November 2019, New Zealand
became the first country to set GHG A Fonterra production facility in New Zealand
reduction targets for agriculture in
Elizabeth Clark / Wikimedia Commons
16 INSTITUTE FOR AGRICULTURE AND TRADE POLICYBOX 2: FONTERRA’S CLIMATE TARGETS, GROWTH AND IMPACTS
Fonterra has indicated that it supports the new climate law, but that reaching both the 10% methane reduction
target by 2030 and the minimum 24% target by 2050 is “very ambitious” and will require further research and
development. The company states that to achieve these targets and more, “the agriculture sector will need to
deploy a comprehensive package of breakthrough mitigation activities, including some that are not yet techni-
cally and commercially viable.”32 Fonterra’s own climate target aims to achieve a 30% absolute reduction in scope
1 and 2 emissions by 2030 from 2015 GHG levels — so reductions are limited to its operations and processing
facilities, even though 90% of its emissions come from its supply chain. With the climate law in place, however, the
company is looking into technological fixes such as methane inhibitors to help cows burp less.
These techno fixes, however, present their own dilemmas for the company:
“While there are some promising ideas, such as cow breeding, feeds and inhibitors, we also face some
dilemmas. For example, to maximise the effectiveness of inhibitors administered through supplementary
feed, the cows would need to spend more time in sheds or on feed pads being fed the special feed. This not
only increases the farming costs, it is at odds with the growing consumer interest in pasture-based cows.
This means our focus is on inhibitors that can be fed at milking time, and then reduce emissions while the
cow is back out on the pasture.”33
Fonterra spent the greater part of the last two decades expanding into global markets. Its export-led strategy
has not only led to rising emissions, but also an economic crisis for New Zealand’s dairy producers. Fonterra’s
decade long corporate expansion into China, Latin America and Australia, for instance, resulted in one-third of its
suppliers unable to pay their bank debts.34 Its nearly 10,000 farmer shareholders incurred huge losses last year,
calling into question Fonterra’s corporate structure and investment strategy.35
In 16 years (2003-2019), New Zealand’s on-farm debt and other regulatory requirements on the sector over the
increased by NZ$30.1 billion to total over $41 billion, longer term.”37 Even as New Zealand becomes the first
according to New Zealand’s Ministry of Primary Indus- national government to regulate agricultural methane
tries.36 The ministry notes that this level of indebtedness emissions, unless the government comes up with an
makes implementation of New Zealand’s environmental economic transition plan for rural dairy producers that
policy much more difficult: “Financial pressures associ- incentivizes less production and better pasture manage-
ated with this highly indebted sector may constrain the ment, it is difficult to see how the government fulfils its
ability of financially vulnerable farms to invest and adapt climate goals.
to the changes associated with increased environmental
INDIA
India’s Amul, a state-supported dairy cooperative, India produces over 20% of the world’s milk and yet
recorded the largest increase in emissions due to the less than half of what it produces is marketed through
massive increase in production between 2015-2017. the organized (cooperatives and private dairies) dairy
However, unlike Fonterra or Lactalis, Amul’s emis- sector.38 The rest is sold through local and informal
sions are embedded in a complex relationship between networks, with buffalos providing a significant amount
millions of Indian dairy producers and government poli- of the milk. Ten years ago, 70 million households
cies that determine their fate. produced India’s dairy with an average of 1-2 cows each,
up to 70% of them small and marginal farmers and
landless labourers.39 Women in particular dominate the
MILKING THE PLANET: HOW BIG DAIRY IS HEATING UP THE PLANET AND HOLLOWING RURAL COMMUNITIES 17sector and rely on dairy animals as a critical economic 2.2%). 49 In January of this year, India’s Finance Ministry
safety net and income. 40 announced its plans to double its milk processing
capacity by 2025.50
Over 16.5 million farmers are integrated into
Indian dairy cooperatives such as Amul and
Figure 8: Dairy - Exports for India
Mother Dairy, at least one-third of them are
Forecast for last 5 Years. Reported on: 7/2019
women. 41 Nearly a quarter of these producers
are members of Amul. 42 Like Fonterra, Amul (K.MT)
started venturing into global markets in the 70
2000s. It started selling milk powder on a global
dairy trade platform in 2013, 43 shortly before 60
milk prices started crashing in 2014.
50
As the global price for skim milk powder crashed
in 2014, private and cooperative dairies such as 40
Amul’s management made a decision to stop
exporting milk powder (Figure 8).44 Instead, the 30
powder was reconstituted into liquid milk with
20
the addition of butter fat and sold domestically.
Between 2013 and 2015, India went from exporting
10
130,000 tonnes of skim milk powder to just
30,000 tonnes.45 The remaining 100,000 tonnes 0
was reconstituted into liquid milk and dumped 14 15 16 17 18 19
into the Indian market at low prices — sending
Market Years
small dairy producers and local markets into a
tailspin. Because of the sudden need for butter Dairy, Butter Dairy, Milk, Fluid Dairy, Milk, Nonfat Dry
fat, cheap imports of butter fat also increased,
Source: FAS USDA, PSD Online (Production, Supply & Distribution),
further disrupting local markets. Protests
accessed in July 2019.
erupted in several parts of the country, and many
small dairy producers gave
up dairying.46
To alleviate the social
upheaval created in the
domestic market, the govern-
ment offered a 20% export
subsidy in 2016 for several
dairy products. 47 The plan
seems to have worked as the
global dairy supply started
contracting in 2017 and
India’s milk powder exports
went up by 292% between
2017-2018. 48
In the last several years,
Indian milk production has
increased at double the rate Between 2000 and 2016, families owning 1-2 cows declined
of the global average (India’s by 7% (about 5.25 million poor households).
4.2% compared to the world’s
Yann Forget / Wikimedia Commons / CC-BY-SA.
18 INSTITUTE FOR AGRICULTURE AND TRADE POLICYIndustry data reveals that the dramatic rise in produc- foreign high yielding cattle breeds (currently around 40
tion has created equally dramatic changes in dairying million)57 with the subsequent need for more feed.
households over the last 20 years. Families owning 1-2
cows declined by 7% between 2000-2016 (from 52% of all As feed constitutes 60-70% of the costs of Indian
dairying farms to 45%).51 With approximately 75 million dairying, poorer farmers are being squeezed out of the
dairying households in the year 2000, the decrease market.58 Rather than focus on how to revitalise these
represents 5.25 million poor households. Half of the milk local markets, the Indian government plans to increase
produced by these households was consumed in the investments in productivity of fodder crops and grass-
family,52 thus it is likely that they also lost an important lands and increase the use of concentrated feed.59 Such
source of nutrition. In the same period, families owning policies would favour producers who have capital. The
2-10 cows and 31-100 cows, respectively, have gone up dramatic projections for increased feed and fodder are
by 3% each.53 According to Dairy Global, “The number based on the premise of ever-increasing production
of family farms with 10-50 cows is constantly growing; targets and increased productivity of existing cattle.
in some regions by up to 30% each year.”54 While these These projections and proposed solutions, however, do
are small numbers for a typical farm in the United not address competing pressures on land and water
States, these are dramatic increases in dairy herds for where 3.3% of all land is classified as permanent pasture,
India where fodder and water are short in supply and add 21% forest and 40% as grazing land on which margin-
significantly to input costs. alised and indigenous populations depend.60 These are
also biodiversity hotspots. According to IGFRI, livestock
With dairy becoming highly capitalised and input depen- is “often the only source of cash income” for 126 million
dent, feed and fodder shortages have indeed become small and marginal farmers and serves as “insurance in
acute.55 The Indian Grassland and Fodder Research Insti- the event of crop failure.”61 Yet, the Indian government’s
tute (IGFRI) estimates nearly a 30% deficit in fodder and policies seem to be driving India’s dairy sector away from
36% deficit in concentrated feed compared to produc- benefitting the poor and marginalised towards a highly
tion needs,56 with some states registering over 60% defi- capitalised industrial system of dairying. Given that this
cits compared to demand. As India relentlessly pursues trajectory has led to rising emissions, farm loss, farm debt
increased milk production, the 151 million indigenous and rural disintegration in high-income dairy producing
cattle are increasingly being replaced or cross-bred with countries, similar impacts are devastating millions of
producers who depend on dairy for their livelihoods.
WAY FORWARD
Redirect, Regulate, Regenerate
Two years after our first GHG estimates of the big the lives of rural dairy producers and rural communi-
dairy emitters, these corporations have continued to ties. However, this requires governments of major milk
increase their emissions when we should be heading producing regions of the world to fundamentally shift
the other way. This is happening as rural dairying away from flawed systems of incentives that allows large
disintegrates into larger operations in the control of a dairy processors to game the system. Narrow-minded
handful of corporate dairy processors. And yet, there is productivist and export-led strategies buttressed by
a way out of this dead-end through redirecting public public money and deregulation drive further corporate
funds away from industrial agriculture, regulating the consolidation of the dairy sector. Now is the time for
public health, environmental and social impacts of this governments to address these emissions in ramping up
extractive model of production and designing incen- their climate targets for 2030 and 2050.
tives to regenerate rural communities and agriculture
through agroecological practices. Making this shift
will not only reduce dairy emissions, but also improve
MILKING THE PLANET: HOW BIG DAIRY IS HEATING UP THE PLANET AND HOLLOWING RURAL COMMUNITIES 19Governments need to begin by integrating climate goals dairy exports. This will entail a dramatic reduction of
within their national-level farm policies. These climate the country’s dairy herd while at the same time helping
goals should address strategies to reduce emissions dairy producers and workers transition justly to agro-
as well as build climate resilience. As important will ecological systems of production and other means of
be to reform trade rules which have driven an export- employment that can strengthen New Zealand’s rural
focused agriculture system, including for dairy — while communities and environment and make the country
ignoring the climate. Governments aid and develop- less dependent on a fickle global market.
ment programmes also need to support an integrated
set of social and environmental measures for agroeco- Finally, India’s proliferation of ever larger private and
logical systems that support small scale producers in international dairy processors and a few large and
the Global South. highly capitalised state-supported dairy cooperatives
are steadily replacing millions of local and diverse chan-
There is growing public support in the U.S., the second nels of dairy distribution through small farmers, milk
largest milk producer, for a dairy supply management vendors and independent cooperatives. India’s free trade
system to limit production and ensure that small and negotiations involving the EU, New Zealand and the U.S.
mid-sized dairy farmers stay on the land. The Dairy further threaten these local markets. Yet, implementing
Together campaign led by the Wisconsin Farmers India’s National Food Security Act through financial and
Union and the National Family Farm Coalition have put policy support that helps revitalise local and decentral-
together different variations of a dairy supply manage- ised dairy markets, thoughtful and progressive agricul-
ment proposals. Coupled with a supply management ture, climate, trade and investment policies that “protect
system is the need for farm policy to greatly expand the holistic, multifunctional roles of animals in food and
conservation and rural development investments that farming systems” would help revitalise rural communi-
support lower-emitting, more climate-resilient systems ties and support millions of small and marginal produc-
of farming, including mid and small-sized organic and ers.62 Furthermore, such policies must strengthen the
grass-fed dairy operations, which also are struggling protection of natural resources such as land, water, air,
with low prices, lack of infrastructure and markets. forests, biodiversity and seeds and respect human and
indigenous peoples’ rights. For a full set of recommen-
Regulations must also target emissions associated with dations, see Food Sovereignty Alliance 2017.
mega-dairies. There are rising calls for a U.S. mora-
torium on new and expanding large-scale confined There is scientific consensus that our global food system
animal feeding operations. Recent legislation proposed and land use change is having a dramatic impact on
by Senator Corey Booker would place a moratorium on climate change. And yet, those producing our food
new large-scale CAFOs, provide resources for farmers have been at the receiving end of flawed policies and an
to transition to new agriculture systems and phaseout ever-narrower set of powerful corporate actors driving
of existing big operations by 2040. New national-level these emissions and ecologically destructive farming
climate policy also must place restrictions on GHG practices at a scale that is unsustainable for the planet,
emissions from large-scale, high-emitting CAFOs. while economically bankrupting rural communities.
For a real climate revolution in the agriculture sector,
In the EU, the ongoing CAP negotiations present perhaps governments have to fundamentally transform farm
the last opportunity to overhaul the perverse system of and climate policy in a way that shifts power away from
public subsidies that benefit large operations integrated these corporate drivers towards agroecological systems
into a destructive model of agriculture. The next reform, that empower rural producers to do the right thing for
in sync with Europe’s ambition for a genuine European their families, communities and the planet.
Green Deal, must help catalyse a shift towards agroeco-
logical systems that support rural communities, while
preventing harm to small producers in the Global South.
New Zealand’s new climate law must be implemented
in tandem with new trade and agriculture policies
that diversify the economy away from its addiction to
20 INSTITUTE FOR AGRICULTURE AND TRADE POLICYYou can also read