Ministerial Advisory Committee Technical Working Group on the Second Wave
←
→
Page content transcription
If your browser does not render page correctly, please read the page content below
Ministerial Advisory Committee
              Technical Working Group on the Second Wave

                                               Report

               Epidemiological assessment of the likelihood of a second
              COVID-19 wave, and recommendations regarding COVID-19
                         surveillance and response activities
                                          22 October 2020

Executive Summary
Following introduction of COVID-19 into South Africa in early March 2020, and the peaking of cases
during the week 5-11 July 2020 (over 13,000 cases daily), the daily case load has declined to below 1000
cases per day, with 7% positivity rate. Many countries where COVID was initially contained through public
health interventions are now experiencing a ‘second wave’ of COVID infection The Ministerial Advisory
Committee (MAC) was tasked in late August 2020 with responding to the question ‘What does ‘being
ready for the ‘COVID-19 second wave’ ‘mean in terms of prevention, detection and response activities? A
MAC technical working group (TWG) sought to define a second wave and associated epidemiological
features, investigate epidemiological factors associated with a second wave in countries where these
have occurred, delineate surveillance activities to support detection and monitoring of a second wave,
and finally to make recommendations regarding prevention detection and response activities.

We defined a ‘second wave’ as a new wave lasting one or more days, commencing after the ‘end of wave’
after the previous peak where case load returns to 30% of the previous peak case load. We also defined
other parameters to signal a rising case load, namely an uptick, upswing and resurgence.

The group identified 113 countries for analysis that have more than 1 million inhabitants, and a COVID-19
incidence of >10/million cases and described the epidemiology of first and second waves for 49 (first
epidemic wave concluded) and 24 (one or more additional wave). Amongst ten countries identified for in-
depth case studies, the seroprevalence studies (where available) were all under 10% and the decline in
cases leading to the end of the first wave is believed to have been driven by non-pharmaceutical
interventions (restrictions imposed to curb the spread of the virus). The TWG also reviewed available
serological data on RSA populations and concluded that widespread transmission over a period of more
than three months has likely left South Africa with substantial population-level immunity albeit unevenly
distributed. In the light of these observations, the TWG concluded that the factors driving the decline in
incidence in South Africa differ meaningfully from factors driving the decline in all case study countries
and may have been driven by population-level immunity.

Regarding historical data from the 1918 H1N1 influenza pandemic, commentators speculated that the
occurrence and nature of a second wave is driven by the level of immunity in the population. If initial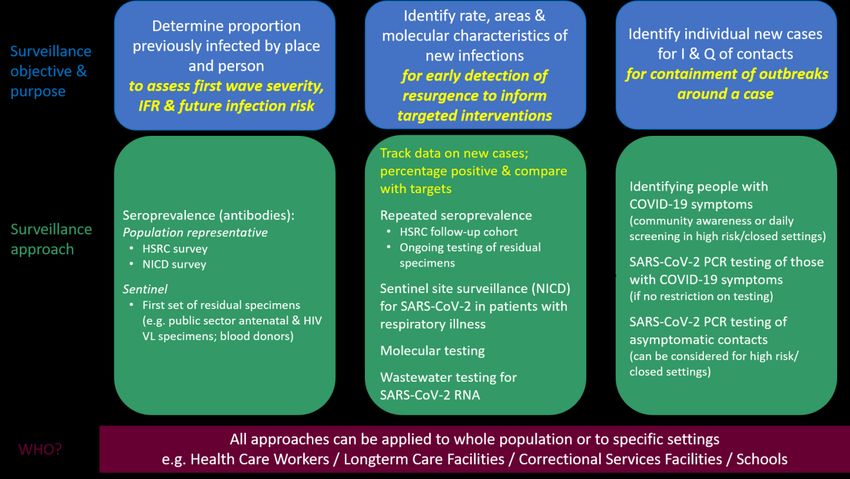
interventions were not severe enough to halt transmission (or if restrictions are lifted slowly enough),
immunity accumulated in the population through a longer first wave with a lower peak, leading to herd
immunity, such that a subsequent wave was not possible and did not occur.
A number of factors that could be informative to identify ‘at risk’ communities include local (ward-based)
data on 1) the number of laboratory-confirmed cases per population to date, 2) the number of tests
performed per population to date, 3) the degree to which wards are connected to other wards through
population mobility (e.g., as can be measured through mobile phone data), 4) cumulative test positivity to
date, 5) population density, and 5) indicators of social vulnerability. Synthesizing data across these
parameters may provide sufficient context to help identify areas of relatively high and low risk.
In the light of the above findings, the TWG believes that resurgences are expected and a second wave
may occur; however, it is unlikely that a second wave will occur within the next 6-8 months, unless
immunity wanes extremely rapidly. If a second wave does occur, it is expected to peak at a lower level
than the first wave. Reduced adherence to nonpharmaceutical interventions, waning immunity, and
seasonality of transmission could increase the risk of a second wave or a substantial post-wave
resurgence as we move into winter of 2021. Beyond the time frame of 6-8 months, it is difficult to assess
the likelihood of a second wave.
The TWG summarised the current COVID-19 surveillance methodologies that are currently underway in
South Africa, and tabulated their strengths and weaknesses. These include case-detection (current active
cases), incidence rate and proportion tested positive (PTP)), notifiable medical conditions surveillance,
hospital admissions due to COVID, deaths due to COVID-19, NICD sentinel site surveillance for SARI and
ILI, molecular surveillance (NGS-SA), wastewater surveillance (SACCESS) and population-based
serosurveys. Lastly, the TWG identified how these surveillance indicators can be meaningfuly used at
national, provincial and district levels of the health system.
This TWG is of the opinion that a second wave within the next 4-6 months cannot be ruled out, but may
not be as large as the first wave (in terms of burden of cases). Strengthened surveillance mechanisms
need to be in place to support detection and prevention interventions. In support of this assessment, the
TWG has the following recommendations regarding strengthening COVID-19 surveillance.
That current surveillance activities be continued as described in this TWG’s Appendix, and that
slight modifications of indicators contained in the IMT Resurgence Plan be made.
That daily interpretation of the surveillance indicators (end-of-wave, uptick, upswing, resurgence,
new wave etc) as described by this advisory and detailed in the appendix be undertaken by
national and provincial epidemiology teams and that these data be used at all levels of the health
system to guide preparedness and response activities
That testing criteria be broadened nationally and implemented provincially to ensure
representative testing across at-risk areas
That a COVID-19 surveillance forum lead by the NICD/NDoH/IMT, including all
institutions/stakeholders doing surveillance, provincial DOH and academics, be established and
meet as soon as possible to correlate and interpret surveillance data across all modalities.
That data collection methodology at the point of specimen collection be strengthened to ensure
accuracy and improved data quality. This includes the use of electronic data capture at point of
specimen collection and inclusion of additional data elements (e.g. origin of specimens such as
outbreak investigations in schools, institutions, workplaces and care facilities) to facilitate
identification of localised outbreaks.
That immediate and ongoing investment be made in IT and business intelligence data systems to
support national and provincial surveillance and response activities. These should incorporate or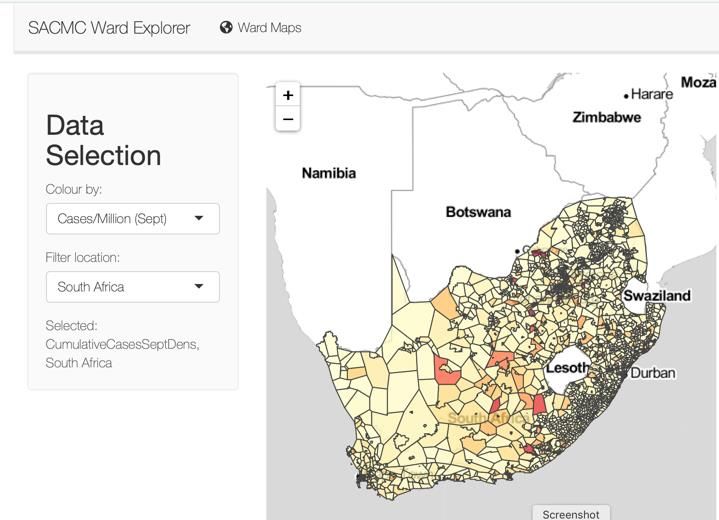
expand on existing systems including COVIDConnect, NICD’s Notifiable Medical Conditions
Surveillance System (NMC-SS)
That national, provincial and district teams endorse, support and communicate the benefits of
COVIDConnect to the general population and health care workers to ensure uptake, and that
contact tracing teams integrate COVIDConnect into contact tracing and responses.
That cause of death data should be strengthened by ensuring rapid capture of death notification
forms, and that cause-of-death findings at sub-district level be made available in good time to
national and provincial health departments.
That provinces develop resurgence action plans with clear terms of reference. Plans should
include a surge response team with named personnel to support COVID-19 containment efforts
should a second wave require additional human resources. These surge response teams should
include epidemiologists, public health specialists, data analysts, health system analysts,
communication specialists, behaviour change experts as well as clinicians, community health
workers, contact tracers, and case investigation leads. Response plans should take into account
differing urban and rural health systems by accommodating traditional community and religious
leaders where appropriate.
Contents
Executive Summary ......................................................................................................................................... 1
Background and introduction ......................................................................................................................... 5
Terms of reference and scope of this advisory ............................................................................................... 5
Structure of this ‘In-depth appendix’ .............................................................................................................. 5
Part A – Theoretical and evidence-base for recommendations pertaining to a COVID second wave ........... 6
Section 1- Epidemiological factors associated with a second wave ........................................................... 6
Outline of Section 1................................................................................................................................. 6
Defining the ‘second wave’ and terminology ......................................................................................... 6
Epidemiology of a ‘second wave’ (as of 15 October 2020) ..................................................................... 9
Section 2 -COVID surveillance activities to support detection of a second wave .................................... 17
Structure of Section 2 ........................................................................................................................... 17
Definition of surveillance ...................................................................................................................... 17
Aim and objectives of surveillance ....................................................................................................... 17
Approaches to COVID-19 surveillance and surveillance methodologies .............................................. 17
Serological surveillance to understand population vulnerability ......................................................... 19
Detection of new infections and interpretation of the significance of these ....................................... 19
Using surveillance data to detect and respond to a resurgence / second wave ...................................... 22
Conclusion ................................................................................................................................................. 22
Part B Recommendations regarding preparations for a COVID second wave .............................................. 23
Introduction .............................................................................................................................................. 23
Recommendations regarding COVID-19 surveillance in South Africa. ..................................................... 23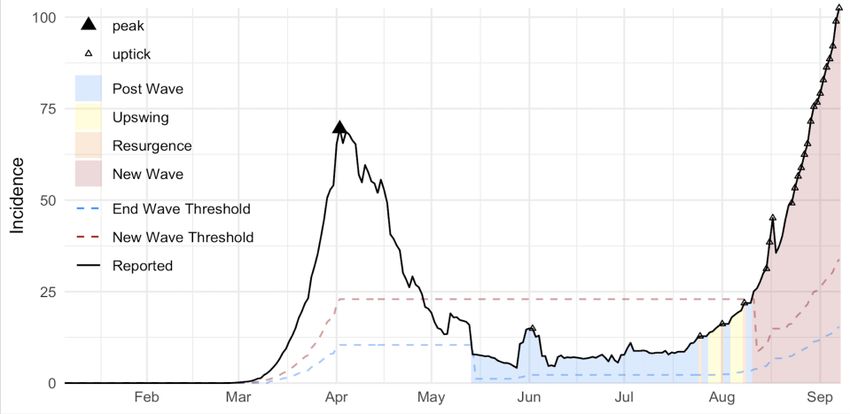
General comments ................................................................................................................................ 23
   A COVID-19 Surveillance Forum ............................................................................................................ 23
   Application of ‘second wave’ definitions at provincial and district levels to support meaningful
   interpretation of case-based surveillance data .................................................................................... 23
   Integration of surveillance data into provincial outbreak response activities ..................................... 23
   Case-based surveillance and COVID-10 testing criteria ........................................................................ 23
   Strengthening data quality for case-based surveillance ....................................................................... 23
   Strengthening mortality surveillance .................................................................................................... 24
Conclusion ................................................................................................................................................. 27
Background and introduction
The COVID-19 pandemic has swept through South Africa commencing 5 March 2020 with the
introduction of the virus through returning travellers from endemic regions and subsequent
amplification. A national lockdown implemented from 27 March to 30 April 2020 slowed but did not halt
transmission of the virus. Detected cases of COVID peaked around epidemiological week 28, (5-11 July
2020) with a maximum proportion test positivity of just over 30%. Subsequently the daily case load has
declined to below 100 cases per day, with 7% positivity rate. Many countries where COVID was initially
contained through public health interventions are experiencing a ‘second wave’ of COVID infection – a
phenomenon seen with the 1918 ‘Spanish influenza’, and the 2009 H1N1 influenza resurgence. The
Ministerial Advisory Committee (MAC) was tasked with responding to the question ‘What does ‘being
ready for the ‘second wave’ ‘mean in terms of prevention, detection and response activities?
Terms of reference and scope of this advisory
A technical working group ‘TWG’ of the MAC was convened and met on 24th and 28th August, and 9th
September to agree on scope of work and how to structure a response. It was agreed to provide an
evidence-based review into epidemiological factors associated with a second wave, identify and
recommend surveillance methodologies and indicators, and to provide insightful and critical commentary
on the COVID-19 resurgence plan in development by the National Department of Health.
Whilst there was a wish to recommend practical ways to strengthen COVID-19 preparedness and
response activities at district and provincial level, and to advise on behavioural interventions, it was
recognised that several initiatives were already underway which met this need, namely the WHO ‘Intra-
action review’ (IAR) and work being done by the newly constituted COVID-19 Behavioural Interventions
Ministerial Advisory Committee.
Structure of this ‘In-depth appendix’
The ‘in-depth appendix’ accompanies the advisory and recommendations and is structured as follows:
Part A – Theoretical and evidence-base for recommendations pertaining to a COVID second wave
o Section 1- Epidemiological factors associated with a second wave
o Section 2 -COVID surveillance activities to support detection of a second wave
Part B Recommendations regarding preparations for a COVID second wavePart A – Theoretical and evidence-base for recommendations pertaining to a COVID second wave Section 1- Epidemiological factors associated with a second wave Outline of Section 1 In this section, we define a ‘second wave’, and terminology that is useful for monitoring epidemiological trends including a ‘resurgence’, ‘uptick’ and an ‘upswing’ and explain the methodology behind reaching these definitions. We examine factors associated with ‘second waves’ in countries where these have occurred, and we look at epidemiological factors that may contribute to a second wave in South Africa. We comment on the likelihood and timing of a possible second wave in South Africa. Defining the ‘second wave’ and terminology Methodology regarding thresholds for definitions The goal of this analysis is to provide a non-mechanistic, case-study based risk assessment for countries which indicates the likelihood within various time periods of ending a current epidemic wave or, if they have ended the current wave but not completely eliminated transmission, of entering a new epidemic wave. We have selected pragmatic operational thresholds, rather than theoretically-based ones. Wave Peak We identify peaks retrospectively using the Zig Zag (ZZ) algorithm, which identifies changes in trends by constructing a time series of increases and decreases that smooths over small fluctuations1. Once the ZZ time series is constructed, peaks are defined as local maxima in the ZZ time series, which are greater than 10 7-day average incidence per million, and for which the trend increases for at least a specified number of days (d) prior to the maximum and decreases for at least the same number of days following the maximum. In this analysis, we use d = 14 days. End-of-Wave Threshold Achieving the end-of-wave threshold corresponds to having a time period (E.g. a week or two weeks) where the 7 day moving average of cases is sustained at or lower than a small fraction of recent peak incidence. We set the end-of-wave threshold as 15% of the peak incidence or case load, measured in terms of 7-day moving average of case incidence. We specifically use last-7 day average incidence per 1 million capita as reported in Our World In Data2; for the purposes of this analysis, using the 7-day running average (either absolute or per capita) would be equivalent. New Wave Threshold If the epidemic reaches the end-of-wave threshold, it may still return to an incidence level that is a sufficiently high fraction of the previous wave peak incidence to warrant revisiting control efforts. This is defined in the same way as the end-of-wave threshold, though at a different fraction, and it does not reset until 1) the end-of-wave threshold has been met and 2) incidence then rises above the new wave threshold. For the purposes of our statistical risk assessment, we then need to characterize distinct waves within or between peaks. The prospective operational indicators are upticks, upswings, resurgence, and exceeding the new wave threshold (defined in subsequent sections). 1 https://www.investopedia.com/terms/z/zig_zag_indicator.asp 2 https://ourworldindata.org/coronavirus
Uptick and Upswing
A period is labelled an uptick if a target number of consecutive increases in incidence OR test positivity
has been observed. An upswing is similar, though defined in terms of exceeding a target of net increases
(number of periods with increases - number of periods with decreases) over a window; so an upswing
window can still include no-change periods or even decreases, depending on the threshold settings. This
approach has been followed elsewhere.3
For upticks, we use a threshold of 5 days of consecutive increases in last-day average incidence per
million (measured in terms of positive tests) OR the proportion of tests that are positive. For upswings,
we use a threshold of net 6 increases in a window of the previous 8 days (of 7-day average incidence per
million or positivity); this means there is at most one decrease in incidence during that period (with all
other days having increases) or at most two days of no change (with all other days having increases).
Resurgence
A resurgence occurs when a previously declining or roughly stable level of incidence and test positivity
changes to a consistently increasing trend. We operationalize this to mean 1) an uptick that occurs within
an upswing that 2) occurs before the end-of-wave threshold has been reached (a midwave resurgence)
OR that exceeds the most recently met end-of-wave threshold (a post-wave resurgence).
Using defined parameters to guide response efforts
To support response efforts, we are generally interested this question: how do observable prospective
indicators (such as upticks, upswings, and their combination in resurgences) indicate the likelihood (over
a certain time interval) to either fail to meet the end-of-wave threshold or, if a setting has met the end-
of-wave threshold, to exceed the new wave threshold.
To calculate this likelihood, we need the correct denominator in our case study series. Once a wave is
underway (either the run up to the first wave or after the new wave threshold is exceeded), upticks,
upswings, and resurgences are no longer tallied for our analytical purposes, as the target event is
occurring. Once the wave peak is reached, however, we resume tallying these indicators to contribute to
our estimate of what will happen after such a wave.
Definitions
Throughout this document, we distinguish between the following types of dynamics (see ‘Definitions and
methods’ for technical definitions) (Box 1) which are illustrated in Figure 1. Thresholds and precise
definitions are listed in Table 1.
Box 1. Epidemic dynamics related to COVID-19 epidemiology
An epidemic wave is an increase in cases that reaches some threshold value. The wave is said to
have ended when the case incidence* drops below a threshold value defined relative to the
maximum case incidence* experienced during the wave.
A second wave is a major increase in case incidence* (above a threshold value defined relative
to the maximum case incidence* experienced during the first wave), following the end of the
first wave of the epidemic.
A resurgence is a substantial increase in cases before the current wave has ended (midwave
resurgence; may occur in the first wave or subsequent waves) or in the inter-wave period
(postwave resurgence).
An upswing is an increasing trend in case incidence* or test positivity.
An uptick is continuous increase in case incidence* or test positivity over the course of 5 days or
more.
* based on the 7-day moving average
3 (https://www.dph.illinois.gov/regionmetrics?regionID=1).Figure 1. The French epidemic curve, illustrating epidemic dynamics as defined in Box 1 (data from ‘Our World in
Data https://ourworldindata.org/coronavirus)
Table 1. Epidemic dynamics – definitions and thresholds
Event Definition* Threshold
Wave peak Retrospectively defined as the highest value during which A peak as per
increases were consistently observed for the 14 day definition, which is at
period prior to the value, and decreases were least greater than 10
consistently observed for the 14 day period after the confirmed cases per
value , after accounting for small fluctuations in the time million population
series. For a peak to be considered a ‘wave peak’ it must
reach at least 10 confirmed cases per million population.
End of wave A period (currently one day) where the case load is 15% of peak
(sustained) at or lower than a specific fraction of recent incidence or case load
peak incidence
Uptick A target number of consecutive increases in incidence OR An increase in cases
test positivity have been observed for 5 consecutive days
Upswing A target number of net increases within a defined period; A net of 6 daily
so an upswing window can still include no-change periods increases in case
or even decreases, depending on the threshold settings numbers or incidence
over the 8 previous
days
Resurgence A resurgence occurs when a previously declining or Co-occurrence of an
roughly stable level of incidence and test positivity upswing and an
changes to a consistently increasing trend. In practical uptick
terms a resurgence is identified when an uptick occurs
within an upswing either before the end-of-wave
threshold has been reached (a midwave resurgence) OR
that exceeds the most recently met end-of-wave
threshold (a post-wave resurgence).
New wave A period (currently 1 day) where case load returns to a 30% of peak
specific fraction of the previous peak case load or incidence or case load
incidence AFTER the end-of-wave threshold has been met
*all increases/decreases are relative to the 7 day moving averageEpidemiology of a ‘second wave’ (as of 15 October 2020)
Global characterisations of ‘second wave’ epidemiology
Identification of countries for analysis
In this analysis, we included 113 countries that met both the following criteria:
Has a population of at least 1 million
Has had a daily incidence of confirmed COVID-19 cases (based on the 7-day moving average) of at
least 10 per million population
We additionally excluded countries that met any of the following criteria:
Did not have incidence data available via Our World in Data
Had any negative 7-day-average incidence of confirmed cases
Datasets from ‘Our World in Data’ were downloaded. Data sources are as described at
https://ourworldindata.org/coronavirus
Findings of analysis
To date, 49 countries of the 113 countries selected for analysis have concluded their first
epidemic wave and, of these, 24 have experienced additional wave(s) and 5 have seen one of
more of those additional waves end.
For those countries ending the first wave,
o the median time from the peak to the end of the first wave was 39 days (interquartile
range: 24-54), and
o the median number of cumulative confirmed cases per million population at the end of
the first wave was 1282 (IQR: 564-3749; 694, IQR: 345-1910 for only those experiencing a
second wave and 1407, IQR: 926-6247 for those not yet experiencing a second wave)
The median ratio of the magnitude of the wave peak to the size of the post wave trough was 30
(IQR: 13-74).
The median ratio of test positivity at the peak of the first wave to the end of the first wave was 50
(IQR: 22-inf).
The median time from the end of the first wave to the beginning of the second wave was 66 days
(IQR: 24-84).
The median number of days in a resurgence within the month preceding the beginning of the
second wave was 3 (IQR: 0-7).
The median number of days in a resurgence within the two weeks preceding the beginning of the
second wave was 2 (Range: 0-5).
11 of the 25 countries that have experienced a post-wave resurgence entered a second wave
within one month of the beginning of the first resurgence after ending the initial wave.
In 12 of the 24 countries experiencing subsequent waves, the peak of those waves has exceeded
the magnitude of the first wave peak.
We examined ten countries experiencing second waves in more detail to gain an understanding of the
epidemiological patterns they have experienced: Australia, Belgium, Denmark, France, Israel,
Netherlands, Serbia, Slovenia, South Korea, and Spain. Table 2 shows key dates and features of the
epidemic dynamics in each of these countries.Table 2. Key dates and features of the epidemic dynamics in each of 10 countries identified for in-depth analysis
COUNTRY 1ST WAVE PEAK 1ST WAVE END 2ND WAVE START 2ND PEAK : 1ST PEAK
Australia 2020-03-31 2020-04-16 2020-07-08 Higher
Belgium 2020-04-12 2020-05-22 2020-08-02 Lower / TBD
Denmark 2020-04-09 2020-05-29 2020-08-11 Lower / TBD
France 2020-04-02 2020-05-14 2020-08-11 Higher
Israel 2020-04-07 2020-05-07 2020-06-18 Higher
Netherlands 2020-04-15 2020-06-02 2020-08-06 Lower / TBD
Serbia 2020-04-20 2020-05-29 2020-06-28 Higher
Slovenia 2020-04-01 2020-05-04 2020-07-06 TBD
South Korea 2020-03-06 2020-04-06 2020-08-20 Lower / TBD
Spain 2020-03-31 2020-05-04 2020-08-03 Higher
In-country experiences of the ‘second wave’ in selected countries
In all of the case study countries, the decline in cases leading to the end of the first wave is believed to
have been driven by non-pharmaceutical interventions (restrictions imposed to curb the spread of the
virus).
In Australia4, South Korea5, and Slovenia6, a key factor in controlling the first wave was efficient contact
tracing, isolation, and quarantine (CTIQ) procedures, implemented while case numbers remained low.
Australia and Slovenia combined efficient CTIQ with travel restrictions, border closures, shutdown of non-
essential services and stay-at-home orders. These three countries had relatively small first peaks (15.3,
11.9, and 23.0 confirmed cases per million population, respectively) and low total numbers of cases in the
first wave (10% (butwave. A seroprevalence study conducted among blood donors in The Netherlands11 found a lower overall seroprevalence of 2.7%, again with substantial geographic variation (10%). This study was conducted in the two weeks prior to the peak of the first wave (1-15 April), so seroprevalence would have been higher than this (possibly approximately double) by the end of the first wave. It is not known to what extent blood donors are representative of the general population in terms of infection risk. Media reports from Israel12 suggest a low seroprevalence (2-3%) near the end of the first wave; however, details of the study are not available. Findings from seroprevalence studies where available at the time of writing are Belgium13 (6.9% at mid May (after the end of first wave); also: study in HCW14), France15 (6.7% in metropolitan areas in mid April, 2 weeks after the peak), Denmark16 (4.0% in HCW and 3.0% in blood donors; and other studies : ~1.1 and 1.2% in general population17,18, 2.4% in blood donors19). No seroprevalence studies were found for Slovenia, Serbia, South Korea, or Australia. In summary, the seroprevalence data from case study countries that are experiencing second waves suggest that the level of exposure was low (
Denmark29: reopening of borders and removal of restrictions
France30: summer travel and poor adherence to restrictions, especially among younger persons
Israel: lifting of most restrictions, reopening of schools31,32 poor public support for interventions33
Netherlands: easing of restrictions from 1 June and more so as of July 1, 202034
Serbia: mass gatherings35 / lifted curfew36; younger agegroups
Slovenia: poor adherence to social distancing and non-adherence to quarantine37; outbreaks in
care homes
South Korea38: large gatherings (eg religious) and other superspreading events (eg large office
buildings)
Spain39: return of nightlife / group activities, particularly in younger people
In several countries, there has been a marked demographic shift in the second wave, with the majority of
infections in younger populations (e.g., Belgium, Denmark40, France41, Israel42, Netherlands43, Spain44). In
addition, disease severity appears to have decreased in the second wave in a number of locations
(Belgium45, Denmark46, France47, Israel48, Netherlands49, Spain50), likely due to a combination of factors
including younger people getting infected, increased experience of clinicians in treating the disease,
better therapeutic options, and (in some locations) broader criteria for testing.
Historical experiences with pandemic waves
The patterns seen in the case study countries described above are consistent with the epidemiology of
second waves seen in influenza pandemics. The 1918 flu pandemic has been particularly well studied,
with multiple publications demonstrating that the strength, duration, and effectiveness of NPIs
29 https://www.themayor.eu/en/denmark-tightens-coronavirus-restrictions
30
https://www.santepubliquefrance.fr/maladies-et-traumatismes/maladies-et-infections-respiratoires/infection-a-
coronavirus/documents/bulletin-national/covid-19-point-epidemiologique-du-13-aout-2020
31
Stein-Zamir C, Abramson N, Shoob H, Libal E, Bitan M, Cardash T, Cayam R, Miskin I. A large COVID-19 outbreak in a high school 10 days after
schools’ reopening, Israel, May 2020. Eurosurveillance. 2020 Jul 23;25(29):2001352
32 Dattner I, Goldberg Y, Katriel G, Yaari R, Gal N, Miron Y. The role of children in the spread of COVID-19: Using household data from Bnei Brak.
Israel, to estimate the relative susceptibility and infectivity of children. medRxiv. 2020;3:2020.
33 Bodas M, Peleg K. Self-Isolation Compliance In The COVID-19 Era Influenced By Compensation: Findings From A Recent Survey In Israel: Public
attitudes toward the COVID-19 outbreak and self-isolation: a cross sectional study of the adult population of Israel. Health Affairs. 2020 Jun
1;39(6):936-41.
34
https://bloddonor.dk/coronavirus/
35 https://tass.com/world/1178401
36
https://www.zslaw.rs/serbia-lifts-state-of-emergency-and-cancels-curfew/
37 https://www.gov.si/en/news/2020-07-06-with-the-deterioration-of-the-epidemiological-picture-stricter-control-over-the implementation-of-
quarantine/
38https://www.cdc.go.kr/board/board.es?mid=a30402000000&bid=0030&act=view&list_no=368031&tag=&nPage=6
39 https://www.nytimes.com/2020/08/31/world/europe/coronavirus-covid-spain-second-wave.html https://time.com/5871218/spain-
coronavirus-cases/
40 https://www.ssi.dk/sygdomme-beredskab-og-forskning/sygdomsovervaagning/c/covid19-overvaagning
41 https://www.santepubliquefrance.fr/maladies-et-traumatismes/maladies-et-infections-respiratoires/infection-a-
coronavirus/documents/bulletin-national/covid-19-point-epidemiologique-du-13-aout-2020
42 https://www.science.co.il/medical/coronavirus/Distribution-age.php
43 https://allecijfers.nl/nieuws/statistieken-over-het-corona-virus-en-covid19/
44https://www.isciii.es/QueHacemos/Servicios/VigilanciaSaludPublicaRENAVE/EnfermedadesTransmisibles/Paginas/-COVID-19.-Informes-
previos.aspx
45 https://covid-19.sciensano.be/sites/default/files/Covid19/COVID-19_Daily%20report_Annex_FR.pdf
46 https://covid19.who.int/region/euro/country/dk
47
https://covid19.who.int/region/euro/country/fr
48 https://www.science.co.il/medical/coronavirus/Statistics.php
49 https://covid19.who.int/region/euro/country/nl
50 https://www.isciii.es/QueHacemos/Servicios/VigilanciaSaludPublicaRENAVE/EnfermedadesTransmisibles/Paginas/-COVID-19.-Informes-
previos.aspxdetermine, at the scale of a city, whether a second wave occurs and its relative magnitude51,52,53. Markel et al.53 observed: “Overall, cities that implemented nonpharmaceutical interventions earlier experienced associate delays in the time to peak mortality, reductions in the magnitude of the peak mortality, and decreases in the total mortality burden.” This is consistent with the patterns for the first wave of the COVID-19 epidemic in the case study countries, as described above. Both Markel53 and Hatchett51 observed that no cities saw a second wave so long as NPIs remained in place; second waves only occurred after relaxation of interventions. Bootsma and Ferguson52 contend that the occurrence and nature of a second wave is driven by the level of immunity in the population. Essentially, they argue, second waves occur when the initial intervention is ‘too’ effective, driving down transmission so severely that little immunity is accumulated in the population. When such interventions are rapidly lifted, transmission rebounds causing a second wave; in contrast, if interventions are not severe enough to halt transmission (or if restrictions are lifted slowly enough), immunity accumulates in the population through a longer first wave with a lower peak, which may result in herd immunity, such that a subsequent wave is not possible. They demonstrate these dynamics by fitting a model to the mortality data from 47 United States cities. Will a ‘second wave’ occur in RSA? Epidemiological factors associated with the current decline in case load in South Africa Based on our definitions, South Africa reached the end of its first wave on 8 September, and cases have been declining steadily since the epidemic peaked on 20 July. Despite an early and extensive lockdown from 27 March to 30 April 2020, the South African epidemic was not brought under control, and the effective reproduction number remained above 1 throughout the Stage 5 lockdown. This is in contradistinction to European countries where the lockdown appears to have contained transmission. Despite the apparent ineffectiveness of containing transmission in South Africa, a decline in incidence has occurred as restrictions have been lifted. These observations suggest that the factors driving the decline in incidence in South Africa differ meaningfully from factors driving the decline in all case study countries. This begs the question as to whether or not increasing population-level immunity may be contributing to a reduction in transmission. Interpreting current serological evidence There are few available seroprevalence studies in South Africa. Marvin Hsiao and colleagues (personal communication) from UCT/NHLS reported on SARS-CoV-2 seroprevalence in antenatal women and people living with HIV in samples collected between 17 July and 17 August 2020. Overall, a seroprevalence of 37% in the Cape Metro subdistricts, ranging from ~30% in CT Southern and Eastern subdistricts to ~45% in Klipfontein and Khayelitsha was reported. Higher seroprevalence was seen in PLWHIV (relative to antenatal samples), more densely populated subdistricts, and women (relative to men). Age-specific seroprevalence ranged from 30.3% (>55 years) to 48.7% (45-49 years), though some age categories had small sample sizes. The seroprevalence estimates from these convenience samples may overestimate the true population seroprevalence (as these persons attended clinic during this time period and were therefore relatively mobile), though biases in both directions are likely (serology assays may be falsely negative in persons more recently infected, and test validation panels likely over represent severe cases54,55). The observed 51 Hatchett RJ, Mecher, CE and Lipsitch, M. (2007) Public health interventions and epidemic intensity during the 1918 influenza pandemic, Proceedings of the National academy of Sciences 104(18), 7582-7587. Available from: https://www.pnas.org/content/104/18/7582 (accessed: 15 September 2020). 52 Bootsma, MCJ and Ferguson, NM (2007) The effect of public health measures on the 1918 influenza pandemic in U.S. cities, Proceedings of the National Academy of Sciences 104(18), 7588-7593. Available from: https://www.pnas.org/content/104/18/7588 53 Markel H. et al. (2007) Nonpharmaceutical Interventions Implemented by US Cities During the 1918-1919 Influenza Pandemic, JAMA 298(6), 644–654. Available from: https://jamanetwork.com/journals/jama/article-abstract/208354 54 https://academic.oup.com/aje/advance-article/doi/10.1093/aje/kwaa188/5900104 55 https://academic.oup.com/jid/advance-article/doi/10.1093/infdis/jiaa523/5898481
differences between subsamples indicates that cautious interpretation is warranted. Nevertheless,
seroprevalence is high enough to indicate that active immunity is likely playing an important role in the
current epidemic decline, and is consistent with the infection fatality ratio being within the bounds of
expectation. The findings of this study are consistent with recent serological results from Kenya56, which
is at a similar stage of its epidemic to South Africa. In general, studies from LMIC settings have found
substantially higher seroprevalences than seen in developed countries. These include seroprevalences of
38% in adult male blood donors in Karachi, Pakistan57, 40% in a population-based survey in Maranhao,
Brazil58, 57% in slums and 16% in non-slum areas in Mumbai, India59, 45% in a population-based survey in
Atahualpa, Ecuador60, and 71% in a population based survey in Iquitos, Peru61.

Identifying communities ‘at-risk’ for a second wave
Due to widespread transmission over a period of more than three months, and as indicated by
preliminary serological results, South Africa is likely to have ended its first epidemic wave with substantial
population-level immunity; however, this immunity is not likely to be evenly distributed, and substantial
pockets of susceptibility may remain.

Nationally representative serological studies will be invaluable to determine which communities remain
at risk; however, such results will not be available for some time. In the meantime, there are a number of
factors that could be informative when thinking about communities that are ‘at-risk’ for a second wave,
which can be assessed at the ward level. These include information on

     1. the number of laboratory-confirmed cases per population to date,
     2. the number of tests performed per population to date,
     3. the degree to which wards are connected to other wards through population mobility (e.g., as can
        be measured through mobile phone data),
     4. cumulative test positivity to date,
     5. population density, and
     6. indicators of social vulnerability.

While none of these factors alone will give a clear picture of future transmission risk, synthesizing across
this information may provide sufficient context to help identify areas of relatively high and low risk. For
example, wards with low numbers of confirmed cases per population may be areas that have not yet
experienced significant transmission or areas with particularly low testing levels. By combining this
information with data on testing patterns to date and test positivity, we should be able to identify which
wards have seen low transmission to date, or have an unknown transmission history.

Population density and social vulnerability serve as proxies for crowded living conditions and the extent
to which the population has the ability to reduce contact and prevent onward transmission. Population
mobility serves as a proxy for the risk of seeding infection from outside areas. Thus, among those wards
having seen low transmission to date or with unknown transmission history, those with high population
density, high social vulnerability, and/or high mobility are likely to constitute the highest risk areas for
future spread.

Although this assessment does not give a precise quantitative indicator for which areas are most at risk, it
does provide us information about which areas are highest priority for timely collection of serological

56 https://www.medrxiv.org/content/10.1101/2020.09.02.20186817v1
57 https://www.ncbi.nlm.nih.gov/pmc/articles/PMC7444608/
58
   https://www.medrxiv.org/content/10.1101/2020.08.28.20180463v1
59 https://www.tifr.res.in/TSN/article/Mumbai-Serosurvey%20Technical%20report-NITI.pdf

60 https://academic.oup.com/cid/advance-article/doi/10.1093/cid/ciaa1055/5876901
61 https://www.researchgate.net/publication/343414173_Seroprevalence_of_anti-SARS-CoV-2_antibodies_in_the_city_of_Iquitos_Loreto_Peru
data (those with unknown transmission history), and can be used to develop a relative scaling for areas
where potential new hotspots might emerge.
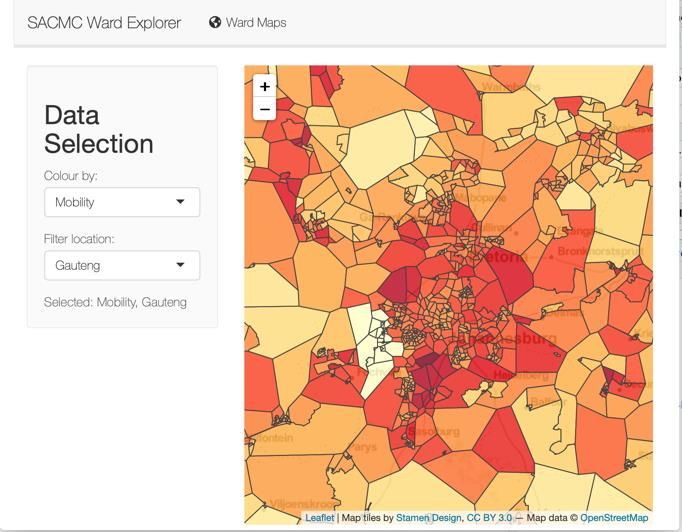
To this end, the South African COVID-19 Modelling Consortium (SACMC) is developing a dashboard to
combine data sources to identify communities that may be at risk of a second wave. This dashboard will
include graphical and numerical output to allow the user to assess spatial patterns (in the form of maps)
and identify wards that meet user-specified criteria thought to be associated with risk of further
transmission. Some example output is illustrated in Figure 2. Once available, seroprevalence data can be
added as a map layer in the dashboard to provide a more robust risk assessment.
Likely scenarios for South Africa.
In the light of the above findings, the TWG believes that resurgences are expected and a second wave
may occur; however, it is unlikely that a second wave will occur within the next 4-6 months, unless
immunity wanes extremely rapidly or if population behavioural characteristics change significantly. The
latter may take place, if for example, during December travel, SARS-CoV-2 is introduced into naïve
populations and social distancing and other NPIs are not adhered to. If a second wave does occur, it is
expected to peak at a lower level than the first wave. Health services are unlikely to be overwhelmed.
Beyond this time frame, it is difficult to assess the likelihood of a second wave. Reduced adherence to
nonpharmaceutical interventions, waning immunity, and seasonality of transmission could increase the
risk of a second wave or a substantial post-wave resurgence as we move into winter of 2021.
Figure 2. Left: Cases per one million population per ward in South Africa (as at 8 September 2020) Data source:
National Institute for Communicable Diseases. Right: Level 2 Mobility per ward in Gauteng, defined as proportion
of individuals with significant movement outside ward. Data Source: Vodacom Mobility Data (Period: 18-27
August). (NB: This app should be ready for demonstration purposes as of 15 September. A link can be provided but will require
login, as some of the data cannot be shared publicly)
Key uncertainties in predicting a second wave in South Africa
There are at least five mechanisms that can drive second pandemic waves:
a change in viral transmissibility (e.g., due to seasonality),
behavioural changes in a population,
spread among weakly connected subpopulations,
viral evolution, and waning immunity62. When applied to COVID-19, there is substantial uncertainty about the details of each potential mechanism, so we will take them in turn. Viral transmissibility mainly changes in one of two ways – either through a substantial shift in population-level contact patterns (such as resulting from school terms, which is thought to drive seasonality of many childhood infections, including measles63) or through seasonal effects on viral stability in the environment. Both are possible for COVID-19 in South Africa, and the former is strongly linked to the second mechanism of behavioural changes. Seasonality is known to be important for the transmission of endemic human coronaviruses; however, this is an effect that emerges with the long-term circulation of a pathogen. Early in a pathogen’s spread, the small seasonal differences in transmissibility that later come to define transmission seasons are effectively irrelevant early on in a pandemic, when the availability of a large susceptible population provides near unlimited opportunity for transmission64. There are a number of anticipated behavioural changes that may affect the possibility of a second wave in South Africa. These include the reopening of schools, loosening of other restrictions as the economy opens, reduced adherence to NPIs as restrictions are loosened, and travel during the upcoming summer holidays. Each of these anticipated changes is likely to cause a relative increase in transmission; however, the question remains whether that increase is sufficient to bring the effective reproduction number above 1 in the context of the current existing population immunity. The fact that the epidemic has declined as restrictions have eased to date is promising, but this remains one of the key areas of uncertainty with regard to the possibility of resurgences and even a potential second wave. Based on the data available so far, there is substantial geographic heterogeneity in seroprevalence. This is likely an indicator that the South African population can be considered to form a set of weakly connected subpopulations. Overall, it appears that the areas with the highest attack rates in South Africa’s first wave have been densely crowded urban areas and informal settlements. In one study of the 1918 influenza pandemic in Norway65, it was observed that “the first wave hits the poor; the second wave hits the rich.” South Africa could be in a similar situation currently, with little immunity among the affluent populations who were able to substantially reduce contacts through effective NPIs. Rural areas may also constitute weakly connected subpopulations with low or varying levels of immunity. Thus, introductions into these subpopulations are likely to cause outbreaks over the coming months, but there remains substantial uncertainty regarding the numbers of people who will be infected as these pockets of susceptibility are hit. Viral evolution plays a large role in the epidemiology of influenza but is thought to play less of a role with coronaviruses, which tend to be relatively genetically stable. Waning of immunity to SARS-CoV-2 is one of the biggest sources of uncertainty that will determine the likelihood, timing, and magnitude of potential subsequent waves of transmission. While it is evident that there is some level of protective immunity conferred by SARS-CoV-2 infection, the extent and duration of protective immunity – particularly for those who had mild or asymptomatic cases – is uncertain. The duration of immunity for related coronaviruses is estimated to be between about 8 months66 and 4 years34, with reinfections commonly occurring 12 months after a previous infection67. These findings 62 Mummert A, Weiss H, Long L-P, Amigo ́ JM, Wan X-F (2013) A Perspective on Multiple Waves of Influenza Pandemics. PLoS ONE 8(4): e60343. https://journals.plos.org/plosone/article?id=10.1371/journal.pone.0060343 63 https://science.sciencemag.org/content/287/5453/667.full 64 https://science.sciencemag.org/content/369/6501/315.full 65 https://europepmc.org/article/med/29356350 66 https://science.sciencemag.org/content/368/6493/860 67 https://www.medrxiv.org/content/10.1101/2020.05.11.20086439v2.full.pdf
suggest that the apparently high level of immunity (or at least previous exposure) currently found in the
South African population may not persist, suggesting substantial potential for a second wave in winter
2021 if a vaccine is not available.
Section 2 -COVID surveillance activities to support detection of a second wave
Structure of Section 2
In Section 2 we define surveillance and outline the aim and objectives of COVID surveillance. We identify
COVID surveillance activities that are currently taking place, and tabulate how these data are potentially
useful at different levels of the health system.
Definition of surveillance
Epidemiological surveillance is the systematic collection, analysis and dissemination of health data (in this
case data on COVID-19) for the planning, implementation and evaluation of public health programmes.68
Aim and objectives of surveillance
The WHO interim guidance on surveillance strategies for COVID-19 (7 August 2020) states that, the aim of
surveillance for COVID-19 is to enable public health authorities to reduce transmission, thereby limiting
associated morbidity and mortality69.
Key objectives of COVID-19 surveillance include:
enabling rapid detection, isolation, testing, and management of cases.
guiding implementation and adjustment of targeted control measures, while enabling safe
resumption of economic and social activities.
detecting and containing outbreaks among vulnerable populations. (Note: this could include
settings with people at high risk of severe COVID-19 outcomes or closed/semi-closed setting with
high risk of transmission such as long-term care facilities, prisons, health facilities, workplaces and
schools.)
evaluating the impact of the pandemic on health-care systems and society.
monitoring longer term epidemiologic trends and evolution of COVID-19 virus.
contributing to the understanding of the co-circulation of SARS-CoV-2 virus, influenza and other
respiratory viruses, and other pathogens.
In the current period while the number of cases and deaths are decreasing across the South Africa, the
first three objectives will be critical to timeous detection and location of any uptick in cases to identify
and respond to areas of new or increased transmission.
Approaches to COVID-19 surveillance and surveillance methodologies
A key underlying principle of the approach to COVID-19 surveillance in South Africa, and particularly in
relation to detecting a ‘second wave’ is the need to use, adapt and strengthen existing surveillance and
data systems, whilst building surveillance capacity in the long-term. While there may be dedicated COVID-
19 surveillance in the short to medium term (e.g. for the next year) this should ultimately be integrated
with surveillance for all notifiable medical conditions in the long term. Adapting systems developed for
COVID-19 surveillance (e.g. the DATCOV hospital admissions surveillance) to be used for surveillance of
other conditions should be considered.
68 Thacker et al. A Method for Evaluating Systems of Epidemiological Surveillance. World Health Stat Q. 1988;41(1):11-8.
69 (https://www.who.int/publications/i/item/who-2019-nCoV-surveillanceguidance-2020.7)Surveillance for COVID-19 can also broadly be framed as either identifying current infections (which
requires testing for the presence of SARS-CoV-2), identifying past infection (i.e. testing for antibodies to
SARS-CoV-2) and monitoring changes in viral genetic sequences and antigenic properties so as to
understand the impact of these data on future disease burden.
With particular reference to the current stage of the COVID-19 outbreak in South Africa, the surveillance
approach may be grouped into three broad strategies (Figure 3).
Firstly, seroprevalence studies may indicate the extent of the first wave, including the incident
fatality rate, and the extent of current population vulnerability.
Secondly, surveillance for incident cases, deaths and hospitalisations, sentinel site surveillance to
detect seasonal and geographic trends, surveillance amongst vulnerable populations and
molecular characterisation of new cases may inform early identification of a resurgence, and/or
emerging new strains.
Lastly, new case detection will facilitate rapid containment of infection and prevent a
upswing/resurgence from becoming a second wave.
These approaches can be applied at the level of a population or to particular groups or settings either at
high risk of transmission or high risk of poor outcomes, such as long-term care facilities, prisons, health
facilities, workplaces and schools.
Current surveillance activities for COVID-19 including data sources, and a description of how data is
utilised for surveillance purposes are described in Table x below.
Figure 3: Surveillance strategies in order to detect and respond to a ‘COVID-19’ second waveSerological surveillance to understand population vulnerability Serology (antibody) surveys identify patterns of COVID-19 infection amongst persons from whom samples originate. Where samples are representative, inferences may be made regarding the epidemiology of SARS-CoV-2 in particular geographical areas. Preliminary serological data is available in two epidemiological settings, as referred to above, namely 1) residual sera from persons in the Western Cape Province undergoing HIV viral load testing, and HIV ELISA testing from persons attending ante-natal clinic in the last week of July 2020, and 2) persons enrolling in a vaccine trial in Gauteng Province July –August 2020. Two population-representative household sero-surveys are planned in South Africa, namely the HSRC national survey, and a survey planned by the NICD in Cape Town, Pietermaritzburg and Klerksdorp Detection of new infections and interpretation of the significance of these Case-based surveillance (acute cases, admissions and hospitalisations) Case-based surveillance has been in place since the outset of the COVID-19 epidemic in South Africa and includes reporting on the number and characteristics of diagnosed COVID-19 cases, hospital admissions and deaths and thus currently relies on diagnostic SARS-CoV-2 PCR testing in persons who present to health services and are deemed by the attending clinician to meet the suspected case definition. Sentinel site surveillance of severe acute respiratory illness (SARI) and influenza-like-illness (ILI) The NICD has included testing for SARS-CoV-2 amongst persons enrolled at sentinel sites with severe acute respiratory illness (SARI), influenza-like illness (ILI programme) and the viral watch programme70. These data provide the relative proportion of clinical cases where viral pathogens are isolated. In the past these data have allowed the NICD to interpret temporal and seasonal trends in the etiology fo specific viral pathogens including influenza and respiratory syncytial virus. Results from these surveillance programmes are reported monthly on the NICD website. Molecular epidemiological surveillance The Network for Genomic Surveillance in South African (NGS-SA)71 is a consortium (including of members from the NHLS, NICD, UCT, UKZN, Stellenbosch, SANBI, H3ABionet and others) established in June 2020 to perform genomic surveillance of SARS-CoV-2 across South Africa. Any specimen on which RT-PCR has yielded a positive result for SARS-CoV-2 at a Ct value of less than 30 is suitable for performing whole genome sequencing. Conducting ongoing regular genome sequencing of SARS-CoV-2 virus in representative samples of COVID-19 patients across South Africa will provide information on whether lineages causing infection reflect ongoing infections within a local cluster, or re-introductions from further afield. These data may also inform contact tracing efforts by identification of chains of transmission, and support outbreak investigations in health care institutions. This will inform the types of measures used to limit transmission e.g. travel restrictions vs. local outbreak response. The NGS-SA is working towards ensuring that genome sequences are available in real-time in order to support outbreak response activities and policy making. 70 .https://www.nicd.ac.za/wp-content/uploads/2020/08/Weekly-Pathogens-surveillance-report-week-33.pdf 71 https://nextstrain.org/groups/ngs-sa
You can also read