MISO's Capacity Auction: Uncertainty Going Forward - OurEnergyPolicy.org
←
→
Page content transcription
If your browser does not render page correctly, please read the page content below

WHITE PAPER

    MISO’s Capacity Auction:
    Uncertainty Going Forward
    By Himanshu Pande and Rachel Green

                                                The Bottom Line

       1. The Midcontinent Independent System Operator’s (MISO’s) recent capacity auction results
          reveal the impact of independent power producers (IPPs) on the market. Zone 4 (Illinois)
          cleared at $150/MW-day, almost 10 times higher than the 2014–2015 auction price. This price
          supports the view that MISO capacity markets might work and deliver resource adequacy.

       2. Zone 4’s price spike was due to the large concentration of independent power producers
          (IPPs) and more retail load relying on the auction instead of bilateral contracts. In contrast,
          Zone 7 (Michigan) prices failed to spike in this auction because of a lack of uncontracted or
          not self-supplied load and supply.

       3. Going forward, ICF International expects supply and demand balance to tighten in MISO.
          However, given the current capacity market structure and the fact the majority of the capacity
          in MISO already is contracted, this balance may not translate to a sustained recovery in
          capacity prices without MISO reforms. In the interim, more exit from MISO (including into
          neighboring markets) is possible. The lack of federal reform also could precipitate state
          intervention, which could exacerbate concerns about reliability.

    Executive Summary
    MISO’s recent 2015–2016 capacity auction resulted in some significant shifts in pricing. Substantially
    lower clearing prices occurred across almost all of the system’s nine zones, with the most notable
    exception of Zone 4 that saw a dramatic tenfold year-over-year increase.
    In the most basic terms, these results were driven by relatively simple factors: higher opportunity
    cost-based bids in Zone 4, lower bids elsewhere, and more uncontracted competitive retail load. But
    at a more detailed level, several related dynamics underlaid bidding behavior. IPPs bid in capacity
    markets to cover their fixed and opportunity costs in contrast to utility-owned generation or
    contracted generation under a power purchase agreement (PPA) for which covering these costs is a
    far more secure proposition. The greater concentration of IPPs and uncontracted retail load in Zone
    4—combined with higher expected costs for environmental compliance, lower expected energy
    margins for merchant generators, and a higher offer price threshold (i.e., set based on a higher
    opportunity cost)—drove prices up dramatically. Conversely, in other zones, a greater proportion of
    capacity existed under fixed resource adequacy plans and contracted, with effectively $0/MW-day
    bids into the auction in each zone, thereby exerting downward pressure on prices. In Zone 7, in
    particular, a 320-MW decrease in planning reserve margin requirement added to price-lowering
    momentum, while a shift to less competitive bids and less uncontracted load dropped the clearing
    price further to $3.48/MW-day.

1   icfi.com                                                                       © 2015 ICF International, Inc.
Going into the next auction, a number of factors will tighten the supply and demand balance. More
    than two GW of retirements already are anticipated, while a potential for 15 percent of the region’s
    overall coal capacity remains to retire due to Mercury and Air Toxics Standards (MATS) compliance by
    2016. Power plant operators in MISO are increasingly looking to interconnect to PJM Interconnection
    LCC (PJM) instead to benefit from higher capacity prices there. In Zone 7 particularly, capacity losses
    are expected to increase prices, albeit moderately. However, given inefficiencies in the current MISO
    capacity market structure—including the vertical demand curve, a lack of penalties for poor
    performance, a substantial number of low bids from regulated units, and volatility in the threshold for
    economic withholding—and the fact the majority of the capacity in MISO already is contracted, we do
    not expect a major recovery in capacity prices. This combination of factors may require eventual
    reform in the capacity market. In the interim, state intervention could translate into more opportunity
    for new assets to enter into PPAs with utilities.

    How We Got Here: MISO Capacity Market Background
    MISO is divided into nine local resource zones (LRZs) as seen in Exhibit 1.
                                    Exhibit 1: MISO Local Resource Zones

                                                                                          Source: MISO

    MISO’s resource adequacy construct provides compensation for resources not under a fixed resource
    adequacy plan (FRAP) for the value of having available energy in a particular geographic location. This
    construct aims to improve the reliability of the MISO electricity grid, especially during peak times when
    supply can be scarce. The capacity auction is prompt rather than forward looking like the ISO New
    England Inc. (ISO-NE) and PJM markets, meaning that capacity for the June–May annual planning period
    is procured in April of that same year. Participants bid into the auction for zonal resource credits (ZRCs)
    that are equivalent to one MW of capacity. ZRCs are for one-year obligations. The bids are cleared
    through a single, sealed-bid clearing price auction against a vertical demand curve, unlike PJM and
    ISO-NE where bids are cleared against sloping demand curves. The RA construct began with the
    2013–2014 auction period. Previously, MISO conducted a voluntary capacity market with significantly
    low capacity prices and no incentives for localization. The clearing price for each zone for the three RA
    auctions is outlined in Exhibit 2.

2   icfi.com                                                                       © 2015 ICF International, Inc.
Exhibit 2: MISO Historical Capacity Prices ($/MW-Day)

       Auction     Zone 1    Zone 2     Zone 3   Zone 4    Zone 5     Zone 6    Zone 7     Zone 8      Zone 9
       Period
      2013–2014     1.05      1.05       1.05     1.05       1.05      1.05       1.05       NA          NA
      2014–2015     3.29      16.75      16.75    16.75     16.75      16.75     16.75      16.44       16.44
      2015–2016     3.48      3.48       3.48      150       3.48      3.48       3.48       3.29        3.29
                                                                                                      Source: MISO

    Load serving entities (LSEs) and utilities must meet two reserve requirements in the RA auctions: the
    planning reserve margin requirement (PRMR) and the local clearing requirement (LCR). Exhibit 3 outlines
    how these requirements are determined and met in the auction. The LCR is the amount of capacity a
    zone must procure internally in order to meet its own peak demand requirements. The PRMR is the
    amount of capacity a zone must procure—which can include imports—to fulfill its obligation to meet
    MISO’s peak demand reliability requirements. Resources to meet these requirements include both
    merchant resources that offer competitive bids in the auction and resources either contracted or
    developed by utilities. LSEs also can procure some or all of their requirements via a FRAP instead of RA
    auctions. The amount of resources under a FRAP in a given LRZ either can be removed from the overall
    requirements or can be assumed to be available in auctions at zero price.

                                      Exhibit 3: MISO Capacity Obligations

                                                                                                       Source: ICF

    2015–2016 Auction Results
    As seen in Exhibit 4, MISO’s 2015–2016 auction resulted in significantly lower prices in most zones and a
    dramatic rise in Zone 4. The MISO north clearing price was $3.48/MW-day, compared with $16.75 in the
    2014–2015 auction. Zone 4 separated from the rest of MISO north and had a clearing price of $150/
    MW-day. MISO South, Zones 7 and 8, had a binding export limit of 1000 MW, so those zones cleared
    slightly lower than the rest of MISO at $3.29/MW-day.

3   icfi.com                                                                      © 2015 ICF International, Inc.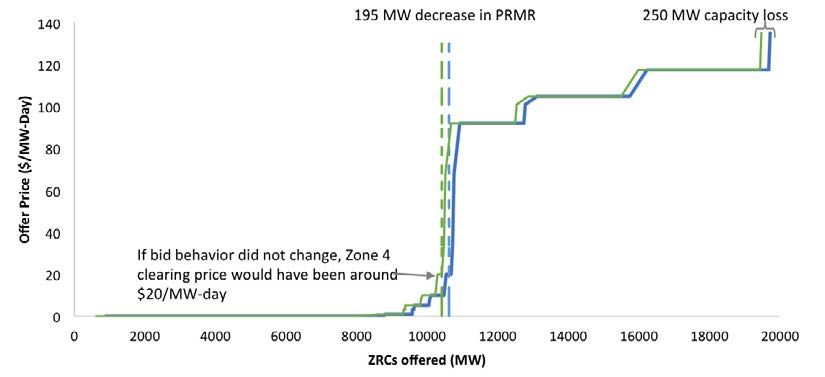
Exhibit 4: 2015–2016 Auction Results
Key Zone 1 Zone 2 Zone 3 Zone 4 Zone 5 Zone 6 Zone 7 Zone 8 Zone 9
Coincident
A 16,525 12,429 8,876 9,518 8,176 17,592 20,522 7,424 23,035
Peak Demand
Transmission
B 581 238 244 211 143 530 653 156 466
Losses
Planning
Reserve C 7.1% 7.1% 7.1% 7.1% 7.1% 7.1% 7.1% 7.1% 7.1%
Margin
PRMR (A+B) x C 18,321 13,566 9,768 10,420 8,910 19,409 22,678 8,118 25,170
Local Resource
D 19,717 15,235 10,667 11,982 10,426 20,326 25,255 9,924 26,929
Requirement
Capacity
E 3,735 2,903 1,972 3,130 3,899 5,649 3,813 2,074 3,320
Import Limit
Local Clearing
F= D – E 15,982 12,332 8,695 8852 6527 14,677 21,442 7850 23,609
Requirement
Total Offer
4,867 3,071 5,922 11,156 7,926 14,832 14,103 9,562 26,193
Submitted
Total FRAP 14,494 11,817 4,113 838 0 4,853 9,456 397 2,261
Offer Cleared
H>= F 18,495 14,497 9,813 8,852 7,885 19,015 23,515 8,526 25,762
+ FRAP
Imports/
G -175 -193 -45 1568 1026 394 -837 408 -592
Exports
Total
(H+G)>=PRMR 18,320 14,304 9,768 10,420 8,911 19,409 22,678 8,934 25,170
Resources
Clearing Price
$3.48 $3.48 $3.48 $150.00 $3.48 $3.48 $3.48 $3.29 $3.29
$/MW-Day
Source: MISO and ICF
Key Price Drivers
Little change in overall capacity resulted in the 2015–2016 auction: Little change was noted in
overall capacity in MISO between the 2014–2015 and 2015–2016 auctions. In total, MISO had less
than a one GW decline in capacity. Specifically, Zone 4 reported only a 250 MW loss in capacity.
Higher opportunity cost-based bidding occurred in Zone 4 than in previous years: The bids
in Zone 4 were higher than in the 2014–2015 auction. As seen in Exhibit 5, using the 2014–2015
supply curve, the loss of 250 MW of capacity and a 195 MW decline in PRMR in the 2015–2016
auction would have resulted in a price around $20/MW-day if bidding behavior had remained the
same—significantly lower than the actual clearing price of $150/MW-day. Additionally, the highest
bid for the 2014–2015 auction in Zone 4 ($135/MW-day) also was lower than the 2015–2016
clearing price, further demonstrating that cost offers for Zone 4 in this auction were higher. The
cleared price was close to the threshold for identifying economic withholding, which was set at
$155.79/MW-day, corresponding to the opportunity cost of participating in PJM’s capacity market
in the 2015–2016 auction. Part of the change in bidding also was caused by more retail load relying
on the auction to procure capacity instead of by bilateral contracts. This reliance resulted in more
supply that was uncontracted going into the auction and that needed to bid at opportunity or
other costs. Lower gas and power prices also may have raised capacity bids.
4 icfi.com © 2015 ICF International, Inc.Exhibit 5: Zone 4 2014–2015 and 2015–2016 Illustrative Capacity Supply Curves
Source: MISO, ICF
More IPPs and less contracted capacity led to higher cost-based bids in Zone 4: Zone 4 is the
only LRZ in which IPPs make up a greater portion of capacity than generation owned by or
contracted with a utility. Exhibit 6 illustrates IPP capacity in MISO by state. In addition, as
highlighted before, in this auction more retail load in Zone 4 procured capacity via auction rather
than through bilateral contracts, resulting in less contracted IPP capacity compared with the
previous auction. Because generators owned by a utility and generators with a power purchase
agreement (contracted IPPs) know they will earn enough to cover their fixed costs, they generally
bid low in the capacity market. In other words, such resources do not require a capacity market for
cost recovery. Because un-contracted IPPs do not have this security, they generally submit more
competitive cost-based bids. In other LRZs such as Zone 7 where a large portion of capacity is
regulated or contracted (approximately 85 percent), the number of low bids is large. Therefore, the
higher bids from uncontracted IPPs are less likely to clear.
Exhibit 6: IPP Capacity by State
Source: SNL Financial
5 icfi.com © 2015 ICF International, Inc.Higher bids were likely seen in Zone 4 in this auction for three reasons:
1) Costs for environmental compliance are higher: With the implementation of the MATS ruling
coming in 2016, coal plants have and will face higher costs to comply with the new environmental
standards such as installing selective catalytic reduction or paying for ash disposal. The need to
recover these costs specifically by merchant generators may have influenced the higher bidding
strategy in this auction. PJM experienced a spike in its 2014–2015 and 2015–2016 Base Residual
Auctions for this reason. Regional transmission organization (RTO) capacity prices increased by
approximately $100/MW-day, compared with the 2013–2014 auction.
2) Expected energy margins are lower for merchant generators: Zone 4 is a coal-dominated
region, with more than half of its capacity and generation coming from coal plants. However, in
some peak hours, higher priced gas units set the marginal price. With gas prices declining, gas units’
marginal cost is lower, leading to lower energy prices and lower energy margins for the price-taking
coal units. In addition, with MATS implementation, all coal units will be required to operate their
retrofits at full capacity. The result will be an increase in the units’ variable cost, thus further lowering
their energy margins. To make up for this lost revenue, generators bid higher in the capacity market.
3) Offer price threshold (reference price) is higher: As illustrated in Exhibit 7, MISO increased the
offer price threshold for identifying economic withholding to $155.79/MW-day, a nearly $13/
MW-day increase from the 2014–2015 auction. This threshold is tied to PJM capacity prices for each
auction period. The PJM RTO clearing price increased to $135/MW-day in the 2015–2016 auction
largely because of increased costs from environmental compliance and lower expected energy
margins. Thus, when PJM prices increased, these added price considerations were automatically
taken into account in MISO’s offer mitigation rule. However, as this threshold is linked to PJM
capacity prices that change each auction period, it facilitates volatility in the MISO market. Based on
the current MISO tariff and the fact PJM capacity prices plummeted in 2016–2017, ICF estimates
that the reference price and the opportunity cost for supplying into neighboring markets in MISO
will decrease from $155.79/MW-day to $71.7/MW-day.
Exhibit 7: MISO Reference Price (opportunity cost of exporting to PJM)
2014–2015 2015–2016 2016–2017 2017–2018
PJM Clearing Price
125.5 136.2 59.4 120
$/MW-Day
MISO Bid Threshold 142.9 155.8 71.7 136.4
Source: MISO, ICF
More capacity under fixed resource adequacy plans and contracts leads to lower prices: In
the 2015–2016 auction, several zones (1, 3, 6, and 7) saw large increases in the amount of FRAP
capacity. Because this capacity and other contracted capacity can be seen as effectively bidding $0/
MW-day into the auction in each zone, downward pressure was put on prices. In contrast, in Zone 4
the marginal decrease of 36 MW in self-supply resources did not have a material impact on capacity
prices. However, more retail load in Zone 4 relied on the auction to procure capacity instead of
bilateral contracts.
Zone 7 clearing price decline likely due to an increase in FRAP and decline in PRMR: In the
2014–2015 auction, the unit that set the marginal price was in Zone 7 at $16.75. Zone 7 saw one
GW of capacity shift from offering in the auction to being a fixed resource. Moving one GW to a $0
bid in using the 2014–2015 supply curve and clearing against the 2015–2016 PRMR would lead to a
6 icfi.com © 2015 ICF International, Inc.clearing price in the zone around $6/MW-day. Because this estimated price is slightly higher than
the cleared price of $3.48, Zone 7 most likely saw a shift to less competitive bids. The graph below
demonstrates the capacity supply curve in the 2014–2015 auction and ICF’s illustrative 2015–2016
supply curve.
Exhibit 8: Zone 7 2014–2015 and 2015–2016 Estimate Capacity Supply Curves
Source: MISO, ICF
Looking Ahead
More than two GW of retirements anticipated in the 2016–2017 auction: More than two GW of
announced coal retirements will occur before the 2016–2017 planning period. These coal units have
previously received a one-year extension for MATS compliance and have waivers from the Federal
Energy Regulatory Commission to avoid retirement penalties in MISO.
Capacity committing to PJM: With MISO’s low capacity prices, power plants operators have an
increasing incentive to interconnect to PJM. This incentive was seen in MISO when Covert, a 1.1 GW
combined cycle unit in Zone 7, began the process of interconnecting to PJM and cleared in PJM’s
2016–2017 and 2017–2018 auctions. This trend also has been seen in other regions with low capacity
prices as well. For example, Roseton, a plant located in New York Independent System Operator, cleared
in ISO-NE’s higher-priced 2018–2019 auction. ICF expects that this movement will continue in MISO as
PJM’s capacity prices continue to remain at levels higher than those in MISO.
Tightening supply and demand balance in Zone 7: Although prices declined in Michigan in this
auction, going forward, capacity losses are expected to increase prices moderately. In the 2016–2017
auction, Zone 7 will face 1.1 GW of the ISO’s coal retirements due to MATS compliance. It also will realize
the loss of 1.1 GW of Covert in the 2016–2017 auction period. Even though this loss will put a strain on
the supply and demand balance in Zone 7, using the current estimated supply curve, it would only
push Zone 7 prices back up to the $16 to $20/MW-day range.
7 icfi.com © 2015 ICF International, Inc.Significant additional retirements and de-rates are possible: In the October 2014 Long Term
Resource Adequacy Update, MISO estimated that 15 percent of the coal capacity in the ISO will retire
due to MATS compliance by 2016. This proportion includes approximately three GW of announced
retirements and seven GW of unannounced or confidential retirements. Units in MISO must file their
retirement with MISO 26 weeks before their change in status date, so the 2016 MATS-related retirements
may not be announced until the end of 2015. Approximately 35 GW of capacity are expected to install
environmental retrofits in 2015 and 2016 to comply with MATS regulation which could potentially put
upward pressure on the capacity price bids in the upcoming 2016 auction.
While MISO has historically had a significant amount of surplus capacity, these retirements will lead to
a tighter supply and demand balance. In addition to MATS retirements, MISO projects that
approximately 11 GW of coal capacity is at risk by 2020 due to the Clean Power Plan. In addition, the
MISO market monitor reports that a 50 percent de-rate is appropriate for demand resources. This
de-rate has yet to be implemented.
Due to system inefficiencies related to competitive entry in the MISO capacity market, that prices are
unlikely to remain at the higher, stable level going forward necessary to make whole new builds in the
system. These inefficiencies include the vertical demand curve, the voluntary nature of the auction for
portions of a utility fleet (in contrast to PJM where the entire utility must be in or out), more clarity on
minimum offer price rules, a substantial number of low bids from regulated units, a lack of forward
commitment (as in PJM and ISO-NE), and volatility in threshold for economic withholding (linked to PJM
capacity prices). Thus, the expected decline in reserve margin will either need to be met with reform in
the capacity market or a greater amount of capacity contracted by utilities. This could translate into
more opportunity for new assets to secure or enter into a PPA.
8 icfi.com © 2015 ICF International, Inc.icfi.com About the Authors
©2015 ICF International, Inc. Himanshu Pande: Himanshu Pande joined ICF in 2007 and is an expert in U.S.
electricity markets. Mr. Pande has five years of experience in modeling and
Any views or opinions expressed analysis of U.S. wholesale power markets and his six years of project portfolio
in this white paper are solely those experience includes U.K., Singapore, and Australian energy markets. Mr. Pande
of the author(s) and do not
has expertise in statistical, optimization, and simulation modeling, along with
necessarily represent those of ICF
International. This white paper is power market asset valuation and risk analysis.
provided for informational Mr. Pande has been involved in several projects involving power market valuations, cash-flow
purposes only and the contents
are subject to change without
forecasts, and energy market forward price curves for many different types of clients, including
notice. No contractual obligations independent power producers (IPP); investment firms; utilities; and state, federal, and local
are formed directly or indirectly by governments and regulators.
this document. ICF MAKES NO
WARRANTIES, EXPRESS, IMPLIED, He has a bachelor’s degree in Civil Engineering from the Indian Institute of Technology, Delhi,
OR STATUTORY, AS TO THE and a master’s degree in Operations Research from the London School of Economics
INFORMATION IN THIS DOCUMENT.
No part of this document may be
reproduced or transmitted in any Rachel Green: Rachel Green specializes in modeling and analysis of the U.S.
form, or by any means (electronic, wholesale power markets. She has experience in the areas of market
mechanical, or otherwise), for any assessment, asset valuation, and development support for private sector
purpose without prior written clients.
permission.
She joined ICF in 2014 after graduating from the University of Michigan where
ICF and ICF INTERNATIONAL
are registered trademarks of ICF she earned Highest Honors in Economics. She holds a bachelor’s degree in Economics and
International and/or its affiliates. International Studies.
Other names may be trademarks
of their respective owners.
About ICF International
For questions, please contact:
ICF International (NASDAQ:ICFI)
provides professional services and George Katsigiannakis | george.katsigiannakis@icfi.com | +1.703.934.3223
technology solutions that deliver
beneficial impact in areas critical Himanshu Pande | himanshu.pande@icfi.com | +1.703.218.2726
to the world’s future. ICF is fluent
in the language of change, Rachel Green | rachel.green@icfi.com | +1.701.225.2401
whether driven by markets,
technology, or policy. Since 1969,
we have combined a passion for
our work with deep industry
expertise to tackle our clients’
most important challenges. We
partner with clients around the
globe—advising, executing,
innovating—to help them define
and achieve success. Our more
than 5,000 employees serve
government and commercial
clients from more than 70 offices
worldwide. ICF’s website is
www.icfi.com.
EET WPR 0515 0217You can also read