MISSION IMPOSSIBLE: How car makers can reach their 2021 CO2 targets and avoid fines - Transport & Environment
←
→
Page content transcription
If your browser does not render page correctly, please read the page content below
MISSION
IMPOSSIBLE: How car makers can reach
their 2021 CO2 targets
and avoid fines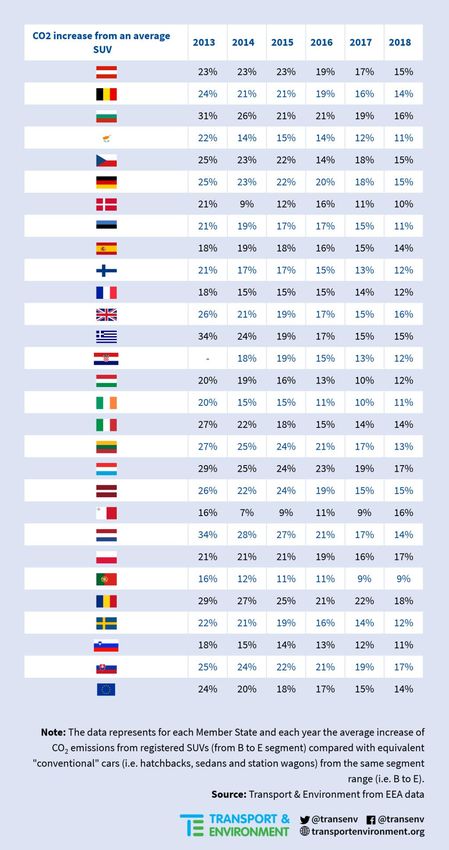
Transport & Environment
Published: September 2019
© 2019 European Federation for Transport and Environment AISBL

Editeur responsible: William Todts, Executive Director

Further information
Florent Grelier
Clean Vehicles Engineer
Transport & Environment

florent.grelier@transportenvironment.org
Mobile: +32 488 92 84 11

Square de Meeûs, 18 – 2nd floor | 1050 Brussels, Belgium
www.transportenvironment.org | @transenv | fb: Transport & Environment

Acknowledgements
This report was prepared by Transport & Environment based largely on data compiled by the European
Environment Agency. Analysis was undertaken by Florent Grelier with the support of Thomas Earl. The
report was written by Greg Archer and reviewed by Julia Poliscanova. The Editor-in-Chief is William Todts.

                                                                                                      2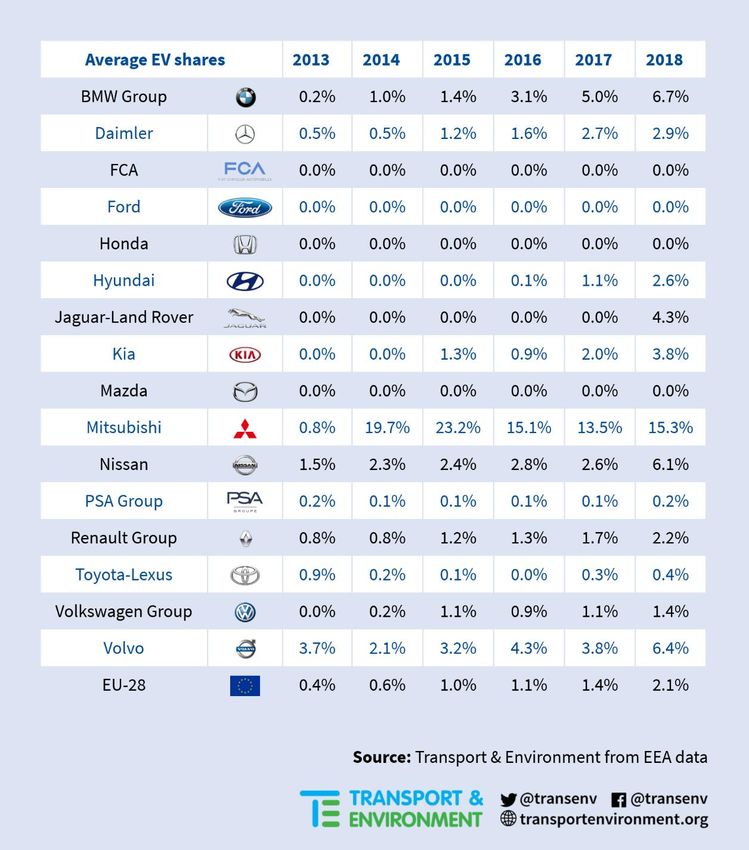
Executive summary
 Reducing CO2 emissions from all new cars and accelerating the uptake of zero emission models is
 essential to prevent a climate emergency. This is not a silver bullet - local and national policies
 need to reduce car ownership and use and promote active travel and shared mobility, which are
 also important. The EU car CO2 law setting a 95 g/km target for 2020/21 agreed a decade ago was
 intended to achieve a step change in car emissions crucial to decarbonising transport. But just 16
 months before the target comes into force carmakers are less than halfway towards their goals.
 This report examines why progress has been so slow and shows targets should still be met if
 companies invest to deliver the planned production goals for electric vehicles (both zero emission
 and plug-in hybrid models) and to make conventional cars more efficient. Some companies may
 also need to incentivise customers to opt for lower CO2 variants, such as by selecting a model with
 a slightly less powerful engine. The cost of the investments required to meet the CO2 standard is
 estimated to be about half of that incurred by the penalties that would kick in if carmakers fail to
 comply.

 The pitiful progress to date has been caused primarily by three factors. Firstly, a failure to
 significantly improve the CO2 emissions from conventional engined cars by fitting more clean
 technologies. Secondly, the very limited supply of zero emission and plug-in hybrid models,
 purposefully constrained by carmakers to keep selling conventional models. Thirdly, a huge
 growth in sales of SUVs that have leapt from 7% in 2009 to 36% in 2018 and are expected to reach
 nearly 40% by 2021. On average, SUVs have CO2 emissions 16 g/km (or 14%) higher than an
 equivalent hatchback model, and for every 1% shift in the market to more SUVs, the CO2 emissions
 increase by 0.15 gCO2/km on average. In other words, the increase in SUVs since 2013 has had a
 CO2 effect 10 times more than the diesel decline. In reality, carmakers’ performance is even more
 disappointing since half of the emissions reductions since 2008 happened through manipulation
 of the official laboratory tests.

                                                                                                        3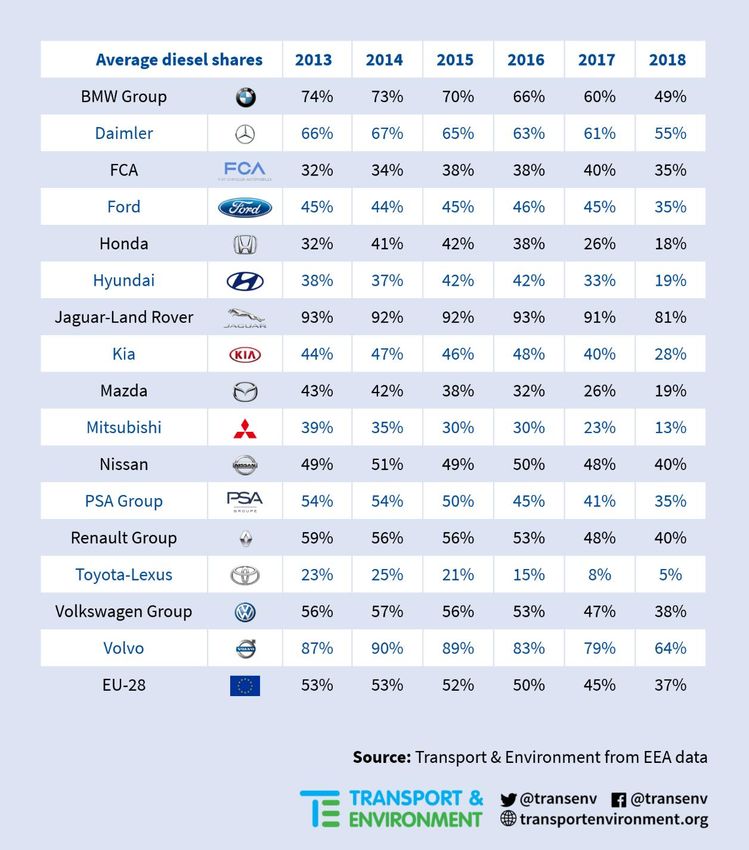
Toyota is best placed to be able to reach its target and has uniquely lowered emissions through
increasing deployment of full hybrid technology. The Renault-Nissan-Mitsubishi Alliance has the
next smallest gap to close in large part due to an early focus on sales of EVs. The companies with
the largest gap are: Honda, Hyundai-Kia, Daimler and Volvo, but the latter two are expected to
comply shifting a large part of their sales to plug-in-hybrid technology. Fiat-Chrysler also have a
large gap but following their pooling with Tesla is comfortably placed to achieve its target. It is
clear most carmakers have chosen to pursue short-term profit focused strategy, delaying the
necessary investments until the last possible moment.

Compliance plans to meet targets will comprise of four principal elements:

1. increasing sales of zero emission and plug-in hybrid electric vehicles (the most future-proof
   strategy);

2. investing in technology to lower CO2 emissions of conventional vehicles (including mild and
   full hybrids);

3. pricing, sales and marketing approaches to encourage customers to buy smaller and less
   powerful engines (with margin implications); and

4. pooling with another company (like FCA with Tesla).

The report assesses which combination of measures carmakers will need to adopt in order to meet
their targets and is summarised in the figure below.

Overall, the analysis forecasts the EU-wide sales of EVs will go from 2% in 2018 (2.9% in June
2019) to 5% in 2020 (3-7% range) and 10% in 2021 (7-12% range). Around half of sales are
expected to be ZEVs and half PHEVs. The jump in EV sales in 2021 results from the EU CO 2 target
applying to all cars sold in 2021 (not 95%) and because many carmakers will need to make use of
most of their super-credit allowance in 2020 already to meet the target. The range results from the
flexible design of the regulation that allows carmakers to do more or less to lower the CO 2
emissions of conventional cars (e.g. by shifting sales to lower CO2 variants or limiting sales of
highest emitters, such as sports cars and premium SUVs).

The rise in EV sales is significant but new data from IHS Markit anticipates a tripling in the number
of EV models available by 2021 and a corresponding large increase in production. To meet targets
carmakers will need to ensure the planned production is available on time, or will need to resort
to last-resort approaches like ending sales of their highest emitting models that deliver high
margins. However, there are good reasons for optimism that the new production in coming years
will be sold. Surveys of prospective buyers indicate an immediate untapped market of at least
10%. EV prices will fall with cheaper batteries and large-scale production facilities. Most
governments have implemented tax breaks and grants reducing the higher upfront costs for
private buyers, and the total costs of owning an electric car are falling sharply, making this an
attractive option for fleets. New charging infrastructure is being installed EU-wide and more
charge points are rolled out across main EU motorways and in residential areas. In addition, sales
in Norway now count towards the target where 50% of new car sales are now EVs. A large increase
in sales and marketing efforts is also changing buyer attitudes with EV advertisement now
commonplace in many markets and an array of EV launches planned for this year’s Frankfurt
Motor Show. Some companies will offer whole small city car range as electric, or seek to stock
their car sharing fleets with electric cars; others will encourage staff to take EVs as company cars
as a means to ensure the necessary sales are achieved. Achieving the required EV sales is a realistic
prospect despite the current wide gap to be bridged.

                                                                                                        4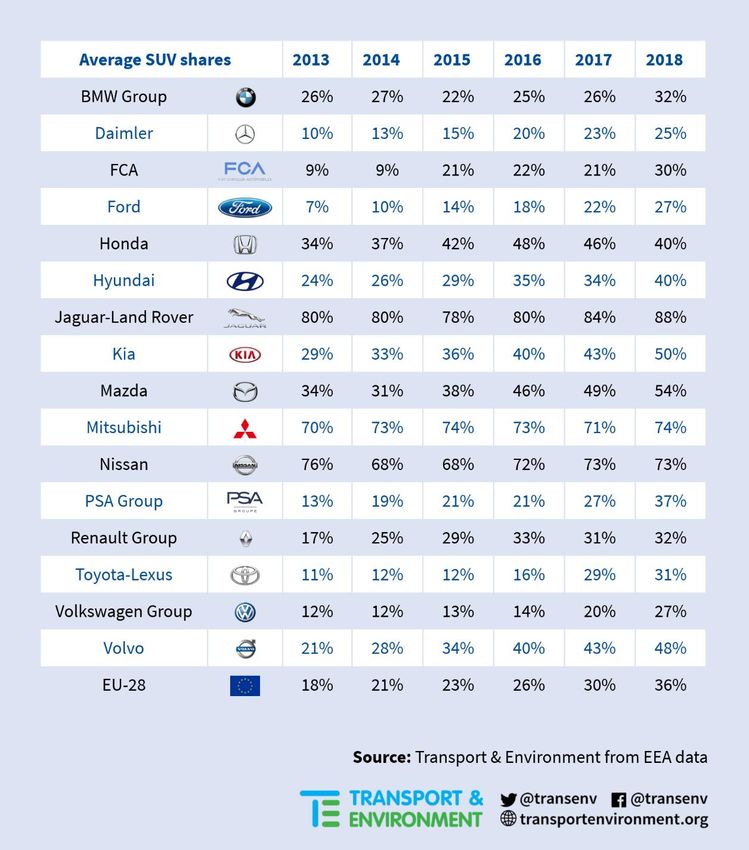
5
To ensure the regulation achieves its objective and is met there are several actions policy makers
should take. Firstly, the car CO2 law is the centrepiece of EU transport emissions policy, it was
agreed a decade ago and most carmakers have invested billions in order to comply. The new
European Commission should enforce the regulation as intended and not introduce any last-

                                                                                                     6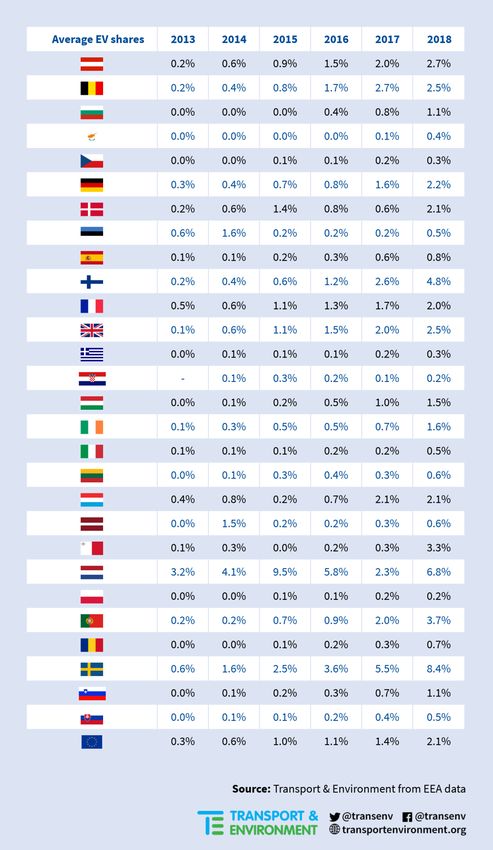
minute weakening under pressure from carmakers or their governments. Secondly, the
Commission and Member State testing services and type-approval authorities must ensure there
is no manipulation of test results through an extensive process of conformity checking. Thirdly,
governments should assist in the shift to zero and low emissions vehicles by reforming systems of
car taxation to increase incentives for zero emission vehicles and raising taxes on high CO 2 models.
Making high mileage fleets such as taxis and corporate fleets zero emission as soon as possible (as
some countries are already doing) will also accelerate EV uptake, as will support for installing
charging infrastructure.

The analysis presented in this report shows that although carmakers have fallen far behind the
targets, they can and should be met. The 12-year lead time before the target fully applies has
unquestionably been wasted by most carmakers except Toyota and Renault-Nissan. Claims that
the fall in diesel sales is the cause of rising emissions are false - it is the rise in SUVs, driven by
carmakers aggressive marketing of these vehicles that have been the main driver of rising
emissions. If the companies do incur penalties they will only have their own bad decisions and
woeful planning to blame, and the penalties will be a necessary reminder they have environmental
responsibilities that cannot be ignored.

                                                                                                          7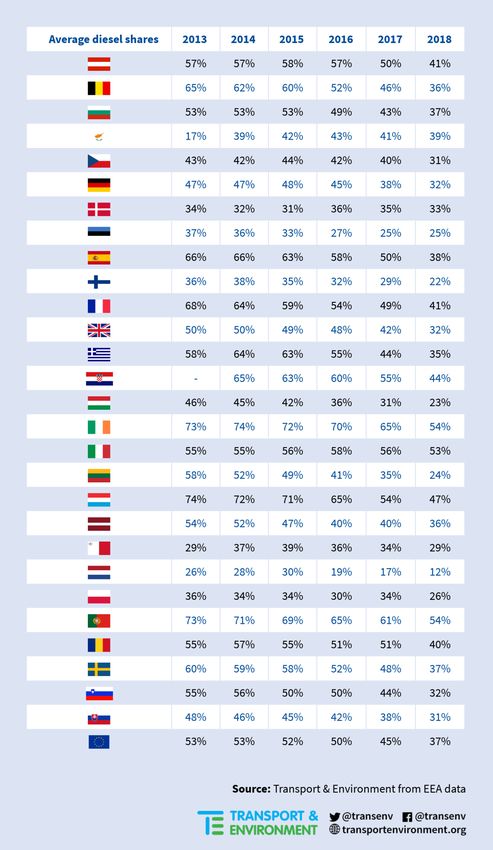
Table of Contents
List of acronyms                                                                        9
1. CO2 emissions from cars                                                             10
  1.1 Drivers of increasing emissions                                                  10
  1.2 This report                                                                      11
2. New car CO2 emissions trends                                                        13
  2.1 Long-term trend                                                                  13
  2.2 National progress                                                                13
  2.3 Early attempt at reducing emissions - Voluntary agreement                        14
  2.4 Targets for 2015                                                                 15
  2.5 Current regulations for 2020/21                                                  16
  2.6 Future regulations                                                               17
3. Why has progress stalled?                                                           18
  3.1 The impact of declining diesel sales                                             18
  3.2 The impact of rising SUV sales                                                   19
  3.3 The impact of sales of hybrid, electric and alternatively fuelled vehicles       21
  3.4 The impact of improvements to ICE emissions                                      23
    3.4.1 Eco-innovations                                                              24
  3.5 Effects of changes to tests                                                      25
4. Compliance options                                                                  26
  4.1 Progress to 2018                                                                 26
  4.2 Compliance options and regulatory flexibilities                                  27
  4.3 Assessment approach                                                              28
  4.4 Compliance with 2020 targets                                                     30
  4.5 Compliance with 2021 targets                                                     30
  4.6 Comparison of planned production and sales requirements                          32
5. Conclusions and Policy recommendations                                              34
  5.1 Why carmakers made so little progress                                            34
  5.2 How carmakers can meet the 2020/21 targets                                       35
  5.3 Are the expected EV sales realistic?                                             36
  5.4 Beyond 2021                                                                      38
  5.5 Policy recommendations                                                           39
  5.5 Final thoughts                                                                   39
Annexes                                                                                41
  Annex 1 - Methodology of the model                                                   41
  Annex 2 - Trends per Member State (2013-2018)                                        45
  Annex 3 - Trends per car manufacturer (2013-2018)                                    50
  Annex 4 - 2018 gap to close to 2020/21 CO2 targets per pool                          55

                                                                                   8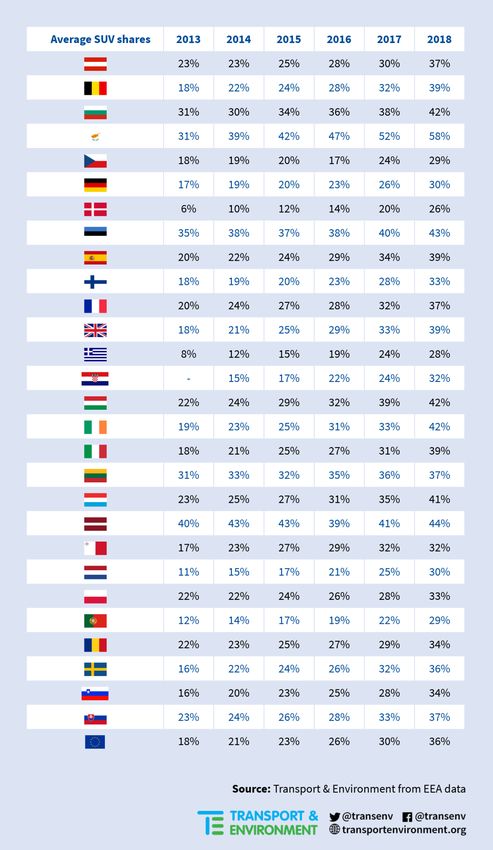
List of acronyms
% pa    Percentage per annum
BaU     Business as Usual
CO2     Carbon dioxide
CO2eq   Carbon dioxide equivalent
EEA     European Environment Agency
EU      European Union
EU13    Member States who have joined the European Union since 2004
EU15    Member States who have joined the European Union before 2004
EU28    European Union including 28 Member States, i.e. with the United Kingdom
EV      Electric vehicle, including plug-in hybrid and zero emission vehicles
GHG     Greenhouse gas
HEV     Full Hybrid Electric Vehicle, to be considered as an ICE car
ICCT    International Council on Clean Transportation
ICE     Internal Combustion Engine, i.e. conventional powertrains (diesel or petrol mainly)
JRC     European Commission’s Joint Research Centre
LED     Light-Emitting Diode
LPG     Liquified Petroleum Gas
NEDC    New European Driving Cycle, EU’s former laboratory test procedure
NOx     Nitrogen oxides
OEM     Original Equipment Manufacturer
pkm     Passenger kilometre
PHEV    Plug-In Hybrid Electric Vehicle
SUV     Sport Utility Vehicle
T&E     Transport & Environment
TCO     Total Cost of Ownership
UK      The United Kingdom
WLTP    Worldwide harmonized Light vehicles Test Procedure, EU’s current laboratory test procedure
ZEV     Zero Emission Vehicle

                                                                                                     9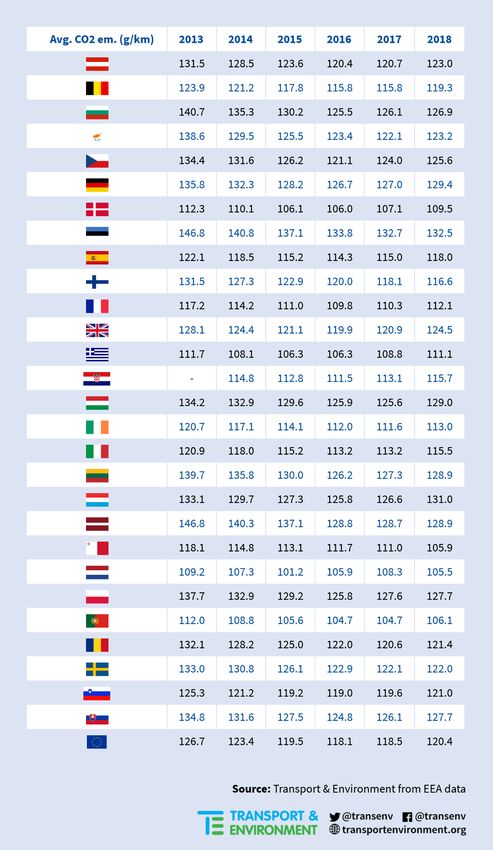
1. CO2 emissions from cars
1.1 Drivers of increasing emissions
The world is currently on track for three degrees of global warming by 2100, double the aspiration of the
Paris Climate Agreement. It is a nightmare scenario in which the reckless overuse of fossil fuels imposes
enormous economic and human costs. Transport is Europe’s biggest source of carbon emissions,
contributing nearly 30% to the EU’s total CO2 emissions. Cars emit 44% of transport emissions (Figure 1)
which since 1990 have risen and are still rising. To achieve the Paris goals and avoid a climate emergency,
road transport CO2 emissions will need to be entirely decarbonised by 2050 which will require the sale of
the last car with an engine ideally by 2030 and by 2035 at the latest.

                        Figure 1 - EU transport greenhouse gas (GHG) emissions per sector in 2017

EU CO2 emissions from cars have risen since 1990 from 461 to 543 million tonnes CO2eq in 2017. They declined
during and immediately following the financial crisis but are now increasing again. If the lifecycle emissions
of biofuels were properly accounted for (instead of being considered fully renewable), greenhouse gas
emissions from cars and vans would be on average 10% higher than official figures. The increase in car CO2
emissions is being driven by a combination of factors:

    1. Total travel continues to increase so car passenger kms (pkm) is rising at about 1% per year (Figure
       2) and cars continue to be used for about 71% of all pkms. The growth in car use is largely driven by
       an increase in EU13 countries1 where car ownership is growing and the share of public transport
       falling. This unsustainable trend is forecast to continue: between 2000 and 2025, car ownership
       rates in EU13 countries are expected to double whilst those in EU15 are projected to rise by a
       quarter.
    2. Efficiency improvements on the road have been extremely modest (about 1% pa) despite the
       introduction of new car CO2 emission. In 1995, CO2 emissions on the road from new cars were around
       203 g/km.2 Today, they are still around 170 g/km.

1
 Newer EU members - largely from Central and Eastern Europe
2
 Based upon NEDC emissions of 186g/km in 1995 and a 9% gap between test and real-world emissions (this gap corresponds to the
year 2001 from ICCT data and is assumed to be the same for 1995)

                                                                                                                       10
3. Sales of lower carbon alternatively fuelled vehicles have failed to grow significantly - constrained by
a lack of market choice and high prices. However, sales are now growing quickly. In the first quarter
of 2019, 8.5% of new car sales were alternatively fuelled: 4.6% hybrids; 2.5% electric vehicles (EVs
including zero emission and plug-in hybrid models). EV car sales grew by 40% year on year and
hybrids by a third.
Figure 2 - Drivers of rising car CO2 emissions
This report focuses on one of the tools to reduce CO2 emissions from cars - lowering the CO2 emissions of
new cars and driving the shift to zero (tailpipe) emissions through CO2 regulation of new cars. This is one of
the EU’s biggest carbon saving regulations, but tackling car CO2 emissions cannot rely exclusively on one
approach. Policies to encourage sharing of vehicles and trips rather than private ownership of cars is also
essential to encourage better travel choices when and where private cars are used, to lower the pkms being
driven. Improved alternatives to the car, including public transport, walking and cycling infrastructure must
be installed to encourage drivers out of their cars and provide real choice. Tax policies must reward shifts
to less car use including through road pricing. However, it is clear the car will remain an intrinsic part of
personal mobility for at least the first half of the twenty-first century and lowering the emissions of new cars
is a key element of lowering emissions.
1.2 This report
The introduction to this report has documented the dominant role of car CO2 emissions on overall transport
emissions and the importance of shifting to lower and zero emissions (tailpipe) models as one strategy to
lower overall car emissions but which must be complemented by policies to reduce car use overall.
Section 2 examines the long-term trends in new car emissions and also how new car emissions vary across
the EU as a result of national car tax policies. It also describes the history of new car CO2 regulation and
shows how it is long term trends that are driving the recent trends to rising emissions.
11Section 3 examines in detail how the shift to bigger and more powerful cars have offset much of the
progress to reduce emissions to date and are now the primary cause of rising emissions. It also considers
the effect on emissions of the decline in diesel car sales and failure to supply sufficient alternatively fuelled
vehicles and technology to lower emissions.
Section 4 focuses on the different compliance strategies companies are using to achieve 2020/21 targets,
and examines in detail which companies are comfortable to achieve targets, and those at risk of penalties
and how these can still be avoided.
Section 5 presents conclusions and some future policy recommendations regarding the shape of future
regulations and national taxes to help carmakers achieve future goals.
122. New car CO2 emissions trends
2.1 Long-term trend
The history of new car CO2 regulation to date is one of deception and failure. Deception since progress on
the road is half of that in laboratory tests. Failure that initial targets were missed or too easy to deliver whilst
in recent years progress has stalled and gone into reverse. There are, however, promising indications
current and future rules will finally lower emissions and accelerate the transformation to lower and
ultimately zero emission (tailpipe) cars. Figure 3 shows the long-term trend in new car CO2 emissions both
measured in the official laboratory test used in the past (NEDC) and real world emissions based upon a range
of fuel consumption statistics. The following sections examine what has driven this pattern of emissions
reductions to take lessons for how to accelerate progress in the future.
Figure 3 - New car average CO2 emissions measured using the NEDC test and calculated in the real world
2.2 National progress
The EU wide trends are not necessarily reflected at a national level where tax policies significantly influence
which cars are bought as shown in Figure 4. The highest average new car CO2 emissions are in Estonia and
Luxembourg which still average over 140 gCO2/km. The lowest is in Portugal and the Netherlands (106
gCO2/km). Since 2014, the biggest reduction has been achieved in Finland and Latvia (11 gCO 2/km); the
smallest in the UK where emissions have risen by 0.1 gCO2/km. The Netherlands used to have one of the
highest new car CO2 emissions in the EU but radically improved vehicle taxation to bring down emissions
sharply. National tax policies have a significant influence on the cars sold and Governments could do much
more to incentivise buyers to choose more efficient and electric models. Further information on national
statistics is detailed in Annex 2 - Trends per Member State (2013-2018).
13Figure 4 - National new car CO2 emissions in 2018
2.3 Early attempt at reducing emissions - Voluntary agreement
The first new car CO2 controls were introduced in 1998, as a Voluntary Agreement between the European
Commission and the car industry and were intended to reduce emissions from new cars by 25%. However,
the agreement failed, achieving only 18% of improvement instead. Figure 3 illustrates that from 1995 to
2001 the Agreement was initially effective reducing emissions both in the lab and on the road at an average
of 1.5% pa. This was in part due to a sharp increase in the share of diesel cars which jumped from around 1
in 5 to 1 in 3 new cars sold. The growth in diesel sales had begun around 1990 and was initially boosted by
the introduction of engines with improved direct injection with common rail systems and improved
turbochargers. Lower rates of tax on diesel fuel and more lax emissions standards on diesel cars helped
keep costs down and promote sales.
Figure 3 also shows that from 2002 to 2007, towards the end of the Voluntary Agreement, there was no
progress in reducing emissions on the road as the gap between test and real world emissions began to grow
(from 10% to 17%). The rate of progress in the laboratory also slowed to 1.1% pa. Figure 5 illustrates the
primary causes for the slowdown in progress, carmakers increasing the engine power (by 10%), size and
weight of cars (that grew by nearly 100 kg over the period). SUV sales, that had been niche at around 3% of
the market, also started to grow - doubling over the period. The small decline in lab-measured emissions
was in large part achieved by a surge in diesel sales to over 1 in 2 new cars, which helped to offset the loss
in efficiency from other changes. These early market trends are now creating challenges for carmakers to
meet better designed and more ambitious regulations.
14Figure 5 - Trends in key car characteristics affecting CO2 emissions
2.4 Targets for 2015
The first regulation of car CO2 emissions was adopted in 2009 setting targets of 130 gCO2/km (based upon
the NEDC laboratory test) that was phased in between 2012 and 2015. All major carmakers comfortably
achieved the soft 130 gCO2/km target, many several years early. Progress was greatly aided by the financial
crisis which precipitated a strong decline in CO2 emissions as the average size of cars bought reduced along
with their weight and SUV sales also fell. The diesel share initially dropped then rose again peaking at 55%
in 2011.
Attainment of the 2015 target was greatly assisted by carmakers continuing to find new ways to manipulate
NEDC test results to achieve ever lower emissions in the lab. Between 2008 and 2011 emissions in tests fell
at 3.8% pa but progress on the road was half of this level. As a result, the average gap between test results
and real-world emissions more than doubled from 20% in 2009 to 42% in 2016. From 2012 to 2016, virtually
all the improvement in CO2 was achieved in the laboratory where emissions fell at 2.7% pa with an on-road
reduction of just 0.4% pa. Had the gap between test and real-world performance been retained at 20% the
official NEDC test values would be around 22 gCO2/km higher and the 2015 target would have been missed.
In reality, meeting the weak 2015 target was largely an illusion.
A range of factors contributed to the gap widening alongside carmakers abusing test flexibilities. Notably
the widespread adoption of stop-start technology that was fitted to a quarter of new cars in 2011 and three
quarters by 2016 made a large difference to emissions on the NEDC test in which the car is stationary for a
fifth of the time - much more than the average drive. Downsized more efficient direct injection petrol
engines also began to enter the market increasing to around 50% of petrol powertrains by 2017. These
engines achieved impressive reductions in emissions driven on the undynamic NEDC test but not by more
aggressive drivers on the road. Both are illustrative of technology deployment being primarily driven by the
need to reduce emissions in tests not in reality.
152.5 Current regulations for 2020/21
The original 2009 regulation also adopted a more effective target of 95 gCO 2/km for 2020 but a fiercely
fought review of the rules finalised in 2014 phased in the target so that just 95% of sold cars count towards
the 2020 target with all cars being included in 2021. The 2020/21 regulation, which effectively applies from
the beginning of 2020, is complex with numerous flexibilities intended to maintain fair competition between
carmakers and allow different compliance approaches. For example, each carmaker:
1. Has their own target based upon the average weight of cars sold (the target for Fiat-Chrysler is
currently 92g CO2/km, and that for the BMW Group is currently 102 gCO2/km).
2. Can pool (combine sales and emissions with other companies) to enable an averaging out of
emissions across manufacturer groups and to encourage manufacturers of only electric cars (such
as Tesla).
3. Can also claim off-cycle credits (eco-innovations) for fitting technology to the car that delivers
emissions reductions on the road but not during the test (such as LED headlamps that are not
switched on during the test).
4. Producing a small volume of vehicles is treated differently. A weight-based target only applies to
pools selling more than 300 thousand models in Europe in a given year. Jaguar-Land Rover
therefore can apply for a derogation for an easier target (about 130 gCO2/km) than it would under
the weight-based system (115 gCO2/km). Carmakers selling very small volumes effectively set their
own targets.
5. Can claim up to 7.5 gCO2/km of super-credits, additional credits for sales of cars with emissions
below 50 gCO2/km which can be used between 2020 and 2022 (super-credits were introduced as
part of the agreement on the 2014 review).
Carmakers are now working towards the 2020/21 goals; but since 2016, the official new car CO 2 emissions
have been rising, a trend reinforced in the most recent provisional data for 2018 from the European
Environment Agency (EEA) which shows current fleet average new car CO2 emissions (based upon the NEDC
test) are 120.4 gCO2/km significantly above the 95 gCO2/km 2020/21 targets and 2.3 gCO2/km higher than
the minimum level achieved in 2016.
The current increase in new car emissions is frequently portrayed by carmakers as the result of the
unexpected sudden market shift away from diesel caused by Dieselgate. The evidence indicates it is rather
the result of the long-term trends to bigger and more powerful cars. The diesel market share has declined
since 2012 and that of SUVs rocketed up to a quarter of sales in 2016 and over a third in 2018. Engine power
has increased sharply between 2012 and 2017 by another 10%; although weight was stable at around 1400
kg reflecting an increasing focus on light-weighting. To date, sales of alternatively fuelled vehicles have also
been modest. These long-term trends are now creating considerable challenges for carmakers to meet their
2020/21 targets and are necessitating sudden shift in sales to lower and zero emissions vehicles as a result.
Those companies that have planned well are now on a secure glide path to achieving the targets whilst
those whose preparation was piecemeal are now struggling to achieve their goals.
A further contributing factor to the rise in new car emissions is that the industry has been unable to exploit
even more flexibilities in the NEDC test to continue to lower emissions in the lab. Both T&E and the ICCT
produced a series of critical reports drawing attention to the practices to deflate test results and the
Dieselgate scandal exposed the way carmakers cheated and exploited loopholes in regulations. The
European Commission has now closed some of the most egregious loopholes in the NEDC test and with the
switchover to the WLTP test, the gap between NEDC test and real-world emissions in 2017 actually shrunk
to 39%. Manipulating test results has been a key compliance strategy but most of the opportunities have
now been exploited.
162.6 Future regulations
At the end of 2018, new EU targets were agreed for 2025 and 2030 to lower new car CO2 emissions by 15%
and 37.5% respectively from 2021 levels. The basis for the regulation are measurements made using the
new WLTP test and the absolute values will be based on 2021 sales. Achieving the 2025 and 2030 targets will
require carmakers to further develop their compliance strategies. Specifically, it will become increasingly
expensive to meet these goals through improving the efficiency of cars with engines and a progressive shift
to EVs will be needed. The targets do not include a specific mandate for EVs but do reward carmakers that
exceed a benchmark level for these vehicles and for cars sold largely in EU13 countries where the market is
less developed. The report considers the degree to which current compliance strategies will be appropriate
in the next 10 years and beyond.
Beyond 2030 complete decarbonisation of the car fleet will be necessary to achieve net zero emissions by
2050. There is increasing consensus from policy makers, carmakers and environmentalist the solution
principally lies in a fleet of battery electric cars. Hydrogen fuel cells are also expected to make a niche
contribution but it is highly unlikely electrofuels could be produced in the volumes needed to power the car
fleet and will anyway be needed to decarbonise aviation. Hybrids and plug-in hybrids will not provide a
long-term solution as zero emissions (in use) will be essential. A fleet of zero emission vehicles by 2050
requires selling the last car with an engine ideally by 2030 and by 2035 at the latest. Several Governments
are now moving in this direction as attention is turned to how to achieve net zero emissions. At present, EU
single market regulations preclude banning all cars with engines. But EU Member States could choose to
implement aggressive tax policies that effectively achieve the same outcome.
Figure 6 - Proposed dates to end the sale of ICE cars
Companies struggling to meet 2020/21 targets that fail to rapidly reduce CO 2 emissions from the cars they
sell will become increasingly unprofitable and uncompetitive. The report therefore provides important
insights into the readiness of carmakers to respond to the opportunities and challenges the transition to a
net zero world creates.
173. Why has progress stalled?
The historical trends outlined in Section 2 highlight the important factors that lie behind the recent rise in
official new car CO2 data:
1. Real CO2 emissions on the road have not significantly improved since 2012 and the biggest
improvement in the official data originates from the widening gap between lab test and real-world
performance. This has contributed half of the 35% reduction in emissions since 1995. Since the gap
stabilised in 2015, and recently began to close slightly, the trend in official new car emissions has
been upwards.
2. The decline in diesel sales dates from 2012 but has significantly accelerated since the Dieselgate
scandal.
3. A large increase in the power of cars has offset measures to reduce emissions together with an
increase in the size, and until 2014 the weight of cars has offset measures to reduce emissions.
4. There has been minimal deployment of advanced technology to significantly lower emissions. The
share of hybrid electric cars has only grown slowly reaching about 3% in 2018. Only Toyota and
Lexus with nearly 60% of vehicles being hybridised have made significant use of this technology
despite the huge increase in larger SUV vehicles.
5. The share of EVs has also remained low - although is now growing quickly. EVs represented 2% of
sales in 2018, and all alternatively powered vehicles only 7.3%.
Overall, it is no surprise emissions are now rising. The following sections look in detail at the contribution
of the key drivers.
3.1 The impact of declining diesel sales
Dieselisation has been an important long-term compliance strategy for carmakers to lower CO2 emissions
in the past and declining sales have had a small contribution to the recently rising emissions. But the claims
of carmakers that this is the principal cause of recently rising emissions is not supported by the evidence:
- The efficiency gap between the average diesel and petrol car is small and was only 1.7 gCO2/km in
2018, or about 1.4%.
- The 4.7g/km rise in diesel emissions since 2016 is considerably greater than that in petrol: 1.8 g/km.
(Section 3.4). This worsening of average diesel emissions is largely the result of the fall in diesel
market share particularly affecting smaller cars (with lower emissions) and is related to additional
requirements to control real-world nitrogen oxides (NOx) and particle emissions.
Diesel cars have much larger (on average 1.8l) and more powerful engines (by about 15%) that offset much
of their inherent efficiency benefit. In contrast, petrol car engines are smaller (typically 1.35l) and have
downsized between 2005 and 2015, since then they have grown again slightly. In contrast, there has been
no downsizing of diesel engines since 2009. Both engines have significantly increased in power since 2009.
It is notable the average petrol car has the same power as that of a diesel in 2006. A previous T&E study also
highlighted diesels have high well-to-wheel emissions.
The car industry claims diesel engines are about 20% more efficient than an equivalent petrol car and the
slump in sales is a major cause of the higher CO2 emissions from new cars. But a recent study by the ICCT
found that the CO2 emissions of a petrol Volkswagen Golf were less than the diesel equivalent both in a
laboratory test and real-world driving. Whilst diesel cars burn less fuel, each litre produces 13% more CO2.
Modern diesel engines also require fuel-intensive NOx and particle reduction technologies and are heavier
than gasoline models thus offsetting some of the improvement. Diesel cars are also considerably more
expensive to manufacture than gasoline engines. In the case of the two tested Volkswagen Golf versions,
the December 2017 list price of the diesel vehicle was about €3,400 higher than for the gasoline vehicle - this
makes dieselisation relatively expensive for compliance purposes. Diesel and hybrid models are now priced
similarly but the average hybrid has emissions significantly lower emissions than a diesel (93 gCO2/km). A
18comparison of the current petrol and diesel Volkswagen Golf models with other C-segment models found
the emissions of the gasoline model were significantly less than other models whereas the diesel had similar
emissions. This suggests there is considerable potential for carmakers to lower the CO 2 emissions from
petrol cars by deploying similar technology to that used by Volkswagen.
Analysis of the most recent sales data from 2018 shows that Jaguar-Land Rover retains the highest share of
diesel (81%) and that it has been relatively unaffected by the decline in diesel sales with a reduction of just
10 percentage points since 2013 (EU average of a 16 percentage point decline). On average, with 2018
figures, for every 1% shift in the market away from diesel, the tailpipe CO 2 emissions increase by just
0.02g/km. If the 2018 diesel and non-diesel average CO2 emissions are mixed with the 2013 distribution, the
EU average would change by just 0.25g/km. The BMW Group has been strongly affected by the diesel decline
with its share of sales declining from 74% to 49% (26 percentage points but this has only raised its fleet
average CO2 emissions by about 0.5g/km). Mazda and Volvo are the only other companies with a decline of
more than 20 percentage points (driving less than a 0.5g/km rise). In contrast, FCA have actually grown its
share of diesel slightly to 35% in 2018.
Figure 7 - Percentage diesel sales in 2018 and change in percentage share 2013-18
The share of diesel vehicle sales at a national level also varies widely across the EU. The highest shares in
2018 are in Portugal, Italy and Ireland that remain over 50%; the lowest in Finland (22%) and the
Netherlands (12%) that also has the lowest average CO2 emissions. The biggest reduction in the share of
diesels sold from 2013 to 2018 have been recorded in: Lithuania (-34%), Belgium (-30%), Estonia (-28%) and
France (-27%). The diesel share in Cyprus has actually risen (by 22%) and remained constant in Malta. Fuel
and vehicle taxes across the EU significantly influence the take-up of diesel cars in different markets. Further
information on national statistics is detailed in Annex 2.
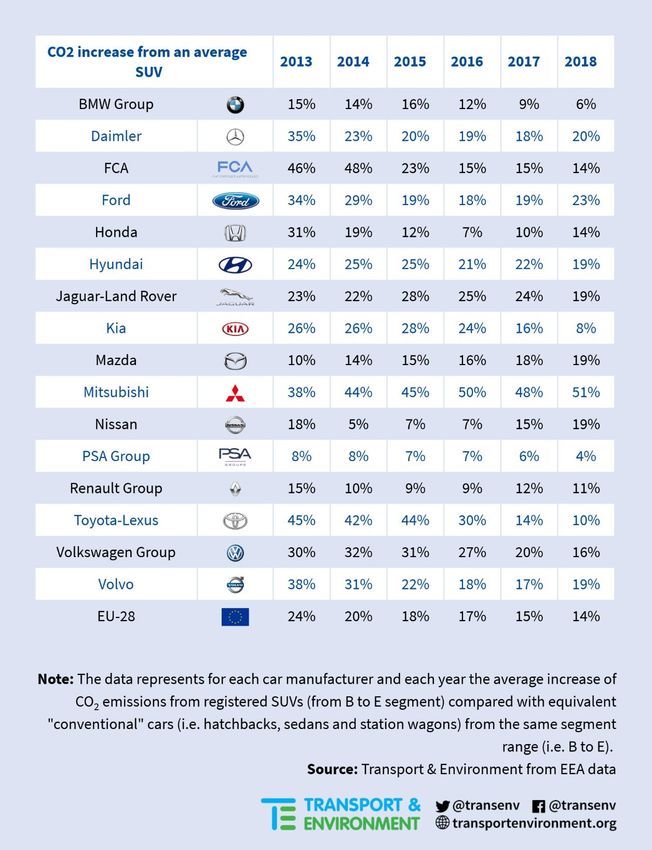
3.2 The impact of rising SUV sales
The growth in SUV sales began in the early 2000’s with sales of “Chelsea Tractors” (i.e. premium large 4x4’s
owned by affluent city residents) but has evolved to become a revolution in the size and shape of modern
19cars. More than a third of new cars (36%) are now defined as SUVs or crossovers of which: 48% are classed
as Compact; 32% Small; 15% Mid-size; and just 5% Large. The additional weight and poorer aerodynamics
mean these vehicles emit around 15% more CO2 than the equivalent hatchback, but this uplift varies widely
between carmakers. PSA’s SUVs typically emit just 4% more than the equivalent conventional model
whereas Ford’s SUVs emit 23% more. SUVs and crossovers also increase the amount of land needed for
parking and embedded energy and raw materials needed for construction.
Figure 8 - Percentage SUV sales in 2018 and change in percentage share 2013-18
In the EU, 5.3 million SUVs and crossover models were sold in 2018, an increase of 18% pa. The market shift
continues to accelerate with new models being continuously announced. Several companies are now
doubling their model offerings in the most popular segments such as small SUVs including: Ford, Toyota,
Jeep, Hyundai-Kia and Volkswagen Group. From a business perspective this is rational and profit driven,
but several companies expanding SUV offers are also struggling to meet CO2 targets and at risk of penalties,
including Ford and PSA. If targets are missed and penalties incurred, carmaker’s model choices and push to
sell SUVs will be a contributory factor.
The rise in SUV sales has not happened uniformly across all companies. As expected, Jaguar-Land Rover has
the biggest share of SUVs (88%), closely followed by Mitsubishi (74%) and Nissan (73%). The smallest share
is surprisingly Daimler (25%), despite being known for its premium models. The biggest growth in SUV sales
since 2013 has been achieved by: Volvo (27 percentage points), PSA Group (24 percentage points) and FCA
(21 percentage points); Nissan has actually experienced a (small) decline. The overarching trend is
highlighted by the EU average, with the SUV sales share doubling from 18 to 36% between 2013 and 2018.
On average, from 2018 figures, for every 1% shift in the market to more SUVs, the CO2 emissions increase
by 0.15 gCO2/km, or 7.5 times more than for every 1% drop in diesel shares. If the SUVs sold in 2018 had
the 2013 market shares, the EU CO2 average emissions would be 2.6 gCO2/km lower.
Across the EU sales of SUVs vary widely. In Cyprus an enormous 58% of new cars sold were SUVs in 2018.
Countries with more than 40% sales in 2018 were: Bulgaria, Estonia, Hungary, Ireland, Luxembourg, and
20Latvia. The lowest share is in Denmark (26%). The biggest increase in the proportion of SUV sales since 2013
has been in Cyprus (+27%), and Ireland (+23%), Italy (+21%), while several countries saw an increase of 20%
(Belgium, the UK, Sweden, Denmark and Greece). Notably, Greece is the country with the least
improvement in overall emissions since 2013.
3.3 The impact of sales of hybrid, electric and alternatively fuelled vehicles
A shift towards alternatively fuelled vehicles, particularly increasing hybridisation of larger vehicles was one
of the anticipated approaches through which carmakers were expected to achieve the targets when
regulations were originally proposed in 2008. However, although there has been an increase in EVs and full
hybrids, to date progress has been very limited, constrained by the choice of models and availability of
supply. Whilst Toyota and Lexus have now achieved a 2018 market share of 56% hybrids and Hyundai-Kia
4.5%, no other manufacturer has chosen to supply more than 1% in recent years. The average hybrid
emissions are around 93 gCO2/km in 2018 compared to the average gasoline of 125 gCO2/km and diesel of
121.5 gCO2/km. The Toyota strategy has therefore been highly effective for achieving the 2020/21 targets
but will not be sufficient to meet more demanding 2030 goals and will probably need to be complemented
by a growing share of EVs for 2025 (which the company recently announced).
Figure 9 - Trends in sales of alternatively fuelled cars
Other alternatively fuelled vehicles such as natural gas and flex fuel cars do not deliver significant CO 2
savings but have fared even worse in terms of sales. Natural gas and LPG cars peaked at 3.7% in 2009 but
now represent just 1.4% of the market. FCA, Opel and Volkswagen Group have the biggest market shares
and notably both are struggling to achieve the CO2 targets. Flex fuelled cars actually disappeared entirely in
2013 with Saab. The trend in sales of alternatively fuelled cars is shown in Figure 9.
Sales of EVs are now growing strongly but from a low base. The increasing EV sales is the most likely
compliance path for most carmakers to achieve targets. Sales of all EVs reached 2% in 2018 (2.7% in the
final quarter, up 38% in year). Availability of models remains a huge constraint (but is expected to grow
significantly) along with the cost of cars and concerns there are insufficient charging points. The market
21shares of different manufacturers for EVs indicate which companies are best placed to grow sales to achieve
targets. Nissan together with Mitsubishi is the clear market leader overall with both ZEV and PHEV models
reaching 8% sales of EVs in 2018, closely followed by BMW Group (6.7%) and Volvo (6.4%) (even though the
Swedish manufacturer has relied so far on plug-in hybrid technology only). Jaguar-Land Rover (4.3%),
Hyundai-Kia (3.2%), Daimler (2.9%) and Renault Group (2.2%) are similarly well placed; the Korean group
being the only carmaker with a balance of ZEV, PHEV and HEV sales. Other companies need to rapidly
increase the offering of EVs to lower emissions and achieve targets, of these Volkswagen Group with
ambitious plans seems the best placed for this to be an effective compliance strategy.
Figure 10 - Company sales of ZEV, PHEV and HEV cars in 2018
At a national level there are wide variations in the proportion of EVs sold. The highest share of electric cars
in total (PHEV and ZEV) in 2018 in the EU was achieved in Sweden (8.4%) and the Netherlands (6.8%). Both
countries have supportive taxations systems. Norway achieved much higher levels (49%) of which 31% were
ZEVs. Norway has recently joined the CO2 regulation so electric cars sold there will count towards EU targets
in 2020/21. The biggest share of ZEVs in the EU was the Netherlands (5.9%) and that for PHEV Sweden (6.4%).
22Figure 11 - Sales of electric cars in EU countries
Section 4 examines the number of EVs that are likely needed to be sold to achieve targets.
3.4 The impact of improvements to ICE emissions
One of the key compliance mechanisms available to carmakers is to improve the efficiency of the
conventional (ICE) cars being sold. This could include fitting of low rolling resistance tyres, improved
lubricants, mild hybrid technology (full hybrid systems are considered in Section 3.3); cylinder deactivation;
light-weighting, improved and better calibrated diesel and petrol engines and a range of other solutions.
T&E examined changes in the emissions of conventional petrol and diesel vehicles since 2013. The analysis
showed is summarised in Figure 13. There has been very limited improvement in emissions from
conventional ICE cars in recent years. Since 2013, emissions from petrol vehicles declined by just 4.9
gCO2/km and those from diesels decreased by 5.3 gCO2/km. But the overall trend marks wide ranges
between different companies.
Figure 12 - Examples of technologies fitted on Volkswagen’s new 1.5-litre petrol engine
23The latest 1.5-litre petrol engine launched by the Volkswagen Group, available for instance on the current
Golf VII model, emits on average 115 gCO2/km (according to EEA’s 2018 database) with two power levels
offered (96 and 110kW), while the 1.4-litre petrol engine it replaces emits on average 121 gCO 2/km with a
power level of 92kW. This average improvement of 6 gCO2/km on the same model and with similar engine
power has been possible thanks to a package of engine technologies that are far from being mainstream on
petrol engines (yet) and include: a Miller cycle that increases thermodynamic efficiency (usually used on full
hybrid petrol engines), variable-geometry turbocharger (mainstream on diesel engines but not on petrol
engines), a direct injection system with a high fuel pressure of 350 bar while the current standard for direct
injection petrol engines is about 150-200bar; and also cylinder deactivation. Volkswagen is showing the
huge potential to lower petrol engined emissions that is currently largely unexploited.
Figure 13 - Percentage change in average petrol and diesel emissions by company 2013-18
3.4.1 Eco-innovations
Eco-innovations are another compliance mechanism that can reduce a few g/km of CO 2 from conventional
ICE vehicles. In 2018, the use of eco-innovations was minimal (3.6% of 2018 registrations), reducing the CO2
average emissions by just 1.5 gCO2/km considerably less than the 7.5 gCO2/km allowed. The two most widely
deployed eco-innovations are efficient alternators (that are fitted to about three-quarters of models to
which eco-innovations are deployed, each saving on average 1.5 gCO2/km); and LED lamps fitted to a
quarter of cars with eco-innovations saving on average 1.1g/km each. A small proportion of models have
both technologies saving on average 2.7 gCO2/km each. Underutilised eco-innovations that could deliver
significantly higher savings include:
● engine encapsulation (that keeps the engine warm reducing the additional fuel used during cold
starts) and which lowers emissions by 1.4 gCO2/km on average per vehicle on which it is deployed;
and
● coasting (a technology to reduce fuel use on highways) which saves 5.4 gCO2/km on average on each
model.
By 2021 it is estimated the use of eco-innovations will double to around 3 gCO2/km.
243.5 Effects of changes to tests
Section 2.1 outlined the significant differences between the improvement in new car CO 2 emissions
measured using the NEDC laboratory test and real-world emissions. The growing gap has offset 21 gCO2/km
of the real improvement in new car CO2 emissions but has not affected compliance with the regulation that
is based upon the NEDC test. There are however other changes to testing that do have an effect upon the
effective stringency of the regulation.
The introduction of the new WLTP test is not expected to have any significant effect until 2021, as the
regulation specifying how to adapt the 2020/21 CO2 targets for the WLTP test allows carmakers to double
test cars using both the NEDC and WLTP procedures (an approach that is expected to be widely used).
However, changes to the NEDC test procedures (referred to as NEDC 2.0) were introduced to eliminate the
most egregious abuses of the NEDC test. Specific changes include changes to the test parameters to ensure
the correct inflation of tyres by requiring the pressure to be between the manufacturers prescribed range.
Minimum allowed tyre tread depth has also been altered to be consistent with the WLTP regulation (an
average difference of 2mm is assumed from WLTP requirements). A more correct methodology to determine
the road load coefficients from measurements on sloped test tracks is also now used. Regarding the lab test
itself, the ambient temperature is specified to be at 25°C instead of a range of 20-30°C. The cumulative
impact of these changes is estimated to be about a 5% increase in NEDC test results and reduces the gap
between test and real-world performance making achieving the target marginally more challenging. This
change is nonetheless small compared to the widening gap created by test abuses. This effect is not
accounted for in T&E’s assessment of the way carmakers will achieve their targets.
254. Compliance options
4.1 Progress to 2018
This section looks at the progress of individual companies and possible compliance strategies to achieve
2020/21 targets. Figure 14 shows for each carmaker group the 2018 gap to close with the 2020/21 CO2
targets. The gap with the 2021 targets is the difference between the 2018 average CO2 value and the target;
the gap with the 2020 targets is the difference between the 95th percentile of 2018 CO2 performance and the
target.3 Data tables are provided in Annex 4. EU-28 data is analysed and the effects of Brexit not considered
but small. The companies are listed in order of their gap to the 2020 target. The company targets vary
depending on the average mass of the vehicles sold so companies selling larger and heavier cars have a
higher goal. There is a derogation for companies selling less than 300 thousand cars that particularly
benefits Jaguar-Land Rover.
Figure 14 - Company progress to 2020 and 2021 targets4
Figure 14 shows that the company with the largest gap to close by 2020 is Honda (30 gCO2/km). The
companies with the smallest gap are Toyota-Mazda (13 gCO2/km), Nissan (17 gCO2/km) and the Renault
Group (18.5 gCO2/km). The size of the gap illustrates the scale of the remaining challenge. If this gap was to
be closed exclusively by sales of EVs it would require an EU market share of about 24% by 2021. However,
this section highlights several compliance approaches that when used in combination can reduce the EV
take-up to more realistic levels in the next 2 years.
3
In 2020, 95% of all new car sales must reach the required target to avoid penalties, the 5% of highest emitting cars being excluded.
In 2021, 100% of sales are counted towards the target.
4
The graph presents data for company groups including where companies have agreed to pool outside of the group. In some cases,
these do not correspond to the current pools being used by the manufacturer within the regulation. For example, Hyundai and Kia
are currently treated separately in the regulation but are pooled here for presentational purposes. More information on the
considered pools in T&E’s model can be found in Annex 1.
26Most companies (BMW Group, Daimler, FCA, Jaguar-Land Rover, Renault Group, Volkswagen Group and
Volvo) have followed a similar trend in recent years with rising emissions since 2016. The rise for Volvo to
132 gCO2/km is particularly large creating a significant challenge for the company. Volvo has a high share of
both diesels and SUVs. For Ford and Mazda, emissions have been rising for 3 years. Toyota and Honda have
maintained a consistent decline since 2016 year on year. This is despite Toyota diesel sales shrinking from
25% in 2014 to just 5% in 2018, illustrating the success of its hybrid strategy.
4.2 Compliance options and regulatory flexibilities
There are three principal strategies carmakers can deploy to lower emissions and achieve their targets:
1. Selling more zero emission and plug-in hybrid cars with significantly lower CO2 emissions (this is
also the best long-term compliance strategy beyond 2020/21). Cars with emissions below 50
gCO2/km (battery, fuel cell and most PHEVs) earn super-credits until 2022 and help carmakers hit
the CO2 targets.
2. Lowering CO2 emissions of conventional diesel and petrol cars being sold through fitting additional
technologies to improve efficiency. This can include fitting mild and full hybridisation to more
models, as well as improving tyres rolling resistance and engine efficiency, e.g. the package found
on Volkswagen’s new 1.5-litre petrol Golf. Technologies can lower emissions either in the test or on
the road (eco-innovations). Hybridising conventional engines, in particular on larger SUV models,
stands out as having good potential (albeit short-term) to meet the 2020/21 targets as shown by
Toyota.
3. Selling more lower emissions/power diesel and petrol models and fewer high emitters as a short-
term strategy through marketing and pricing strategies & incentivising dealers (e.g. selling a petrol
Volkswagen Golf version with a lower 85 kW engine rather than today’s more popular high power
version of 96 or 110 kW). On average, encouraging 20% of customers to shift to a smaller or less
powerful engine will typically deliver about 1.6 gCO2/km reduction in fleet average emissions. A
variation of this is to withdraw the highest emitting models (or engines) from sale, e.g. some high
performance cars such as sold under the Mercedes’ AMG or BMW’s M ranges. Withdrawing the 5% of
highest emitting models achieves a further CO2 reduction of about 2% on average (e.g. 2.5 gCO2/km
less CO2 for 2018).
Each approach has costs either in terms of additional technology and manufacturing costs or lower margins
(as high emission models achieve higher margins). But the cost of compliance is estimated to be much less
than half that of the penalty of €95 per gCO2/km per vehicle sold. According to Evercore, based upon
discussions with carmakers, the total cost of CO2 compliance with 2020/21 targets is between €40/g and
€60/g5 from a 2018 baseline. (The higher figure is unlikely to be an average cost).
In addition to these compliance strategies, the regulation also includes numerous flexibilities to help
carmakers achieve their goals. This includes pooling (combining targets between brands) - an approach
successfully deployed by FCA that has linked up with Tesla; as well as Mazda that will pool with Toyota that
will overachieve its targets. Whilst there is unquestionably a cost to those companies buying credits, there
is also a revenue for those over achieving their targets. Many companies are also pooling within their groups.
Super-credits, double counting of cars with emissions below 50 gCO2/km sold in 2020 (the factors are 1.67
and 1.33 in 2021 and 2022 respectively) can also significantly help carmakers achieve their goals. Up to 7.5
gCO2/km of credits can be used towards targets between 2020 and 2022 and most companies are
anticipated to make use of this flexibility. Another important flexibilities in the regulation are eco-
5
Evercore ISI, Global Automotive, CO2 – The biggest structural 2020/21 headwind, April 2019
27innovations. The switchover to the WLTP test will also have no significant impact as carmakers are
permitted to double test vehicles on the NEDC test. The inclusion of Norway into the regulation will also
assist carmakers achieve their goals as almost 50% of roughly 150k cars sold in Norway are EVs, helping
companies lower average emissions and earn super-credits through selling EVs in Norway.
4.3 Assessment approach
In order to evaluate whether carmakers will be able to comply with the regulation; and how many EVs they
need to sell in order to do so; T&E assessed to what extent improvements in conventional vehicles; and
altering the sales mix to lower CO2 models can close the gap. We then calculated the number of EVs needed
to meet the target and reviewed whether this was feasible compared to current sales and planned
production (using another database from IHS Markit). This gives a good indication of which companies are
at greatest risk of non-compliance.
How much carmakers plan to invest in improving the efficiency of ICEs is not fixed and neither is the degree
to which they intend to encourage customers to buy lower emission models. The analysis therefore
estimated the number of EVs the carmaker would need to sell assuming a Business as Usual (BaU) approach
and a series of scenarios in which companies put more or less dependence on selling EVs as against the
other options to meet the target. Table 1 below summarises the compliance plan scenarios.
Table 1 - Description of the different scenarios used in T&E’s model
Further details of the modelling approach are detailed in Annex 1. To estimate the improvement in ICE
vehicles that was possible, T&E looked at the reduction in CO2 these models achieved over the period 2013-
18 and then used cost-curves developed by the European Commission to estimate the level of spend this
would equate to. For the BaU scenario, this investment was continued and for other compliance plans a
higher spend rate for 2013-21 was applied.
To estimate the impact of the sales shift, T&E examined the impact of one in five customers downsizing to
the next smaller engine or power variant. By doing this, they are helping the carmaker achieve its targets by
shifting to a lower CO2 model. This can be achieved relatively easily by pricing differentials (placing a higher
cost on the higher CO2 model and lower one on the lower CO2 option); and by incentivising dealers to sell
lower CO2 models through their bonus and dealership targets. This has a small impact on CO2 but could help
achieve some targets.
The impact of ceasing sales of the highest emission models was determined by calculating the difference
between the fleet average emissions of the 95th percentile and 100th percentile for cars sold in 2018.
Based on these 3 factors a business as usual and 3 compliance plans were developed, each with a different
number of EVs required to meet the company target. The plans are:
281. Business as Usual - Carmakers continue to lower CO2 emissions from conventional powertrains (i.e.
diesel, petrol, full hybrids) at the same level as done until 2018 (per segment and fuel type - the EU
average is around €20/gCO2). This means CO2 emissions from conventional vehicles fall through use
of, for instance, low rolling resistance tyres, cylinder deactivation, mild-hybridisation, etc. However,
the investment is restricted and technologies therefore deployed on a limited range of models. The
remaining gap to targets is met exclusively through selling EVs. For each company the ratio of PHEV
to ZEV is based upon IHS’s production mix for 2020/21.6 This is the most conservative scenario and
corresponds to the maximum share of EVs the company needs to supply to meet goals. This is the
preferred plan if the company is able to achieve its targets.
2. Plan 1 - EV High - with this option carmakers increase investment in conventional powertrains
raising spend between 2013-2021 by 10% compared to what has been spent from 2013 to 2018. This
means larger deployment of conventional lower emission technologies including more expensive
technologies fitted to more vehicles than for Business as Usual and therefore fewer EVs are required
to achieve targets than for BaU. Companies able to supply relatively high shares of EVs may adopt
this plan minimising spend on conventional technologies.
3. Plan 2 - EV Central - with this option carmakers increase investment in conventional powertrains
raising spend by 20% compared to what they spent up to 2018, plus take steps to alter the sales
profile of their best selling models towards lower emissions variants so that 1 in 5 customers buy a
smaller or less powerful engine (e.g. selling a Volkswagen Golf with an 85 kW engine instead of the
96 or 110 kW option). In practice, this means a carmaker makes their smaller/lower emitting car
models more attractive via lower price or via increasing prices on higher emitting/more powerful
models.
4. Plan 3 - EV Low - with this option carmakers increase investment in conventional powertrains
raising spend by 20% compared to what they spent up to 2018 (as for Plan 2) plus taking steps to
alter the sales profile of their best selling models towards lower emissions variants so that 1 in 5
customers buy a smaller or less powerful engine (as for Plan 2). In addition, carmakers withdraw
from sale the highest 5% emitting variants. These are typically low volume, high margin models
such as cars in BMW’s M series or Mercedes’ AMG. Through focusing on bringing down ICE emissions,
carmakers can minimise sales of EVs needed to achieve targets so this represents a low case for EV
sales. This case will be followed by companies unable to supply EVs in significant number and those
of greatest risk of incurring penalties.
The analysis provides an indication of future EV sales by company and overall. The model also takes into
account anticipated increases in SUV sales; further declines in diesel sales; some increase in hybrid sales;
and anticipated use of eco-innovations and super-credits (where these are earned) and anticipated pools.
In this way, the assessment presents a realistic picture of the likely EV market. The number of EVs is ZEVs
plus PHEVs. The proportion of each varies between companies depending upon planned production (and
this influences the number of EVs they need to sell). For example, Volvo has a very high share of EVs in part
because 90% of future EVs production is anticipated to be PHEVs with emissions just below 50 gCO 2/km, not
0 gCO2/km ZEVs.
6
More details about this assumption can be found in Annex 1.
29You can also read