Missouri Duck Season Date and Zone Boundary Review
←
→
Page content transcription
If your browser does not render page correctly, please read the page content below
Missouri Duck Season Date and Zone
                Boundary Review

      Weather, Migration, and Harvest Data for
                     Missouri
                                  January 2020
Report prepared by Andrew Raedeke, Nicholas Oakley, Doreen Mengel and Margie Mitchell,
Missouri Department of Conservation, Central Regional Office and Conservation Research
Center, Columbia, MO 65201.

Direct correspondence to Andrew.Raedeke@mdc.mo.gov.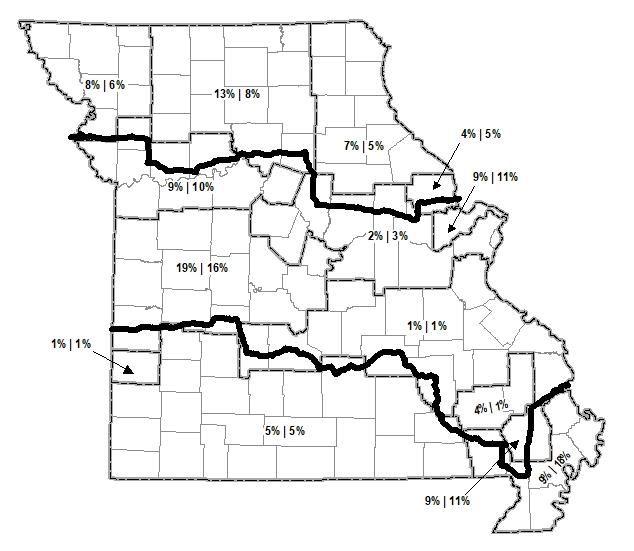
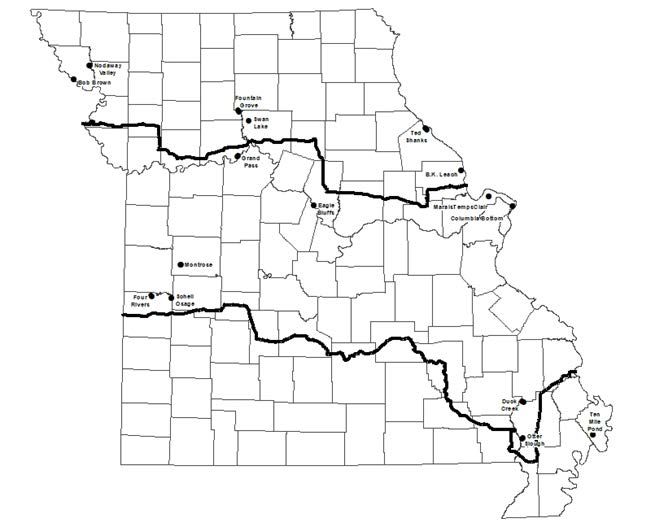
Table of Contents
Introduction ................................................................................................................................. 1
   Missouri Duck Season Structure Objectives and Guiding Principles ..................................... 2
   Duck Season Data for Missouri .............................................................................................. 3
   History of Duck Zones and Season Dates in Missouri ........................................................... 6
   Weather ................................................................................................................................. 16
   Harvest .................................................................................................................................. 17
Migration and Harvest Trends in the North, Middle, and South Zones ................................... 19
   North Zone ............................................................................................................................ 21
   Middle Zone .......................................................................................................................... 23
   South Zone ............................................................................................................................ 25
Weather, Migration, and Harvest Trends in 14 Regions of Missouri ....................................... 27
   Northwest .............................................................................................................................. 29
   North Central ........................................................................................................................ 32
   Northeast ............................................................................................................................... 35
   Missouri River West ............................................................................................................. 41
   Missouri River East............................................................................................................... 44
   St. Charles ............................................................................................................................. 47
   West Central.......................................................................................................................... 50
   East Central ........................................................................................................................... 53
   Barton Region ....................................................................................................................... 56
   South ..................................................................................................................................... 59
   Southeast ............................................................................................................................... 62
   Stoddard ................................................................................................................................ 65
   Bootheel ................................................................................................................................ 68
1

                                         Introduction

The Missouri Department of Conservation (Department) is seeking public input regarding duck
zone boundaries, the choice between continuous versus split seasons and season date formulas.
The opportunity to change duck season structure (continuous or split seasons and zone
boundaries) is available to states about every five years. The U.S. Fish and Wildlife Service
(FWS) will allow states to submit zone boundary and continuous versus split season
recommendations by July 1, 2020 for the 2021-2025 duck seasons. The zone options selected for
2021-2025 must remain in place even if the duck season is shortened to 45 or 30 days. Duck
season structure options for 2021-2025 include the following:

•   A statewide season with no zones or splits
•   Four zones and no splits
•   Three zones with potential for one split (two open segments) in each zone
•   Two zones with potential for two splits (three open segments) in each zone

The Department will also be reviewing the duck season date formulas that have been in place
since 2017 and will adjust as needed for the 2021-2025 duck seasons. Hunting conditions can
vary tremendously from one year to the next. During some years, the best hunting can occur
early in the season; during other years, it can occur late. Limiting changes to about every five
years helps the Department evaluate the effectiveness of zone boundaries and season dates over a
range of conditions.

Hunter input is an essential part of the equation for establishing duck season dates and zone
boundaries. The Department will use a web-based survey made available to Missouri migratory
bird hunters in December 2019 and January 2020 to capture a broad range of duck hunter
perspectives regarding Missouri’s duck season structure. In addition, the Department is hosting
a series of workshops during late January, February and early March 2020. The purpose of the
workshops is to share information used to develop hunting season recommendations and to
provide hunters a chance to offer their views about season dates, zone boundaries and continuous
vs split seasons for the 2021-2025 seasons.

This report provides weather, migration, and harvest data to assist hunters when developing their
recommendations for zone boundaries, a continuous versus a split season and season date
formulas for 60-day, 45-day and 30-day seasons. Data are compiled to depict information from
statewide, zone and regional perspectives.
2 Missouri Duck Season Structure Objectives and Guiding Principles Objective To establish zone boundaries and season dates that best accommodate hunter preferences, including those of hunters with varying levels of experience and those who hunt in different types of habitat (e.g., shallow water versus rivers and reservoirs), target different species (e.g., mallards versus early-season migrants), have varying physical capabilities (e.g. tolerance for cold and ice), and employ different hunting styles (e.g., water versus field hunting). Given the range of hunter preferences, it is likely that not all hunters will be completely satisfied regardless of which season dates or zone boundaries are selected. The challenge is to provide a balance that will accommodate at least a portion of most hunters’ desires. The choice of duck season structure and season dates has little impact on the overall status of duck populations. As a result, biological considerations are not as critical as providing duck seasons that contribute to overall quality hunting experiences. The FWS uses an Adaptive Harvest Management approach to determine if the season will be 60 days, 45 days, or 30 days in length and if the overall bag limit will be six ducks or three ducks. The combination of season length and bag limits is determined by the size of duck populations and habitat on the breeding grounds. States can select opening and closing dates between the Saturday nearest September 24 and January 31. Guiding Principles 1. Current duck season options must consider the possibilities for 30-day, 45-day, and 60-day seasons. We have experienced nearly unprecedented opportunity with 60-day seasons since 1997. There is no guarantee that this will continue and potential season lengths of 30 and 45 days are possibilities that must be considered as changes in season structure are contemplated. 2. Duck season dates and zone boundaries will be recommended to accommodate a range of hunting styles and preferences. All hunter preferences are legitimate. Dates that completely favor one group will likely disenfranchise another and may not accommodate the range of hunting styles throughout a region. 3. Duck season date and zone boundary selections will seek to balance providing opportunities for new hunters and satisfying more avid hunters. Over the past two decades, duck hunter numbers have declined across the country, but have remained relatively stable in Missouri. The Department will continue to consider the implications of season structure for recruiting new hunters as well as for retaining existing hunters. 4. Duck season dates for each zone must balance the hunter preferences from different regions within each zone. 5. Duck zone boundaries will be based upon the preferred season dates for hunters throughout a region. Boundaries will not be designed to accommodate a particular area or ownership, whether it is public or private. 6. The purpose of duck zones is to provide the “best” season dates for a particular region, not to extend the season for hunters who travel from zone to zone to extend their hunting season.
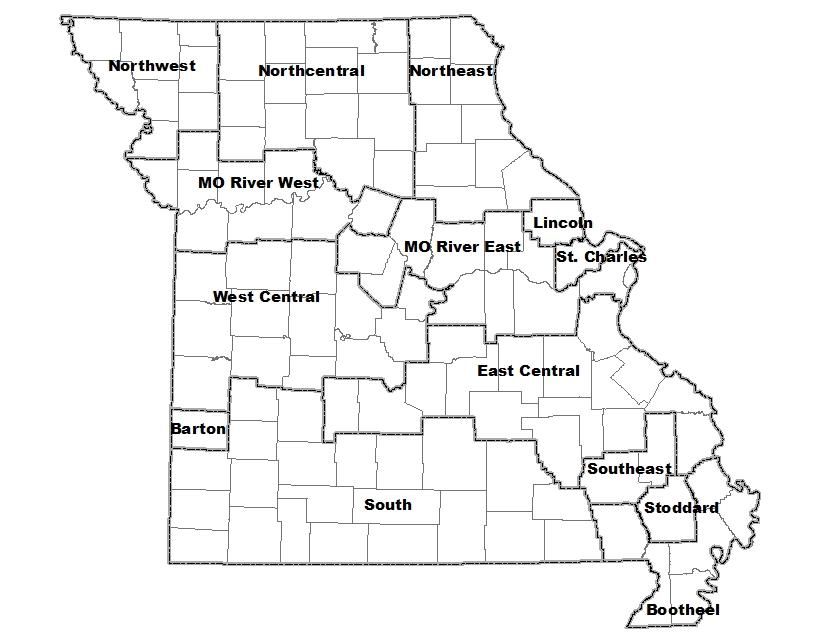
3

7. Recommendations for 2021-2025 will depend primarily upon hunters’ input. If most hunters
from a particular region prefer a different season structure (zones and splits) or season dates, a
change will likely be recommended. Otherwise, “change for the sake of change” will not be
recommended. Regardless, the time and effort taken by hunters to provide their input is valued
and it will help us develop the best possible recommendation for Missouri duck hunters.
Duck Season Data for Missouri

In the pages that follow, we first summarize weather, migration, and harvest data at the zone
level and then by 14 regions within Missouri (Figure 1). The zone-wide section provides a
broad overview. Data summarized by region are intended to serve as a reference as hunters
contemplate what season dates and zone boundaries they think would be best in the regions they
hunt most often. It also illustrates regional differences within zones that will need to be
accommodated when season dates are set and zone boundaries established. Long-term weather
data helps predict when regions of the state can expect weather that will likely result in the
arrival or departure of ducks. Waterfowl counts from state and federal refuges show when ducks
typically are most abundant in Missouri and harvest data reveals when hunters harvest the most
ducks.

Figure 1. Regions of Missouri 2021-2025 duck season structure review.
4

Weather Data

1) Dates when temperatures will likely fall below 24° Fahrenheit and 16° Fahrenheit.
For most duck hunters, a key question is when they can expect wetlands and lakes to
freeze-up. A temperature that causes “freeze-up” cannot be specifically defined. Size of
the water body, water depth, vegetation, wind protection, flowing water, and other factors
all have a bearing on whether or not a particular body of water freezes over at a certain
temperature. We selected daily low temperatures of 24°F and 16°F to represent the relative
risk of freeze-up to hunters in various habitats. A low temperature of 24°F likely coincides
with initial ice formation on shallow water areas and the likely arrival of mallards in
reasonable numbers. A low temperature of 16°F represents the risk of more severe ice
conditions. The Missouri Climate Center Information provided the data and it originated
from weather stations that correspond to the 14 regions used to summarize population,
migration and harvest data.

2) The percentage of years Department intensively managed wetland areas had ice two or
more inches thick during two periods: 2007-2016 and 2017-2018.
When ice is two or more inches thick on Department intensively managed wetlands, it
suggests that most wetlands are unavailable for hunting without the aid of ice eaters or
pumping water. When this occurs hunting is primarily limited to rivers, reservoirs, and
fields. Duck numbers often decline once these ice conditions become prevalent. These
data were provided by Department wetland managers who record ice conditions on their
respective conservation areas each day of the hunting season.

3) Average fall temperatures from 1895 through 2018.
One of the greatest unknowns is what weather patterns will be like in the future and how
they will influence duck migrations. Is the climate getting warmer? Will it be warmer in
the next five years than it was in the past five years? Average temperatures from
November through January across more than 100 years provide insights about cyclical
cooling and warming trends and what we may expect in terms of annual variation in
weather. At the state level, these data were provided by Dr. Patrick Guinan, the Missouri
state climatologist, from the Missouri Climate Center at the University of Missouri-
Columbia.
Migration Data

1) A comparison of migration timing during the most recent five years (2014-2018) to the
previous twenty years (1994-2013).
Corresponding to uncertainty about weather patterns, hunters and waterfowl biologist alike are
beginning to raise questions about the timing of migration. Are ducks arriving in Missouri later
than in the past? Are they staying longer? Fortunately, Missouri has one of the longest-running
datasets of weekly waterfowl numbers in the country that dates back to the early 1950s. In this
report, we provide comparisons at the regional level using data from the most recent five years
(2014-2018) and the previous 20 years (1994-2013) to illustrate how recent experiences compare
to the past. At the zone level, we provide information using data from the last 10 years (2009-
5

2018). By using this shortened time frame, we were able to include data from more areas. These
data are the result of at least biweekly surveys on state and federal wetland areas. The data are
reported as the percent of the fall/winter duck use that occurred by week. For some areas that
have been acquired or developed more recently (e.g., Nodaway Valley CA or Ten Mile Pond
CA), the population data may be less than the 20 years usually available. In other instances (e.g.,
southern Missouri), no managed state or federal wetland area exists in the region; in these
instances, no population data are presented.

2) A comparison of migration timing of mallards versus other species of dabbling ducks.
Hunter season date preferences depend, in part, on which species of ducks they tend to hunt.
Species such as pintails, green-winged teal, gadwall, wigeon, and shovelers tend to arrive earlier
than mallards. Based on data from the last 25 years (1994-2018), this report provides
comparisons of the timing of migration of mallards versus other species of dabbling ducks. The
data are reported as the percent of the fall/winter duck use that occurred by week for mallards
versus other species of dabbling ducks.

Harvest Data

1) Average daily harvest per week on public and private land for all duck species combined.
Each year the FWS asks a sample of hunters to record harvest from each of their hunting trips
and a smaller sample to submit a wing from each of the ducks they harvested. These data are
used to estimate the size and species composition of the harvest. Although the sample sizes for
particular regions can be small and result in imprecise estimates, we have combined data from
two periods: 2011-2016 and 2017-2018. These comparisons provide clues about the distribution
of harvest across regions in Missouri throughout the fall and whether this distribution has shifted
since changes in season date formulas and zone lines were implemented in 2017. Harvest
reported from opening weekends and the first day of the second segment in the case of split
seasons are excluded from analysis. Larger numbers of birds are typically harvested on opening
weekend regardless of the timing of the opener. We observed a similar pattern on the first day
after the split in Middle and South Zones. The split season essentially resulted in a “second
opener.” By excluding birds harvested on “openers”, the results should better reflect changes in
harvest based on the time of season. These estimates are more precise in areas with larger sample
sizes. Data are summarized so each month consists of 4 periods of approximately 8 days each.
To account for differences in the number of days in a week when a season is open, the daily
average per week is reported. For example, the 4th period in October may only have 1 or 2 days
if the season does not open until the last weekend in October. We then calculated the percent
each week contributed to the yearly total and then took the average percent across years. This
approach provides a general perspective of how much the average daily harvest each week
contributes to the overall harvest.
2) Average daily harvest per week on public lands of all ducks based on harvest estimates from
Missouri Department of Conservation (MDC) intensively managed wetlands areas within a
region.
 Missouri Department of Conservation wetland area managers record the number of hunters and
their harvest each day. We took a similar approach with harvest on MDC intensively managed
6

wetlands as we did with FWS harvest estimates. We combined data from two periods: 2011-
2016 and 2017-2018 and excluded harvest from opening weekends and the first day of the
second segment in the Middle and South Zones. Data are summarized so each month consists of
4 periods of approximately 8 days each. To account for differences in the number of days in a
week when a season is open, the daily average per week is reported. For example, the 4th period
in October may only have 1 or 2 days if the season does not open until the last weekend in
October. We then calculated the percent each week contributed to the yearly total and then took
the average percent across years. In some instances, the analysis may exclude Conservation
Areas when data were not available. In regions that do not have a Conservation Area, no area
harvest data are presented.
3) Average daily harvest per week on public lands, excluding opening weekends, of mallards and
other ducks based on harvest estimates from MDC’s intensively managed wetlands within a
region.
This analysis is based on the same database used to calculate average daily harvest from public
lands within a region of all duck species per week. It provides perspectives of the timing of
mallard harvest and other species of ducks. To illustrate differences in timing of mallards and
other species of ducks, we used data from 2011-2016.
4) Average daily mallard band recoveries, excluding opening weekends.
Mallard band recovery data provide another source of information about harvest distribution on
public and private land by location and date. More mallards are banded each year than other
species. Not enough birds are banded and recovered in Missouri for species other than mallards
to get an adequate representation of the timing of harvest. As a result, this report only includes
mallard band recoveries from mallards that were banded north of Missouri during the months of
July through September. The band recovery data are summarized in a similar fashion as the
harvest data. Recoveries from opening weekends are excluded and the data are presented as the
percent the daily average per week contributes to the yearly total.
History of Duck Zones and Season Dates in Missouri
Zone Boundaries

Zones were first employed in Missouri for the 1977-78 and 1978-79 seasons with the state
divided into a North and South Zone. Seasons in the North Zone were timed about three weeks
earlier than South Zone seasons (Figure 2, Pages 7-9. shows zone configurations and Table 1,
Pages 10-11 lists historical season dates).

In 1991, following more than a decade of annual proposals from states for split season and zone
boundary changes, the FWS developed criteria to limit the season structure options and to limit
the frequency of change to 5-year intervals. The limited split season/zone options included: 1) a
statewide season with no zones or splits, 2) a statewide split season with no more than three
segments and no zones, 3) two zones with an option of a split season with no more than two
segments in either or both zones, or 4) three zones with no splits. In 2012, the FWS offered
states two new options, four zones with no splits or three zones with split seasons. In 2019, the
FWS added the option of two zones that each could include two splits and three segments.
7

Figure 2. Missouri Duck Zones (before 1977 through 2020)
8
9
10
Table 1. Season dates and bag limits from 1960 through 2019.
Season   Days    Bag Limit          Statewide                North Zone                Middle Zone          South Zone
  1962      25            2   11/2-11/26
  1963      35            4   10/25-11/28
  1964      40            4   10/30-12/8
  1965      40            4   10/29-12/7
  1966      45            4   11/1-12/15
  1967      40            4   11/1-12/10
  1968      30            3   11/1-11/30
  1969      30            4   11/1-11/30
  1970      55            6   10/24-12/17
  1971      50            4   10/31-12/19
  1972      50            4   10/29-12/17
  1973      45            7   11/1-12/15
  1974      50            7   10/30-12/18
  1975      50            7   10/29-12/17
  1976      50           10   10/26-12/5 & 12/26-1/3
  1977      45           10                            10/25-12/8                                    11/15-12/29
  1978      50           10                            10/24-12/12                                   11/14-1/2
  1979      50           10                            10/24-12/12                                   11/14-1/2
  1980      50           10                            10/18-10/22 & 11/1-12/15                      11/1-12/15 &12/26-12/30
  1981      50           10                            10/17-10/21 & 10/31-12/14                     10/31-12/14 & 12/26-12/30
  1982      50           10                            10/16-10/20 & 10/30-12/13                     10/30-12/13 & 1/8-1/12
  1983      50           10                            10/15-10/19 & 11/1-12/15                      11/1-12/4 & 12/17-1/1
  1984      50           10                            10/20-24 & 11/1-12/15                         11/1-12/2 & 12/15-1/1
  1985      40            5                            10/19-10/21 & 11/2-12/8                       11/2-12/1 & 12/27-1/5
  1986      40            5                            11/1-12/10                                    11/22-12/14 & 12/27-1/12
  1987      40            5                            10/31-12/9                                    11/21-12/13 & 12/26-1/11
  1988      30            3                            11/5-12/4                                     11/19-12/4 & 12/26-1/8
  1989      30            3                            11/4-12/3                                     11/18-12/4 & 12/26-1/7
  1990      30            3                            11/3-12/2                                     11/17-12/4 & 12/26-1/6
  1991      30            3                            11/2-12/1                   11/9-12/8         11/30-12/29
  1992      30            3                            10/31-11/29                 11/7-12/6         11/28-12/27
  1993      30            3                            10/30-11/28                 11/6-12/5         11/27-12/26
  1994      40            3                            10/29-12/7                  11/5-12/14        11/25-1/3
  1995      50            5                            10/28-12/16                 11/4-12/23        11/22-1/10
  1996      50            5                            10/26-12/14                 11/2-12/21        11/23-1/11
  1997      60            6                            10/23-12/21                 10/30-12/28       11/13-1/11
Season   Days    Bag Limit       Statewide          North Zone        Middle Zone              South Zone
  1998      60               6               10/22-12/20         10/29-12/27            11/12-1/10
  1999      60               6               10/23-12/21         10/30-12/28            11/13-1/11
  2000      60               6               10/26-12/24         11/2-12/31             11/16-1/14
  2001      60               6               10/27-12/25         11/3-1/1               11/22-1/20
  2002      60               6               10/26-12/24         11/2-12/31             11/23-1/21
  2003      60               6               10/25-12/23         11/1-12/30             11/22-1/20
  2004      60               6               10/30-12/28         11/6-1/4               11/26-1/24
  2005      60               6               10/29-12/27         11/5-1/3               11/25-1/23
  2006      60               6               10/28-12/26         11/4-1/2               11/24-1/22
  2007      60               6               10/27-12/25         11/3-1/1               11/23-1/21
  2008      60               6               10/25-12/23         11/1-12/30             11/27-1/25
  2009      60               6               10/31-12/29         11/7-1/5               11/26-1/24
  2010      60               6               10/30-12/28         11/6-1/4               11/25-1/23
  2011      60               6               10/29-12/27         11/5-1/3               11/24-1/22
  2012      60               6               10/27-12/25         11/3-1/1               11/22-1/20
  2013      60               6               10/26-12/24         11/2-12/31             11/28-1/26
  2014      60               6               10/25-12/23         11/1-12/30             11/27-1/25
  2015      60               6               10/31-12/29         11/7-1/5               11/26-1/24
  2016      60               6               10/29-12/27         11/5-1/3               11/24-1/22
  2017      60               6               11/4-1/2            11/4-10 & 11/16-1/7    11/23-26 & 12/4-1/28
  2018      60               6               11/3-1/1            11/3-9 & 11/15-1/6     11/22-25 & 12/2-1/27
  2019      60               6               11/2-12/31          11/9-15 & 11/21-1/12   11/28-12/1 & 12/7-1/31

                                                                                                                 11
12 Missouri has included three zones 1991-2018, but MDC has made several adjustments to zone boundaries. The 2001-2005 review resulted in an adjustment to the North/Middle Zone boundary to include portions of Lincoln, Warren, and St. Charles counties in the Middle Zone and the Middle/South Zone boundary was modified to include Barton, northern Jasper and southern Vernon counties in the South Zone. The 2006-2010 season review resulted in the North/Middle zone boundary in western Missouri shifting north from Hwy 54 and Hwy 50 to I- 70 to accommodate the desire for later hunting opportunity in this region. The 2011-2015 season structure review resulted in the Middle/South boundary line in western Missouri being modified to return to a location similar to the 1991-2000 boundary with the exception that it left a greater portion of Barton County in the South Zone. Additionally, the Middle/South Zone boundary in southeast Missouri was moved from I-55 west to Hwy 25 to accommodate a desire for later season dates that more closely aligned with timing of duck movements and habitat use in this portion of the state. The 2016-2020 season structure review saw a return of the Middle/South Zone boundary to the location it occupied from 2011-2015 and an adjustment north to the western portion of the North/Middle Zone boundary which shifted much of the Missouri River floodplain in that part of the state into the Middle Zone, thus, accommodating a desire for later season dates expressed by Missouri River hunters. Each of the resulting zone boundaries represented a compromise between regions and among hunters within regions based on different habitats, different species hunted, and different hunting styles. Continuous versus Split Seasons Missouri had its first experience with a split season in 1976. At the time, there were no zones and the statewide season included a 41-day segment (Oct. 26-Dec. 5) followed three weeks later by a nine-day segment (Dec. 26-Jan. 3). The split was designed to provide late season opportunity that had not been available during most years. The following year, Missouri returned to a continuous season, but divided the state into two zones. The option to have a split season in two zones was first offered in 1980 and used in Missouri from 1980-1985. During 1980-82, a 5- day early segment in the North Zone and a 5-day late segment in the South Zone complemented a statewide segment of 45 days. An early segment of 3-5 days was retained in the North Zone during 1983-85 (40 to 50-day seasons), while the late segment in the South Zone was expanded to 10-18 days. The North Zone returned to a continuous season of 30-40 days during 1986-90, whereas the South Zone retained a split season that included an early segment of 16-23 days and a late segment of 12-17 days. In 1991, based upon hunter input and preferences, Missouri opted to take the new option of three-zones with no split seasons rather than maintaining two zones with a split. By the 2016-2020 open season, however, hunter consensus had coalesced around a desire for later season dates and strong interest in using the new option of three zones with a split to achieve this objective. The 2017-2020 seasons include a split in the Middle and South Zones although the North Zone retained a continuous season structure. The Middle Zone opens for a 7- day segment, closes for a 5-day split, and then reopens a second 53-day segment. The South Zone season is structured with an opening 4-day segment occurring over the Thanksgiving Day holiday weekend followed by a split of sufficient length to ensure the second segment runs to January 31 which is as late as the federal framework allows.
13

Season Dates

Season dates have gradually shifted later. In the early 1960s, when hunters experienced seasons
of 25 and 35 days, the statewide season opened either in late October or early November and
closed by the end of November. In 1975, the last year without zones, the statewide season closed
on December 17th, over a month earlier than when it now closes in the South Zone. Up until the
mid-1990s, the North Zone closed by mid-December, in part due to shorter seasons. The Middle
Zone closing date in the 1990s ranged from December 5 in 1993 to December 28 in 1999. In the
South zone closing dates ranged from December 26 in 1993 to January 11 in 1999. Beginning
in 2001, South Zone dates were shifted about a week later and North and Middle Zone dates
followed suit in 2004.

Prior to 2011, the Department adjusted waterfowl season dates each year. During the 2011 duck
season structure review, the Department sought input about establishing a season date formula
that would remain in place for a number of years. This option would not leave hunters guessing
from one year to the next what the season dates would be in the event of 60, 45, and 30-day
seasons. It also provided a much more realistic timeframe to evaluate hunter opinions of season
dates under a greater range of conditions than is possible after just one year. Hunters were
supportive of this change and the first duck season date formulas were implemented in 2011
(Table 2). These formulas maintain opening dates associated with a specific weekend of the
month, or holiday as was the case in the South Zone. As a result, season dates can vary by seven
days within a six-year period. This variation in dates accommodates those with earlier or later
season preferences over an extended period of time.

Table 2. Season date formulas for the North, Middle and South Zone, 2011-2016.
                 60-day Season             45-day Season                    30-day Season
 North Zone      Last Sat. in October      First Sat. in November           Second Sat. in November
 Middle Zone     First Sat. in November    Second Sat. in November          Third Sat. in November
 South Zone      Thanksgiving Day          First Sat. in December           Second Sat. in December

By the 2016-2020 open season, hunter consensus had coalesced around a desire for later season
dates and strong interest in using a split to achieve this objective. The season date formulas
implemented after the 2017-2020 season structure review reflect this desire for later season dates
expressed by waterfowl hunters in the statewide survey and workshops (Table 3). Specific
season date considerations and potential impacts of each recommended season date formula by
zone are described below.

North Zone Season Date Considerations
Specific to season date considerations for the 60-day North Zone Season, 69% of survey
respondents and 80% of workshop participants expressed a desire for later seasons. Although
both split season and continuous season options were considered, ultimately a continuous season
that opens a week later than the 2011-2016 seasons was the final recommendation. This choice
was made because North Zone workshop participants indicated that even though they wanted
later season dates, they also wanted to maintain as many November days as possible.
Additionally, workshop participants expressed no interest in a season structure that utilized a
split in mid-December that would retain as many November days as possible while also
providing an additional week of later hunting. Changing the opening date from the last Saturday
14 in October to the first Saturday in November, eliminated days in October but only a few days in November during most years. According to this formula opening day has the potential to open from Nov. 2 – Nov. 7 and will benefit hunters with earlier season preferences during some years and those with later season preferences in other years. Impacts of this season date formula during the first two years included the following: 1) It provided 7 days of additional late season hunting opportunity that benefitted those who hunt fields, rivers, reservoirs, private hunters who have the capability to keep water open, and those who simply wanted later seasons, 2) it resulted in missing significant migration events both years, and 3) it resulted in the loss of some shallow water hunting opportunity, especially in the northern counties of Missouri. Middle Zone Season Date Considerations Similar to the North Zone, Middle Zone hunters expressed a desire for later seasons than they have had prior to 2016. Fifty-five percent of survey respondents and 75% of workshop participants wanted later seasons in the Middle Zone. This translated into hunters wanting the opportunity to hunt later into January. The two methods to provide additional late season opportunity included delaying the opener or offering a split at any time during the season. Hunters indicated that they were much more in favor of sacrificing days early in the season rather than later in the season. An undesirable outcome of moving the season opener a week later is that it would fall on the deer season opener and force hunters, including 70% of Middle Zone hunters who also hunt deer, to choose between participating in either the duck season opener or deer season opener. In addition, many hunters indicated that they would like to try a split season. With these considerations, the recommended season date formula provided additional late season hunting opportunity, avoids conflicts with deer and duck season opening on the same weekend, and provides hunters with experience with a split season. The Middle Zone formula changed from the 1st Saturday in November to a split season that opens the first segment for 7 days beginning on the Saturday nearest November 6, closes for a 5- day split, and reopens the second segment for the remaining 53 days. This change resulted in a 5-day decrease in days during early season (the 4th Oct and 1st week of November) and a 5-day increase during late season (the 4th week of December and 1st week of January). In 2019 and 2020, this formula calls for the season to close on January 12 and 10, respectively. Previously, January 5th was the latest closing date in the Middle Zone. Impacts of this season date formula during the first two years include the following: 1) It provided 5 days of additional hunting opportunity in January, 2) it provided a “second opener” with higher harvest on the first day of the second segment, and 3) the season was closed either during or shortly after the most significant migration events each year. A season date formula that opens on the Saturday nearest November 6 results in seasons that are significantly later during some years than a formula that opens on the Saturday nearest November 1. In 2019, the season closes 12 days later than it would have using the previous formula of opening on the first Saturday in November. We do not have data yet to evaluate the impacts of this later closing date. South Zone Season Date Consideration Forty percent of South Zone survey respondents and 61% of South Zone workshop participants
15

wanted later seasons. Additionally, 53% of survey respondents and 76% of workshop
participants from the Bootheel, the region with the most duck hunting in the South Zone,
preferred later seasons. This option extends the season as late as possible while preserving
hunting opportunity over the Thanksgiving weekend, a popular time to hunt for many duck
hunters. The season dates more closely match the season dates in surrounding states. The change
likely provides the most benefit to hunters in the Bootheel and Southwest Missouri where more
mallards winter and less benefit to the 37% of South Zone hunters that actually expressed
interest in season dates that better match those offered in the North and Middle zones.
Unfortunately, there was no good way to reach a compromise that would benefit this group of
hunters along with those who wanted dates to remain the same or later than pre-2016 season
dates.

Table 3. Season date formulas for the North, Middle, and South Zone, 2017-2020.
                60-day Season              45-day Season                      30-day Season
 North Zone     First Sat. in November     Second Sat. in November            Sat. nearest November 14
 Middle Zone    Sat. nearest Nov 6 for 7   Sat. nearest Nov. 15               Sat. nearest Nov. 19
                days, close 5, open 53
                days
 South Zone     Thanksgiving Day for 4     Sat. nearest Dec. 10, close Dec.   Sat. nearest Dec. 15,
                days, close (if needed),   20-25, open as late as federal     close Dec. 19-25, open
                open as late as federal    frameworks allow.                  until Sunday nearest Jan.
                frameworks allow.                                             20
16
Weather
Temperatures vary annually in Missouri, and dramatic differences may occur from one year to
the next. The chart below shows that fall temperatures (November-January) were well above the
long-term average during the 1930s but were generally below the long-term average from the
mid-1970s to the early to mid-1990s. Fall temperatures during the 2000s were generally above
normal, but the decade ended with two years just below normal. This trend continued during the
2010s with above average fall temperatures in six years, near average or slightly below average
for three years and below average occurring only once during the decade (Figure 3). Although
climate models generally suggest the possibility of warmer temperatures over the next century in
Missouri, it is uncertain how annual fluctuations, long-term cyclical patterns, and climate change
will influence the weather patterns over the next five years.
Figure 3: Missouri Average November-January Temperature
1896-2018
44.0 Long-term average: 35.6°F
1932
2002
42.0 1914 2016
2000
40.0
Nov-Jan Average Temp (°F)
38.0
36.0
34.0
32.0
30.0 1912 1984 2001
28.0
1918 1977
26.0
NOAA/Missouri Climate Center17
Harvest
Figure 4 depicts how much each of the 14 regions contributed, on average, to the overall
statewide harvest based on FWS harvest estimates and mallard band recoveries from 2011-2016.
Although patterns based on FWS estimates and mallard band recoveries differ slightly, together
they provide some indications about the statewide distribution of harvest. Hunters in West
Central Missouri accounted for 19% of the statewide harvest. This region covers a large
geographic area and includes more habitat than most regions with the combination of public and
private hunting opportunity associated with Truman Reservoir and several public areas including
Schell-Osage CA, Four Rivers CA, and Montrose CA. St. Charles and Stoddard regions
represent a much smaller geographic area but each region still accounted for 9% of the average
statewide harvest estimate from 2011-2016.
Figure 4. Percent each of the 14 regions contributed to statewide harvest from 2011-2016 based
on U.S. Fish and Wildlife harvest estimates (first number) and mallard band recoveries
(second number).18
19
Migration and Harvest Trends in the North, Middle, and South
                          Zones

                     North Zone

                             Middle Zone

                         South Zone

                                                                19
20
North Zone                                                             Percent of duck use by week on state and federal refuges in the North Zone:
North Zone Migration Timing: Migration time varies                                                  10-year average.
annually. The top chart to the right presents the average           25%
migration pattern over the past 10 years in the North Zone based
                                                                    20%
on waterfowl counts at Loess Bluffs NWR, Nodaway Valley
CA, Fountain Grove CA, Swan Lake NWR, Ted Shanks CA,                15%
Clarence Cannon NWR, and BK. Leach CA. Migration events
or flight days in mid- to late-October through November result      10%
in increasing numbers of ducks until the end of November when
                                                                     5%
they typically peak. Numbers rapidly decline throughout
December as habitats begin to freeze up. Flight days in mid- to      0%
late-October of early season migrants contribute to their peak in         10/4      10/18       11/4      11/18      12/4      12/18              1/4
early to mid-November (lower chart). Mallard numbers peak in
late November with the first major migration often occurring
during the second week of November.
                                                                    Percent mallard and early migrant use by week on state and federal refuges in the
                                                                                             North Zone: 10-year average.
                                                                    25%
                                                                                                                                       Mallards

                                                                    20%                                                                Early dabblers

            North Zone                                              15%

                                                                    10%

                                                                     5%

                                                                     0%
                                                                          10/4       10/18      11/4       11/18      12/4      12/18               1/4

                                                                                                                                                          21
22
Percent average daily harvest per week on public and private ground in the
North Zone Harvest: FWS harvest data, excluding opening North Zone (FWS data).
weekends, suggests during 2011-2016 harvest gradually built 30%
2011-2016 (n=13,633)
toward a peak the third week in November and steadily declined
2017-2018 (n=2,756)
throughout the remainder of the season (top chart). During 2011-
2016, 20% of the harvest occurred during the last week of 20%
October and the first week of November compared to 15% of the
harvest during the last two weeks of December. Even with later
10%
seasons during 2017-2018, the early season contributed a higher
portion of the harvest than late season. The 2011-2016 harvest
pattern at MDC intensively managed wetland areas (Bob Brown 0%
CA, Nodaway Valley CA, Fountain Grove CA, Ted Shanks CA, 10_4 11_1 11_2 11_3 11_4 12_1 12_2 12_3 12_4 13_1 13_2 13_3 13_4
and B.K. Leach CA) is virtually identical to that suggested by the
FWS harvest data with peak harvest occurring the third week of Percent average daily harvest per week of all ducks at North Zone at MDC
November and declining thereafter (middle chart). In 2017-2018, intensively managed wetland areas.
harvest on public lands peaked in the second and third weeks of 30% 2011-2016 (n=230,189)
November then fluctuated thereafter reflecting the freeze-thaw
patterns that occurred during these two seasons. Mallard band 2017-2018 (n=51,757)
recoveries suggest a similar pattern (bottom left chart). 20%
Approximately 70% of duck species other than mallards are
harvested during the last week of October through the third week
of November (bottom right chart). The bulk of mallard harvest on 10%
public lands occurs during the second and third weeks in
November and the first week of December.
0%
10_4 11_1 11_2 11_3 11_4 12_1 12_2 12_3 12_4 13_1 13_2 13_3 13_4
Percent average daily harvest per week of mallards and other ducks at MDC
Percent average daily mallard band recoveries per week in the North Zone. intensively managed wetlands: 2011-2016.
30% 2011-2016 (n=541) 20% Mallard (n=144,260)
2017-2018 (n=148) Other (n=95,216)
15%
20%
10%
10%
5%
0% 0%
10_4 11_1 11_2 11_3 11_4 12_1 12_2 12_3 12_4 13_1 13_2 13_3 13_4 10_4 11_1 11_2 11_3 11_4 12_1 12_2 12_3 12_4 12_4 13_1 13_2 13_3 13_4Middle Zone Percent of duck use by week on state and federal refuges in the Middle Zone:
Middle Zone migration timing: Migration time varies 10-year average.
annually. The top chart to the right presents the average 25%
migration pattern over the past 10 years in the Middle Zone
20%
based on waterfowl counts at Columbia Bottom CA, Grand Pass
CA, Eagle Bluffs CA, Four Rivers CA, Mingo NWR, Duck 15%
Creek CA, and Otter Slough CA. Migration events or flight
days in mid- to late-October through November result in 10%
increasing numbers of ducks until the first week in December
5%
when they typically peak. Numbers gradually decline
throughout December as habitats begin to freeze up. Flight 0%
days of early season migrants typically occur in mid- to late- 10/4 10/18 11/4 11/18 12/4 12/18 1/4
October and early November and their numbers typically peak
by mid-November (lower chart). Mallard numbers typically
peak during the first week of December with the first major
migration often occurring during the second week of November. Percent mallard and early migrant use by week on state and federal refuges in the
Due to milder conditions than in the North Zone, mallards tend Middle Zone: 10-year average.
to remain throughout much of December. 25%
Mallards
20% Early dabblers
15%
10%
5%
0%
10/4 10/18 11/4 11/18 12/4 12/18 1/4
Middle Zone
2324
Percent average daily harvest per week on public and private ground in the Middle
Middle Zone Harvest: Zone (FWS data).
FWS harvest data, excluding opening weekends and the first day 30%
2011-2016 (n=14,591)
of the second segment, indicate that during 2011-2016 peak
average daily harvest occurred during the second week of 2017-2018 (n=3,112)
November, remained steady during early to mid-December, and 20%
then declined in late December and early January (top chart).
During 2011-2016, 25% of the total average daily harvest
occurred during the first two weeks of November compared to 10%
18% during the last two weeks of season. During 2011-2016, the
harvest pattern on MDC intensively managed wetlands in the
0%
Middle Zone (Grand Pass CA, Eagle Bluffs CA, Columbia 10_4 11_1 11_2 11_3 11_4 12_1 12_2 12_3 12_4 13_1 13_2 13_3 13_4
Bottom CA, Four Rivers CA, Duck Creek CA, and Otter Slough
CA) remained relatively constant throughout the season with Percent average daily harvest per week of all ducks on MDC intensively managed
wetlands in the Middle Zone.
slightly higher harvest earlier in the season than later in the season
30% 2011-2016 (n=206,677)
(middle chart). In 2017-2018, 29% of the average daily harvest
occurred during the first two weeks of November compared to 9% 2017-2018 (n=82,748)
during the last week in December and first week in January. The
20%
highest mallard harvest on MDC wetlands occurs during the
second and third weeks in November and the first week of
December. The daily average number of mallard band recoveries 10%
is slightly higher in late December and early January (bottom left
chart). Approximately 48% of duck species other than mallards
are harvested during the first three weeks of November (bottom 0%
10_4 11_1 11_2 11_3 11_4 12_1 12_2 12_3 12_4 13_1 13_2 13_3 13_4
right chart).
Percent average daily harvest per week (excluding opening weekend) of mallards and
Percent average daily mallard band recoveries per week in the Middle Zone. other ducks on MDC intensively managed wetlands in Middle Zone: 2011-2016.
30% 2011-2016 (n=713)
20% Mallard (n=107,453)
2017-2018 (n=267)
Other (n=112,192)
15%
20%
10%
10%
5%
0% 0%
10_4 11_1 11_2 11_3 11_4 12_1 12_2 12_3 12_4 13_1 13_2 13_3 13_4 10_4 11_1 11_2 11_3 11_4 12_1 12_2 12_3 12_4 13_1 13_1 13_2 13_3 13_4South Zone Percent of duck use by week in the South Zone (Ten Mile Pond CA):
South Zone Migration Timing: Ten Mile Pond CA is the only 10-year average.
public wetland area represented in the South Zone, so migration 25%
timing is based on data from this area. We do not have data from
20%
the western portion of the South Zone where shallow water
wetlands, irrigation lakes, and reservoirs are found. The 10-year 15%
data illustrates a relatively steady build-up of duck use through
early December before use plateaus and remains relatively 10%
constant for the remainder of the period of record. Data is
5%
truncated due to lack of long-term information extending
through January (top chart). When freeze ups occur ducks often 0%
move only a short distance and may return within a few days. 10/4 10/18 11/4 11/18 12/4 12/18 1/4
Early dabbler use builds through November, peaks in early
December and then gradually declines. Mallard use continues to
build through December and likely peaks in early to mid-January
(middle chart). Again, although not reflected in the Ten Mile Percent mallard and early migrant use by week in the South Zone
Pond data, flights of divers likely occur on large reservoirs (Ten Mile Pond CA): 10-year average.
present in this Zone in association with flight days. 25%
Mallards
20% Early dabblers
15%
10%
5%
0%
10/4 10/18 11/4 11/18 12/4 12/18 1/4
South Zone
2526
Percent average daily harvest per week on public and private ground in the
South Zone Harvest: Based on FWS harvest estimates, during 2011- South Zone (FWS data).
2016, excluding opening weekends and the first day of the second 40% 2011-2016 (n=4,500)
segment, average daily harvest peaked the fourth week of November, 2017-2018 (n=727)
declined from 16% of season total to 8% the first week in December 30%
and remained somewhat constant with average daily harvest per
week ranging from 9 to 13% during each of the remaining weeks of 20%
the season (top chart). In 2017-2018, harvest peaked the first week of
the season (fourth week in November) and then steadily declined 10%
until a second peak that occurred the last week of the season (fourth
week of January). Harvest at Ten Mile Pond CA shows a similar 0%
pattern in both time periods with relatively steady harvest throughout 10_4 11_1 11_2 11_3 11_4 12_1 12_2 12_3 12_4 13_1 13_2 13_3 13_4
the 2011-2016 season whereas, in 2017-2018, peaks in harvest
occurred in late November/early December and in late January.
Percent average daily harvest per week of all ducks on MDC intensively
Compared to other regions, there is little difference in the timing of managed wetlands in the South Zone (Ten Mile Pond CA).
mallard harvest compared to other species (bottom right chart).
30% 2012-2016 (n=19,888)
Mallard band recoveries in both time periods (2011-2016 and 2017-
2018) suggests a peak of harvest occurs in late-January (bottom left 2017-2018 (n=4,187)
chart). 20%
10%
0%
10_4 11_1 11_2 11_3 11_4 12_1 12_2 12_3 12_4 13_1 13_2 13_3 13_4
Percent average daily harvest per week of mallards and other ducks on MDC
Percent average daily mallard band recoveries per week in the South Zone. intensively managed wetlands in the South Zone (Ten Mile Pond CA): 2011-2016.
30% Mallard (n=13,800)
2011-2016 (n=363) 20%
2017-2018 (n=98) Other (n=7,302)
15%
20%
10%
10%
5%
0% 0%
10_4 11_1 11_2 11_3 11_4 12_1 12_2 12_3 12_4 13_1 13_2 13_3 13_4 10_4 11_1 11_2 11_3 11_4 12_1 12_2 12_3 12_4 13_1 13_2 13_3 13_4Weather, Migration, and Harvest Trends in 14 Regions of
Missouri
pg 29
pg 32
pg 35
pg 38
pg 41 pg 47
pg 44
pg 50
pg 53
pg 56 pg 62
pg 65
pg 59
pg 68
2728
Probability (%) that a temperature of 24° F and 16° F will be reached by date at St
Northwest                                                                                         Joseph, MO.
Northwest Weather: Precipitation in this region gradually      100%
declines from late summer through fall. Average low
                                                               80%
temperatures fall below freezing by mid-November. There
is a 50% probability of achieving a low temperature of 24° F   60%
and having the first skim ice by November 4 (top chart). By
                                                               40%
December 13, there is a 90% chance temperatures will dip
                                                                                                                               24° F
down to 16° F and form more significant ice. During 2007-      20%
2016, Bob Brown lost an average of 12.5 days each year to                                                                      16° F
                                                                0%
icy conditions (middle chart) whereas during the 2017 and              4    18               4     18        4       18           4            18
2018 seasons, they lost an average of 16.5 days to ice                Oct   Oct             Nov   Nov       Dec      Dec         Jan          Jan
(bottom chart).
                                                                    Percent of years Bob Brown CA had ice > 2 inches throughout the season
                                                                  during the period 2007-2016. The dashed rectangle highlights portion of season
                                                                                               closed prior to 2017.
                                                               100%

                                                               80%                                                                     Formerly
                                                                                                                                        closed
                                                               60%                                                                      portion
                                                                                                                                          of
                                                               40%                                                                      season

                                                               20%

                                                                0%

                                                               Percent of years Bob Brown CA had ice > 2 inches during 2017 and 2018 seasons. The
                                                                        dashed rectangle highlights a portion of season open prior to 2017.

                                                                  100%
                                                                                    Formerly
                                                                      80%         open portion
                                                                                   of season
                                                                      60%

                                                                      40%

                                                                      20%

                                                                       0%

                                                                                                                                                      29
30
Northwest Migration Timing: The long-term pattern of duck use Percent of duck use by week (Loess Bluffs NWR):
at Loess Bluffs NWR exhibits a gradual buildup through mid- 20- year average and 5-year average.
November and a steady decline during late November and 25%
20 years (1994-2013)
December (top chart). The 5-year average suggests a slower
20% 5 years (2014-2018)
buildup with fewer birds present in mid-November as use peaks
in late November, sharply drops off through early December and 15%
then somewhat steadily declines thereafter with more birds
present in late December than suggested by the 20-year average. 10%
Early migrant use typically peaks during late October to mid-
5%
November and then declines throughout the remainder of
November with few of these birds present after early December 0%
(bottom chart). Mallard numbers are somewhat steady from early 10/4 10/18 11/4 11/18 12/4 12/18 1/4
November through late November before beginning a relatively
sharp decline through December as ice conditions develop.
Percent of mallard and early migrant use by week (Loess Bluffs NWR):
25-year average.
25%
Mallards
20% Early dabblers
15%
10%
5%
0%
10/4 10/18 11/4 11/18 12/4 12/18 1/4Percent average daily duck harvest per week on public and private ground in
the Northwest Region (FWS data).
Northwest Harvest: During 2011-2016, excluding opening 30% 2011-2016 (n=2,735)
weekends, FWS harvest data suggests harvest in the Northwest 2017-2018 (n=535)
Region steadily increased from the last week in October through
mid-November, remained somewhat steady through the first week 20%
in December and then declined sharply thereafter with the onset of
ice. In 2011-2016, 20% of the total average daily harvest occurred
10%
during the last week of October and first week in November
compared to 9% during the last two weeks in December. In 2017-
2018, MDC moved the season a week later. During these two 0%
years, excluding opening weekends, 75% of daily average harvest 10_4 11_1 11_2 11_3 11_4 12_1 12_2 12_3 12_4 13_1 13_2 13_3 13_4
occurred in November, compared to 25% in December and early
January (top chart). A similar harvest pattern occurred at Bob Percent average daily duck harvest per week at Bob Brown CA and Nodaway
Brown CA and Nodaway Valley CA in 2012-2016 and 2017-2-18 Valley CA.
with a notable decline in harvest after the first week in December
30%
(middle chart). Twenty-two percent of duck species other than
mallards are harvested during the first week of November (bottom 2012-2016 (n=52,950)
right chart). Mallard harvest peaks, on average, during the first 20% 2017-2018 (n=18,186)
week of December. The most mallard band recoveries were also
reported during the first week of December (bottom left chart).
10%
0%
10_4 11_1 11_2 11_3 11_4 12_1 12_2 12_3 12_4 13_1 13_2 13_3 13_4
Percent average daily mallard band recoveries per week in the Northwest Percent average daily harvest per week of mallards and other ducks at Bob
Region: 2011-2016 (n=93). Brown CA and Nodaway Valley CA: 2012-2016.
30%
30% Mallard (n=31,797)
Other (n=23,414)
20%
20%
10% 10%
0% 0%
10_4 11_1 11_2 11_3 11_4 12_1 12_2 12_3 12_4 13_1 13_2 13_3 13_4 10_4 11_1 11_2 11_3 11_4 12_1 12_2 12_3 12_4 13_1 13_2 13_3 13_4
3132
North Central Probability (%) that a temperature of 24° F and 16° F will be reached
North Central Weather: Precipitation patterns in this region, by date at Brookfield, MO.
although somewhat wetter, are similar to Northwest Missouri. 100%
Precipitation amounts gradually decline after September.
80%
Freezing conditions initially occur during mid-November and
there is a 50% probability for a low temperature of 24° F that will 60%
likely create skim ice by November 6 (top chart). By December 40%
16 there is a 90% chance of a low temperature of 16° F that will
likely create more substantial ice. During the 2007-2016 period, 20% 24° F
Fountain Grove CA has had ice two or more inches thick in 60% 0%
16° F
of the years by December 16 (middle chart). During this period, 4 18 4 18 4 18 4 18
they lost an average of 12.6 days each year to icy conditions Oct Oct Nov Nov Dec Dec Jan Jan
whereas during the 2017 and 2018 seasons, they lost an average Percent of years Fountain Grove CA had ice > 2 inches throughout the season
of 8.5 days (bottom chart). during the period 2007-2016. The dashed rectangle highlights portion of season
closed prior to 2017.
100%
80%
Formerly
60% closed
portion of
40% season
20%
0%
Percent of years Fountain Grove CA had ice > 2 inches during 2017 and 2018
seasons. The dashed rectangle highlights a portion of season open prior to 2017.
100%
Formerly
80% open portion
of season
60%
40%
20%
0%North Central Migration Timing: Duck use in this region Percent of duck use by week (Fountain Grove CA and Swan Lake NWR):
typically peaks by the third or fourth week in November (top 20- year average and 5-year average.
chart). During the past five years, duck numbers have 25%
20 years (1994-2013)
gradually increased through late October and peaked the
20% 5 years (2014-2018)
fourth week of November. The decline in duck numbers after
the peak appears to be more gradual in the recent five years 15%
compared to the previous 20 years. Mid-November weather
fronts that often bring early mallard flights also result in 10%
declining numbers of early season migrants (bottom chart).
5%
0%
10/4 10/18 11/4 11/18 12/4 12/18 1/4
Percent of mallard and early migrant use by week (Fountain Grove and Swan
Lake NWR): 25-year average.
25%
Mallards
20% Early dabblers
15%
10%
5%
0%
10/4 10/18 11/4 11/18 12/4 12/18 1/4
3334
North Central Harvest: The FWS harvest estimate, excluding Percent average daily duck harvest per week on public and private ground in the
opening weekend, suggests that a substantial portion of harvest North Central Region (FWS data).
occurs through the first week of November in both time periods 30% 2011-2016 (n=4,364)
with 20% (6% the last week of October and 14% the first week of 2017-2018 (n=1,442)
November) occurring in 2011-2016 and 26% occurring the first
week of November in 2017-2018, excluding opening weekends. 20%
The remainder of the season exhibits a similar pattern in both
periods with harvest relatively steady during the second through
10%
fourth weeks of November ranging from 11-19% of total each
week before steadily declining through December. No harvest
was reported in the first week of January in 2017-2018 (top 0%
chart). At Fountain Grove CA, harvest in 2011-2016 peaked at 10_4 11_1 11_2 11_3 11_4 12_1 12_2 12_3 12_4 13_1 13_2 13_3 13_4
just over 16% of the total daily average daily harvest during each
of the third and fourth weeks of November whereas 2017-2018 Percent average daily duck harvest per week at Fountain Grove CA.
saw harvest peak during the first and second weeks of November
30% 2011-2016 (n=34,410)
at 19% and 21% of total, respectively (middle chart). Eighty-three
percent of harvest of species other than mallards occurs during the 2017-2018 (n=14,890)
fourth week of October and the four weeks of November (middle 20%
chart). The bulk of mallard harvest occurs in mid- to late
November and early December with the third week of November,
the fourth week of November and the first week of December 10%
each experiencing about 18% of total harvest (bottom right chart).
Mallard band recovery estimates suggest harvest remains
0%
relatively steady from mid-November through mid- to late 10_4 11_1 11_2 11_3 11_4 12_1 12_2 12_3 12_4 13_1 13_2 13_3 13_4
December (bottom left chart).
Percent average daily mallard band recoveries per week in the North Central Percent average daily harvest per week of mallards and other ducks at Fountain
Region: 2011-2016 (n=133). Grove CA: 2011-2016.
30% 30% Mallard (n=20,707)
Other (n=15,358)
20% 20%
10% 10%
0% 0%
10_4 11_1 11_2 11_3 11_4 12_1 12_2 12_3 12_4 13_1 13_2 13_3 13_4 10_4 11_1 11_2 11_3 11_4 12_1 12_2 12_3 12_4 13_1 13_2 13_3 13_4You can also read


