Mitigation Policy Packages For Transport Sector - Mumbai Metropolitan Region - Munish K. Chandel Rajashree Padmanabhi Anil K. Dixit
←
→
Page content transcription
If your browser does not render page correctly, please read the page content below
Mitigation Policy Packages For
                Transport Sector
         - Mumbai Metropolitan Region

                 Munish K. Chandel
                Rajashree Padmanabhi
                    Anil K. Dixit

,

                      May 2017

1|Page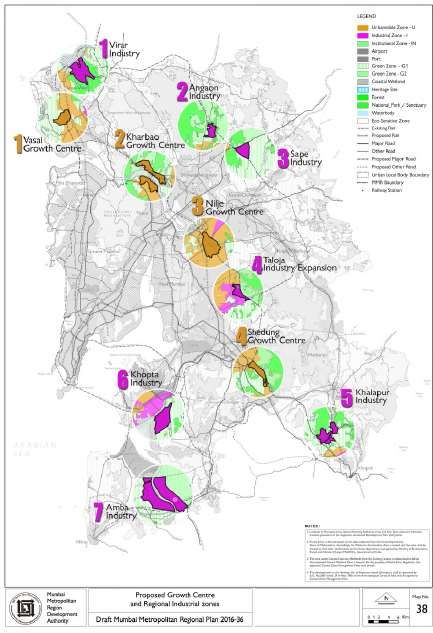
Contents

   List of Figures ...................................................................................................................................... 3
   List of Abbreviations .......................................................................................................................... 4
   1.      Introduction: ............................................................................................................................... 5
        1.1 About Mumbai: ......................................................................................................................... 5
        1.2 Transport System: ..................................................................................................................... 5
        1.3 Climate System.......................................................................................................................... 6
   2.      Policy Approaches for Climate Change Mitigation in Transport sector for MMR ...................... 8
        2.1 `Avoid’ Policy Measures ............................................................................................................ 9
        2.2 `Shift’ Policy Measures: ........................................................................................................... 10
        2.3 `Improve’ Policy Measures:..................................................................................................... 12
   3.      Proposed Policy Packages for Transport Sector Mitigation in MMR ........................................ 15
        3.1 Integrated Land Use and Transport Policy .............................................................................. 15
        3.2 Transport Infrastructure Development .................................................................................. 18
        3.3 Travel Demand Management ................................................................................................ 19
        3.4 Technology Improvement ...................................................................................................... 20
References ............................................................................................................................................ 22

2|Page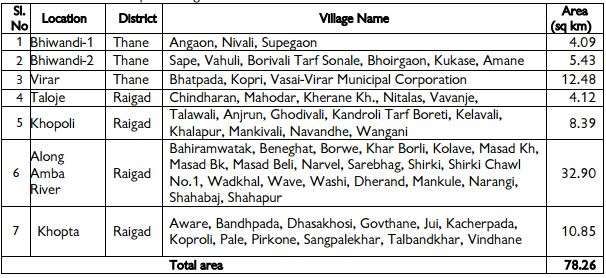
List of Figures

Figure 1 Modal Share - MMR (LEAassociates, 2008) .............................................................................. 6
Figure 2 Estimates of the return period of daily maximum rainfall at Santa Cruz historically and in the
2080s (under a high-end scenario). (Nicola Ranger, 2010) .................................................................... 7
Figure 3 Min and Max temperature anomalies at Santacruz station, (Environmental Status Report) .. 7
Figure 4 Population Employment Matrix: Shortlisted scenarios, CTS (LEAassociates, 2008) ................. 9
Figure 5 Population Distribution Matrix, CTS (LEAassociates, 2008) .................................................... 10
Figure 6 CO2 contribution by vehicle type, Auto Fuel Vision Policy 2012 ............................................. 14
Figure 7 Details of Proposed Growth Centres, (MMRDA, 2016) .......................................................... 15
Figure 8 Details of proposed Regional Industrial Corridors, (MMRDA, 2016) ...................................... 16
Figure 9 Proposed Growth Centres and Regional Industrial Corridors in MMR, (MMRDA, 2016) ....... 16
Figure 10 Methodology for incorporating Policy Package 1 in TDM .................................................... 17
Figure 11 Revised Metro Corridors, MUIP ............................................................................................ 18
Figure 12 Methodology for incorporating Policy Package 2 in TDM .................................................... 19
Figure 13 Methodology for incorporating Policy Package 3 in TDM .................................................... 20
Figure 14 Methodology to incorporate policy package 4 in TDM ........................................................ 21

3|Page
List of Abbreviations

BEST     -Brihanmumbai Electric Supply and Transport

BMC      -Brihanmumbai Municipal Corporation

CTS      -Comprehensive Transportation Study

EEH      -Eastern Express Highway

Emp      -Employment

GoI      -Government of India

JVLR     -Jogeshwari Vikhroli Link Road

LU&LUC   -Land Use and Land Use Change

MCGM     -Municipal Corporation of Greater Mumbai

MMR      -Mumbai Metropolitan Region

MMRDA    -Mumbai Metropolitan Regional Development Authority

MoUD     -Ministry of Urban Development

MUIP     -Mumbai Urban Infrastructure Project

MUTP     -Mumbai Urban Transport Project

Pop      -Population

RoR      -Rest of the Region

TDM      -Travel Demand Model

TERI     -The Energy Research Institute

WEH      -Western Express Highway

4|Page
1. Introduction:
Mumbai is ranked as one of the top 10 most vulnerable coastal cities in the world (R. J. Nicholls, 2008)
In this study, we formulate policy packages for undertaking climate change mitigation strategies in the
transport sector of Mumbai Metropolitan Region. The report is structured in three sections.

Section 1 provides the introduction to Mumbai’s demography, transport and climate systems.

Section 2 presents the literature review of the policy approaches for mitigation in the transport sector.
It elaborates on the existing and proposed policies that can aid the process of mitigation in MMR.

Section 3 emphasises on the selected mitigation policy packages feasible in the context of MMR, their
incorporation in the Travel Demand Model and evaluation of impacts.

1.1 About Mumbai:
Since its conception, Mumbai (formerly known as Bombay) has been one of the major trading centres in
Indian peninsula due to its strategic territorial advantages. By the middle of 18th century, it received huge
reflux of migrant population from across India and continues to remain one of the most populous cities of
the world. In 1872, Mumbai was reshaped by the reclamation of seven islands to form a single large
landmass which has expanded rapidly in neighbouring geographies. Starting with 1 Municipal Corporation
(Greater Mumbai), 13 Municipal Councils, 24 Census Towns and 1166 villages in 1981, the numbers grew
and MMR, as we know today, has a total of 8 municipal corporations, 9 municipal councils, 35 census towns
and 994 villages in MMR. It has a geographical spread of 4355 sq. km and a population of about more than
23.13 million with almost 92% of the population in MMR is urban population. (Census 2011). The sex ratio
of female to male in Mumbai Urban Agglomeration was found lower with the figure of 863 females against
national urban average of 926 females per 1000 males.

Economic growth is one of the key driving forces for the growth of a city. Being the finance capital of India,
Mumbai aspires to be the global finance sector. The GDDP of MMR has been steadily increasing with a
CAGR of 14.92% as per Economic Survey of Maharashtra 2011. However, 41.3% of Mumbai households i.e
54% of the population lives in slums occupying only 6% of total land (Census 2011).

1.2 Transport System:
MMR is historically heavily dependent on public transport and walking as a mode of transport. Over
40% of workers in MMR reach their workplace on foot resulting in almost 52% of the total trips per
day using walking as a primary mode of transport.

Suburban local trains form the lifeline of Mumbai's North-South transport. The average trip length of
train commuters is very high, almost 24km by owing to the unaffordability and restricted supply of
housing in and around Central Business District of MCGM. Mumbai suburban railway network covers
over about 400 km route network (280 km of Central Railway and 120 km of Western Railway) with 7
million average weekday passenger trips catering at extremely low fares.

In MMR, buses carry 26% mode share of public transport (except walk trips) which attributes to 3.55
million trips if feeder service is not considered. Brihanmumbai Electric Supply and Transport (BEST)
along with other municipal public transport undertakings hold a fleet strength of 7544 buses on 5700
routes. In 2005, contract carriers increased from 7396 to 10633 and school buses increased from 912
to 1248. The growth of stage carriers, private contract carriers and school buses in MMR indicates that
the public buses are losing their share of public transport. (LEAassociates, 2008)

5|Page
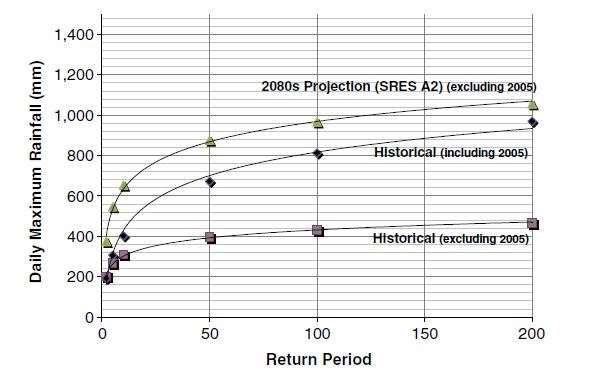
Figure 1 Modal Share - MMR (LEAassociates, 2008)

Intermediate Public Transport like autos and taxis play an important role in accommodating travel
demands and providing access to trains and buses. Within Greater Mumbai, island city has the highest
percentage of cars while eastern suburbs have the lowest. It is observed that during 1996-2005, the
proportion of cars is decreasing in the Greater Mumbai whereas it is increasing in rest of the MMR
(RoR) (LEAassociates, 2008).

On the front of external travel, about 16% of the total freight movement is through-traffic. Mumbai
Port and Jawahar Nehru Port are two of the 12 major ports in India. Though Maharashtra is the main
hinterland for these ports, Mumbai itself accounts for almost 28% of total traffic originating from the
ports. As the railways are already overcrowded by passenger traffic, most of the port evacuation
happens by road.

1.3 Climate System.
Situated at the foothills of Sahyadris and on the coast of Arabian Sea West and Thane creek (East),
both these factors substantially affect the climate of Mumbai. The average annual rainfall is usually
around 2000mm whereas the average minimum and maximum temperatures are around 22°C- 23°C
and 30°C and 31°C respectively. Much of Mumbai’s area is close to sea level.

It is well documented how the impacts of climate change will result in sea level rise across the globe.
It will severely affect the low elevation coastal cities as they inhabit almost 13% of world’s population.
Mumbai has already witnessed erratic climate variations. On 26th July 2005, Mumbai (Santa Cruz
Meteorological Centre) recorded 944 mm rainfall in 24 hrs, a 1 in 100 years event, resulting in massive
flooding and heavy storms in the MMR. Roads and railway lines at many places were under water for
more than 24 hours. The rail and road traffic came to a halt. The airport was also closed on account of
water logging and climatic reasons.

To understand the vulnerability of Mumbai to climate variability, (Nicola Ranger, 2010) attempted to
quantify the flood hazards in Mumbai in terms of future precipitation projections for the 2080s taken
from the PRECIS model; a high-resolution regional climate model based on HadCM3. The Fig 2
demonstrates that by the 2080s, the intensity of extreme rainfall could be increased at all return
periods. For the shorter return period (more frequent) events, the increase is particularly strong. For
example, the intensity of a 2–5 year return period event is almost close to double for the scenario
under consideration i.e. SRES A2 scenario.

6|Page
Figure 2 Estimates of the return period of daily maximum rainfall at Santa Cruz historically and in the 2080s (under a high-
end scenario). (Nicola Ranger, 2010)
The analysis indicates that the return period of 944mm rainfall in a day i.e. of July 2005 scale is reduced
to around 1-in-90 years in 2080 under this scenario. Though this analysis does exhibit several
limitations and is based on only one climate model, these results indicate Mumbai’s high sensitivity to
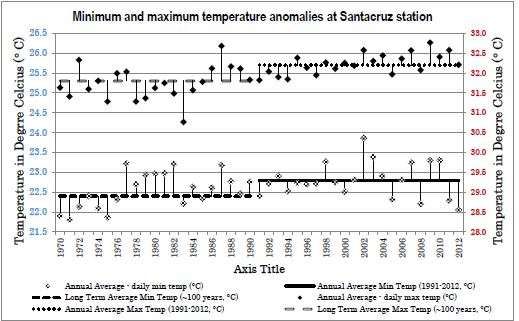
flood risks in future. It is difficult to attribute the increase in temperature in a region to specifically
climate change, as there can be various factors causing a temperature increase in a complex urban
environment like Urban Heat Island and LU&LUC. However, the graph made by analysis in
Environmental Status Report (TERI, 2015) clearly indicates the shifting averages of the minimum as
well as maximum temperatures in Mumbai region. Post-1990s, MMR is experiencing new higher
averages for both minimum as well as maximum temperature.
Figure 3 Min and Max temperature anomalies at Santacruz station, (Environmental Status Report)
7|Page2. Policy Approaches for Climate Change Mitigation in Transport sector for MMR
Climate change mitigation refers to efforts to reduce or prevent the emission of greenhouse gases. Air
Quality Assessment, Emissions Inventory and Source Apportionment Studies report for Mumbai
sponsored by Central Pollution Control Board and prepared by National Environmental Engineering
Research Institute in 2010 (NEERI, 2010) attribute vehicular emissions as one of the primary reasons
for CO2 emissions in the city.
Apart from accommodating increasing travel demand due to increasing population and economic
growth, the transport sector also has various other challenges of reducing traffic congestion,
accessibility, affordability and decreasing vehicular emissions Various policy approaches are available
to make a conscious transition towards a cleaner, sustainable transportation within the city. No one
approach is feasible and sufficient to achieve the goal. Therefore, a combination of policy measures,
benefitting all sections of the society at different levels, needs to be designed for a short term and
long term basis.
The policy approaches can have three main components:
Avoid: Avoid refers to improving the efficiency of the system by avoiding the necessity to travel long
distances for any purpose. It entails definitive and purposeful changes in the land use policy to
integrate social, economic and cultural opportunities of the people along with efficient use of land
resources.
Shift: The main objective of this policy approach is to encourage a mode shift from personal vehicles
to more space-efficient modes of transport such as non-motorised modes like walking, cycling and
public transport. That is, in other words, the most energy consuming modes (private vehicles) to more
environmentally modes (higher occupancy, low energy consumption per km)
Improve: The last policy strategy is to promote Research and Development of vehicle technology
aimed at enhancing fuel efficiency, reducing emissions and operating efficiency.
AVOID SHIFT IMPROVE
● Integrated Land Use ●Road User Charge policy ● Investments in Public
and Transport policy -Congestion Pricing Walking and Cycling
-Premium on car ownership Infrastructure
-Proof of availability of car parking at
residence and at workplace ● Alternative Fuel Use
-Encourage car pooling -More availability of CNG kits
-Car restricted zones/ car –free days for auto rickshaw, cars
-Promote walking and cycling -Promoting use of more electric
and hybrid vehicles under
●Parking Policy National Electric Mobility
-Park and Ride: Provision of parking Mission Plan, 2013
spaces for PVs and IPT at railway -Increase in conventional fuel
stations costs
-Differential parking charges
● Fuel Standards
● Public Transport - Improvement in Fuel
-Bus Transport: Standards
Dedicated bus corridors on JVLR, - Stricter implementation of
WEH, EEH; BRTS PUC certificates
-Public Bicycle sharing by MoUD
●Passenger Water Transport-
8|Page-Government of Maharashtra ● Public Buses and local trains-
providing East Coast PWT connecting online tracking and ticketing
Gateway of India to Mandwa, JNPT, system
Nerul, Belapur, Vashi through
Mumbai Port Trust
2.1 `Avoid’ Policy Measures
Integrated Land Use Policy-
With distinctively different development options and growth scenarios available for the Greater
Mumbai and Rest of the Region (RoR), various future scenarios can be built for the road and rail
transport systems in MMR based on costs, time of travel and emission reduction needs.
There are two extreme possibilities based on extreme intensification of Greater Mumbai or complete
shift of future growth away from Greater Mumbai, as also mentioned in the comprehensive transport
study (CTS) for MMR,
1. Greater Mumbai would continue its primacy over RoR and attract all new investments and
creation of jobs.
2. On the other extreme, with proposed SEZs and other low-polluting industries and creation of
transportation infrastructures like a second international airport, third port, expressways and
other transit links, there will be more greenfield development in RoR, employment generation
and associated population growth.
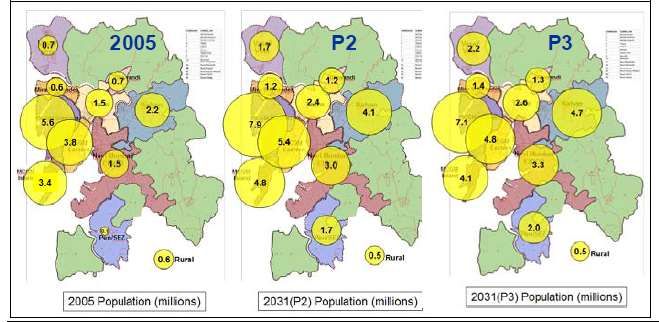
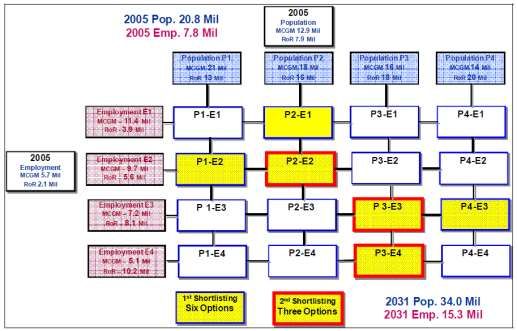
There could be many possible scenarios between these two due to uncertainties of transport strategic
investments and land use constraint. Therefore, CTS proposes that from 2005 to 2031, the population
of MMR will increase from 20.8 million to 34 million and the population and employment distribution
can take places as per various scenarios illustrated in Fig 4 shows 3 most possible scenarios shortlisted
based on the expert opinions.
Figure 4 Population Employment Matrix: Shortlisted scenarios, CTS (LEAassociates, 2008)
9|PageFigure 5 Population Distribution Matrix, CTS (LEAassociates, 2008)
However, MMR Regional Plan for 2016-36 (MMRDA, 2016) mentions that in the post-CTS period, it is
evident that population growth is going to be substantially less and the Special Economic Zones in
Uran-Pen region which were supposed to draw population out of MCGM are not implemented as
envisaged. The RP predicts future growth might be concentrated in Vasai-Virar, Mira-Bhayandar,
Badalapur and Navi Mumbai areas unlike in Uran-Pen SEZ areas as predicted by CTS.
The Regional Plan of 1996 had expected growth to be concentrated along transport corridors i.e road
and rail systems. Therefore, to effectively manage the development, the Regional Plan of 20106-36
focuses on 4 planned growth centres and 7 Special Planning Authorities as per proposed land use
zoning. The objective of such proposals is to bring jobs where people live, boost the economy and
generate employment.
Recognising the transit needs for the new industrial corridors, following proposals are underway:
1. Suburbanisation of all existing rail tracks
2. New Suburban rail networks
3. East-West Connectivity with new tunnels and creek bridges
4. Improving North-South connectivity through Coastal Roads and Multi-modal corridors.
Integrating urban development and land use changes in the transport policy is crucial of mitigating the
emissions originating from vehicular traffic. Mumbai is looked at as a sea of economic opportunities
and economic growth has always driven the urban development in Mumbai. Affordable and accessible
transport has always played an instrumental role in the development of Mumbai. Therefore,
integrated land use and transport planning to provide better access to jobs, goods and services while
providing facilities for users to avoid motorised trips by planned land use zoning can be instrumental
in reducing the vehicular emissions in the coming future.
2.2 `Shift’ Policy Measures:
Road User Charges:
Congestion Pricing:
There have been various recommendations on the issue of congestion pricing in Mumbai at various
points in the past couple of decades. The 11-member panel, The High Power Committee (HPC) formed
under the chairmanship of Dr Amitabh Rajan, additional chief secretary of home department,
appointed on the instructions of the Bombay high court submitted a 51- point action plan in March
2013. It had two ideas for imposing the congestion levy on car users. One, a congestion charge to
restrict the number of vehicles in certain areas, including the city's central business districts, and two,
congestion pricing on certain goods in select zones. Together, these two measures "could be a possible
10 | P a g esolution for reducing vehicle density on congested roads", the panel said, suggesting a two-to-three- year timeframe for the introduction of congestion charges. But no concrete action has been taken since then. (Moneylife, 2013) (India Express, 2013). In 2013, the Ministry of Urban Development (MoUD) Secretary had written a letter to the chief secretaries of states to reduce traffic during peak hours. He recommended an introduction of ‘congestion charge’ in cities. The letter explained that it is to “charge a price in order to allocate a scarce resource to its most valuable use”. It suggested a manual permit/ coupon system similar to early attempts in Singapore when it attempted congestion pricing for the first time. The Mumbai City Development Plan 2005-25 laid out a Strategy for Transportation keeping in mind that it is essential that Travel Demand Management measures are coupled with improvements in Public Transport systems without which the shift from private vehicles to public transport cannot be expected. Singapore and London have successfully implemented demand measures like congestion pricing, Low Emissions Zones, parking policy but they first improved public transport prior to implementing these measures. In addition to that measures like premium on car ownership and proof of availability of car parking at the residence and at the workplace can also be implemented. Car Restricted Zones or Car- free zones: Car free day was celebrated in Mumbai for 4 consecutive years from 2010-14 in Bandra and Churchgate. However, the initiative by various non-governmental organisations failed to gather much steam because of the mismanagement of traffic. The initiative organised several activities, such as music performances and games for every age group, it ended up in major traffic blockage and air and noise pollution in the adjoining areas. For the more successful implementation of such activities, key city officials, traffic police need to manage the task on a broader scale with proper transportation planning. Car-Pooling: Mumbai Environmental and Social Network was the first NGO in the country which launched a car pool system in the Mumbai called Kool Pool in 2006. Many other commercial platforms and cab services like Ola and Uber now provide car sharing options for users at affordable rates. Parking Policy: Car ownership in Mumbai is fairly low (32 cars per 1000 persons) as compared to other Asian cities with similar densities (LEAAssociates 2008). On street parking, has become one of the major concerns resulting traffic jams and congestion on the roads which essentially leads to more fuel combustion and emission from the vehicles. Easy availability of off street parking also doesn't actively present itself as a deterrent for car ownership. Therefore, regulation of parking spaces has become an important issue in the transport policy of Mumbai. Mumbai, as mentioned earlier, has extremely high public transport ridership as compared to other Indian and Asian cities. Therefore, it is important to provide parking spaces for feeder system integration with rail and metros but also keep in mind to avoid overprovision which can cause congestion. The Mumbai DP currently follows a “conventional approach” of overprovision based on projected demand (EMBARQ, 2014) However, after a long court stay order, BMC has started the implementation of differential parking fees across Mumbai except for a few designated tourist spots and public places. The city has been divided into three categories--A, B and C, for applying differential parking rates. The most crowded places attract highest parking fee. For example, it will cost Rs. 60 per hour to park a car at Kala Ghoda (category A) but a third of that near Shoppers Stop on Ghatkopar-Mahul Road (category C). All rates will be different on Sunday, public holidays and depending on the time of the day. Better Bus Service: BRTS (MUTP, 2016) undertook major transport sector projects in Mumbai. As Mumbai has restricted space for new roads infrastructure, faster traffic on existing roads becomes a priority. Keeping this in mind Mumbai has plans to implement Bus Rapid Transit System (BRTS) with dedicated bus lanes to improve 11 | P a g e
connectivity and to attract more commuters. Dedicated Bus corridors were suggested for various
multi-lane highways like Jogeshwari- Vikhroli Link Road, Santacruz- Chembur Link Road, Western
Express Highway and Eastern Express highway.
Experts believe the system will help reduce the number of cars on the roads, as it provides a
comfortable and faster alternative to car travel, at a cheaper rate. It will increase capacity, reduce
delays and promote more reliability among bus commuters which has been a primary concern for
BEST (Hindustan Times, 2016)
Water Transport:
Maharashtra Maritime Board (MMB), the City and Industrial Development Corporation (CIDCO) and
Mumbai Port Trust (MbPt) are jointly working to implement the long-pending water transport system
in Mumbai. Terminals will be constructed at Ferry Wharf, Mandwa and Nerul which currently take
around 2 hours travel by road from South Mumbai. The distance can be covered in 15-20 mins by ferry
and Ro-Ro (roll on/roll off) ships.
The CIDCO terminal at Nerul currently only caters to passenger traffic. However, the Ro-RO ships will
be used for vehicular transport also providing motorists with an alternate route from Navi Mumbai to
Mumbai. The project is aimed to ease the burden on highways and save commuters from traffic jams
and air pollution effects (Indian Express, 2016).

2.3 `Improve’ Policy Measures:
Improvement of NMT Infrastructure
As already mentioned, over 52% of all work trips in Mumbai are done on foot. Therefore, it is crucial
to promote safe and secure walking environments. Non-motorised transport (walking and bicycling)
are also important modes of feeder system along with autos and taxis.
Conventional transport planning has focused on the movement of vehicles rather than the movement
of people in Indian cities. The majority of low-income classes still prefer walking and cycling to reach
their destination in Mumbai (Judy Baker, WB report) for distances less than 3-4 km. NMT modes are
environmentally friendly, healthy options which also provide flexibility and affordability. In-spite of
this, physical conditions of roads and other necessary infrastructure are abysmally low in Indian cities.
Mumbai is no exception. Pedestrian footpaths, sidewalks, traffic signals, cycle lanes, cycle routes, cycle
signals, cycle parking and cycle sharing need immediate attention at planning and policy levels.
NMT guidelines by MoUD in 2016 (Ministry of Urban Development, 2016)acknowledge that most of
the captive cyclists in India belong to low-income group and there is an aspirational value attached to
car ownership. However, there is a need for disassociation of the social stigma and promote new road
facilities for promoting the sustainable, environmental friendly Non- Motorised modes of transport.
Alternative Fuel Use
As per IEA report 2009, fossil fuel based transportation is the second highest source of CO2 emissions
globally. Therefore, globally this has become an increasing concern towards developing vehicles based
on alternative, low carbon electric energy derived from renewable energy sources.
Hybrid and Electric Vehicles
The government of India launched the National Electric Mobility Mission Plan 2020 in 2012
(Department of Heavy Industries, 2012). It aims to achieve national fuel security by promoting hybrid
and electric vehicles in the country. Greater adoption of electric vehicles as one of the key initiatives
by the government is likely to have substantial CO2 emission reduction. As this is new technology in
India,

12 | P a g e
Biofuel:
Ministry of New and Renewable Energy (MNRE) and the Cabinet approved the National Biofuel Policy
which targeted 20% blending of bio-fuels by 2017. The policy gave due consideration to various
aspects like food security, meeting of energy needs, involvement and development of local
communities etc. National Biofuel Coordination Steering Committee provided innovative
recommendations such as the provision of contract farming, Minimum Support Price must be at par
with other agricultural items etc. to avoid key challenges of food security and sustainability. However,
further research needs to be undertaken with respect to commercial viability, wasteland use and other
socio-economic and environmental consequences.

Transition to CNG Vehicles:
By 2016, India had 2.8 million Natural Gas Vehicles on the roads. The NGV programmes have huge
potential in the transport sector in India as currently the expansion of natural gas grid and access to
natural gas is still a hindrance for most of the cities. The India's NGV programmes were focused to
retrofit the most polluting diesel buses, three-wheelers, taxis and small commercial vehicles. Though
fuel consumption of three- wheelers is much lower compared to cars, the CO2 emissions of the
retrofitted three-wheeler models are comparatively higher than the diesel and petrol counterparts
(Roychowdhury, 2010).
Fuel Standards
Under the Mumbai Urban Transport project (MUTP, 2016)funded by World Bank, BEST procured 644
low emission and user-friendly buses to replace used or over-aged buses, to provide additional seats
for users and to improve the service quality. Originally the target was 450 but was increased to 644 at
restructuring. The acquired buses were newer EURO III compliant, single-deckers with reduced noise
levels and better emission control. Older buses were upgraded to slightly lower EURO II standards.

Improvement in Technology
A catalytic converter is a vehicle emissions control device which converts toxic by-products of
combustion in the exhaust of an internal combustion engine to less toxic substances by way of
catalysed chemical reactions. Though such converters are known to reduce pollution, they add to
more CO2 emission. More research and development needs to be undertaken in this direction.
Auto Fuel Vision Policy 2025: The mission statement of Draft Auto Fuel Vision and Policy 2025 (GoI,
2014) says “To develop an auto-fuel vision, road-map and an enabling policy framework, going
forward to the year 2025 that aims to minimise the contribution of vehicular use to (primarily) urban
air pollution in the shortest possible time frame and to do so in a financially sustainable manner.”
Green House Gas (GHG) emissions are more-or-less another way to express fuel use efficiency. In the
wake of climate change, many countries around the world have undertaken the mission to improve
fuel emissions i.e. to propose GHG emission standards.

In line with the Auto Fuel Policy, India 2000 norms were implemented nationwide in the year 2000,
Bharat Stage II came in 2003 and Bharat Stage III auto fuel quality norms came into existence from
April 2010 for 13 major cities initially and then in rest of city. Similarly, BS IV and BS III auto fuel quality
norms came into effect from April 2010 in 13 major cities and in the rest of the country respectively.

13 | P a g e
Figure 6 CO2 contribution by vehicle type, Auto Fuel Vision Policy 2012

Auto fuel vision policy (GoI, 2014) makes an interesting observation that small vehicles affect the
Overall Corporate Average Fuel Efficiency of the Auto industry in a positive manner. The figure, based
on industry performance in 2010, shows that the average CO2 emissions from small cars is 30% lower
than that of other cars which suggest that there is a need to promote smaller cars on Indian roads.
BEST- Online Ticketing and Tracking System –
BEST has made plans for Mumbai bus commuters to avail the use of two mobile apps to book bus
tickets online and track their bus in real time. BEST has been incurring losses close to 900 crores since
2014 due to the unreliability of bus services. There is an easy transition from bus to intermediate
public transport such as taxis and autos as buses couldn't follow strict time schedules. In order to
prevent such transition and promote sustainable, high-occupancy bus transport instead of using
private vehicles, BEST has decided to go digital. Such cashless transactions will promote more
reliability and convenience for bus commuters (IndianExpress, 2016).

14 | P a g e
3. Proposed Policy Packages for Transport Sector Mitigation in MMR
It can be concluded from the detailed literature review and expert opinions that Land Use and Land
Use Changes, Public Transport Infrastructure, Parking Policy, Congestion Pricing, and promoting
Cycling are some of the important interventions for mitigation in Mumbai.

3.1 Integrated Land Use and Transport Policy

 Policy Package 1

                                                  Development of
                                                 Growth Centres in
               Integrated Land Use                   RoR
               and Transport Policy

                                                  Transit Oriented
                                                   Development

The main objective of this policy package is to provide a spatial framework for future urban
development in MMR to create liveable communities with better access to transport infrastructure. It
will focus on new development to distribute the population and employment opportunities across the
city and decongest the central business district of MCGM.

3.1.1 Development of Growth Centres:
Planned growth centres can be developed in the green field areas of Municipalities other than MCGM
in MMR (MMRDA, 2016) The movement of goods and people in the city is the consequence of land
development and transport network which will change according to this policy package which will
decongest MCGM in future.
Fig. 7 illustrates the important locations for Growth Centres and Regional Industrial Corridors as
mentioned in Mumbai Metropolitan Regional Plan 2016-36 (MMRDA, 2016). They are as following

                          Figure 7 Details of Proposed Growth Centres, (MMRDA, 2016)

15 | P a g e
Figure 8 Details of proposed Regional Industrial Corridors, (MMRDA, 2016)
Figure 9 Proposed Growth Centres and Regional Industrial Corridors in MMR, (MMRDA, 2016)
16 | P a g e3.1.2 Transit Oriented Development
A comprehensive Transit Oriented Development involves various components like compact
development around transport networks, promote transit-friendly land use, build more public spaces
etc. basically to encourage maximum use of public and non-motorised transport modes in the city. A
typical TOD design will have high-density settlement around the train/metro/bus stations with a
subsequent decrease in density as you move away. MMR has already been heavily dependent on
public transport and has exhibited signs of Transit Adjacent Development (TAD) in various parts of the
city. (EMBARQ, 2014)
The same strategy with a necessary provision in Dvelopment Control Regulations needs to be carried
out in newly developing areas with better provision of walking and cycling infrastructure for
pedestrians and cyclists to feel safe on the road. Also, on-street parking provisions in the areas should
be restricted and provision of parking for IPT and buses should be done to promote high occupancy
vehicle use. It is proposed in RP to permit intensive development around such rail or metro stations
when they become operational in the form of Station Area Development Scheme (SADS) similar to
gaothan areas or village areas in newly developing green field areas.
The development of growth centres will provide jobs and drive economic growth in the outer city
areas. Along with TOD, it will largely affect the horizon year population and employment distribution
in the future. With the mixed land use of commercial, industrial and residential areas, the trip
generation will be affected. The origin- destination of trips will be altered. Also, the long travel time
which is the characteristic of Mumbai local train journeys will be substantially affected. Fig.10
demonstrates the conceptual methodology of incorporating the policy package 2 in the Travel
Demand Model.
Integrated LU & Transport Policy
Study Area Horizon Year Horizon Year Travel Demand
Zoning Road Network Population and from Traffic
Employment Surveys
Vehicle Kms
Trip Generation
Trip Ends, TLFD, Skimmed Travelled (VKT)
Matrix (Shortest Path), Trip Distribution
Travel Demand Matrix Volume/ Capacity
ratio (V/C)
Modal Split
Trip Assignment
Inputs
Horizon Year Link Flows and V/C Output
Ratios
Figure 10 Methodology for incorporating Policy Package 1 in TDM
17 | P a g e3.2 Transport Infrastructure Development
Transport
Policy Package 2 Infrastructure
Development
Road NMT
Rail and MRTS Bus Services
Network(MUIP) Infrastructure
Expansion of rail Pedestrain
Creek Bridges BRTS/EBL
Terminus Pathways
Extended Metro Dedicated Bicycle
Flyovers AC buses
Corridors Tracks
Online ticketing
AC, Double-
Widening and tracking
decker local train
system
The main objective of this policy scenario is to improve the network conditions and provide quality
ridership to public transport users. In a market economy, properly functioning roads, rails, metros,
buses are the need of the hour to encourage people to use public transport. Also, improvement in
road infrastructure is necessary to avoid congestion which leads to serious GHG emissions. Based on
Mumbai RP and Mumbai Urban Infrastructure Project (MUIP) plans, following new developments in
road and public transport networks are on their way in MMR:
New Rail terminus at Panvel where four suburban corridors of Panvel-CST, Panvel-Diva-
Vasai, Panvel-Karjat and Panvel-Roha converge.
MUIP II for efficient transport mobility, Sahar Elevated Access road from International
airport (WEH) to CST
Dedicated Bus lanes on JVLR, WEH, EEH
Bike Sharing/ stations, cycle lanes across transit corridors
Revised Metro Corridors
Figure 11 Revised Metro Corridors, MUIP
18 | P a g eSuch developments and improvements in transport infrastructure will have direct impact on the
horizon year transport network and indirect impacts on population-employment matrix. It will
significantly shape the modal split, trip assignment and distribution. It will influence the travel time,
cost and distance in a big way for Mumbai Transport. Fig 12 demonstrates the conceptual
methodology of incorporating the policy package 2 in the Travel Demand Model for the horizon year.
Transport Infrastructure
Development
Study Area Horizon Year Horizon Year Travel Demand
Zoning Road Network Population and from Traffic
Employment Surveys
Vehicle Kms
Trip Generation
Trip Ends, TLFD, Skimmed Travelled ( VKT)
Matrix (Shortest Path), Trip Distribution
Volume/ Capacity
Travel Demand Matrix
ratio (V/C)
Modal Split
Trip Assignment
Inputs
Horizon Year Link Flows and V/C Output
Ratios
Figure 12 Methodology for incorporating Policy Package 2 in TDM
3.3 Travel Demand Management
Travel Demand
Policy Package 3 Management
Road User Restricted Car
Parking Policy
Charges USe
Congestion
Car Pooling Park and Ride
Pricing
Toll Charges Bike Sharing Differential
Parking
charges
Differential
Increased Fuel Registration
Costs Chargs based on Ensuring provision
emission of car parking at
potential home and
workplace
19 | P a g eThe main objective of this policy package is to reduce travel demand by effective policies and
regulations. Managing the growth of travel demand is essential in managing traffic congestion which
in turn leads to carbon emissions from the transport sector. It tries to target the travel behaviour and
system efficiency and largely comprises of parking management, promotion of high occupancy vehicle
use road user charges and fuel costs and standards. Travel Demand Management directly impacts the
vehicle kilometres travelled and reduces CO2 emissions. Fig. 13 demonstrates the methodology to
incorporate the travel demand management policy package 3 in the TDM.
Study Area Horizon Year Horizon Year Travel Demand
Zoning Road Network Population and from Traffic
Employment Surveys
Vehicle Kms
Trip Generation
Trip Ends, TLFD, Skimmed Travelled (VKT)
Matrix (Shortest Path), Trip Distribution
Volume/ Capacity
Travel Demand Matrix
ratio (V/C)
(mode wise) Modal Split
Travel Demand Trip Assignment
Management Inputs
Horizon Year Link Flows and V/C Output
Ratios
Figure 13 Methodology for incorporating Policy Package 3 in TDM
3.4 Technology Improvement
Policy Package 4 Electric/ Hybrid
Vehicles
CNG buses/
Alternative Fuel
autos/ taxis
Technology
Improvement
Fuel Standards Bio-fuel
20 | P a g eFuel based changes will affect emission factors of the vehicles and indirectly affect the cost of travel.
The main objective of this scenario is to reduce the vehicular emissions through technology
improvement. Technology will play a significant role in climate change mitigation and transforming
the transportation sector in the horizon years. Though it is not possible to directly incorporate
technology changes in the Travel Demand model, decreased emission factors of the vehicles and
increased travel costs associated with ownership of electric/hybrid cars can be modelled. Electric
vehicles can increase the congestion on the roads which can further affect the modal split indirectly
Fig. 14 demonstrates the methodology to incorporate policy package 4 in TDM.
Study Area Horizon Year Horizon Year Travel Demand
Zoning Road Network Population and from Traffic
Employment Surveys
Vehicle Kms
Trip Generation
Trip Ends, TLFD, Skimmed Travelled (VKT)
Matrix (Shortest Path), Trip Distribution
Volume/ Capacity
Travel Demand Matrix
ratio (V/C)
(mode wise) Modal Split
Technology Trip Assignment Inputs
Improvement
Output
Horizon Year Link Flows and V/C
Ratios
Figure 14 Methodology to incorporate policy package 4 in TDM
21 | P a g eReferences
Alankar. (2015). India’s Megacities and Climate Change: Explorations from Delhi and Mumbai. STEPS
Centre.
Banister, D. (2011). Cities, mobility and climate change. Journal of Transport Geography, 19(6), 1538-
1546.
Department of Heavy Industries, GoI. (2012). National Electric Mobility Mission Plan 2020.
Basavaraj, G., Rao, P. P., Ravinder Reddy, C., Ashok Kumar, A., Srinivasa Rao, P., & Reddy, B. V. S.
(2012). A Review of the National Biofuel Policy in India: A critique of the Need to Promote
Alternative Feedstocks. Working Paper Series no. 34.
IndianExpress. (2016, September 23). Now, two apps to track BEST buses & book tickets online.
Retrieved from Indian Express: http://indianexpress.com/article/india/india-news-
india/now-two-apps-to-track-best-buses-book-tickets-online-3045187/
Baker, J. L. (2005). Urban poverty and transport: the case of Mumbai (Vol. 3693). World Bank
Publications.
Ranger, N., Hallegatte, S., Bhattacharya, S., Bachu, M., Priya, S., Dhore, K., ... & Herweijer, C. (2011).
An assessment of the potential impact of climate change on flood risk in Mumbai. Climatic
change, 104(1), 139-167
Nicholls, R. J., Hanson, S., Herweijer, C., Patmore, N., Hallegatte, S., Corfee-Morlot, J., ... & Muir-
Wood, R. (2008). Ranking port cities with high exposure and vulnerability to climate extremes.
Roychowdhury, A. (2010). CNG programme in India: The future challenges. Fact Sheet Series.
LEAassociates. (2008). Conprehensive Transportation Study, TRANSFORM. Mumbai: MMRDA.
Ministry of Urban Development, GoI (2016). NMT Guidance Document. Ministry of Urban
Development, Government of India (GoI).
MMRDA. (2016). Draft Mumbai Metropolitan Regional Plan 2016-36. Mumbai: Mumbai
Metropolitan Regional Development Authority.
Goi,(2014). Auto fuel vision and policy 2025, Report of the expert committee. Government of India.
Moneylife. (2013, April 16). Here is why Mumbai needs more buses than cars. Retrieved from
Moneylife: http://www.moneylife.in/article/here-is-why-mumbai-needs-more-buses-than-
cars/32198.html
MUTP, M. U. (2016). Project Performance Assessment Report. World Bank Group.
NEERI, N. E. (2010). Air Quality Assessment,Emissions Inventory and Source Apportionment Studies :
Mumbai. Centre Pollution Control Board.
TERI. (2015). Environmental Status Report. MMRDA.
22 | P a g e23 | P a g e
You can also read