Mixing social media analysis and physical models to monitor invasive species - ODYSSEA
←
→
Page content transcription
If your browser does not render page correctly, please read the page content below
FUSION2020                                        Virtual conference, Pretoria, South Africa                                   6 - 9 July 2020

  Mixing social media analysis and physical models
             to monitor invasive species
          Claire Laudy                     Lőrinc Mészáros                Sonja Wanke                       Mercedes de Juan
              Thales                    Deltares                 Deltares              Fundación Valenciaport
        Palaiseau, France          Delft, Netherlands       Delft, Netherlands            Valencia, Spain
 claire.laudy@thalesgroup.com lorinc.meszaros@deltares.nl sonja.wanke@deltares.nl mdejuan@fundacion.valenciaport.com

   Abstract—Invasive species, such as jellyfish, cause economic            through dedicated applications. With the aim to acquire and
losses in millions annually. Therefore, being able to accurately           use information provided by citizens, we developed a soft
monitor and predict jellyfish is vital to several stakeholders (e.g.       information processing chain. The soft data processing chain
tourism, fishery, government). A potential tool to help these
communities could be by combining a biophysical drift model                relies on the use of InSyTo combined with access to the Twitter
with a processing chain for soft information fusion which would            API and the use of Google translate service.
predict jellyfish occurrences. To guarantee accuracy, the model               The remaining of the paper is organised as follows. Section
needs to be validated by actual data. This data can be gathered            2 presents the context of our work including the Odyssea
from citizens who reported jellyfish sightings on social media or a        project and the societal impacts of jellyfish blooms on dif-
dedicated citizen science mobile app. As the information provided
by citizens is spread among numerous atomic reports, we use a              ferent sectors of the economy. Section 3 briefly describes
platform for soft information fusion to aggregate and fuse these           the biophysical drift model. In section 4, we present the soft
reports into a single information network. The soft information            information acquisition processing chain. We detail how we
fusion platform relies on the use of domain knowledge, provided            deal with information items expressed in natural language
through an ontology. The information network can then be                   associated with metadata up to its transformation and aggre-
queried to extract relevant features to validate the jellyfish drift
model. Future work includes the initialisation of the model with           gation into a semantic information network. Finally, section 5
soft information, as well as making use of the different levels of         presents tracks for future work, regarding the initialization of
quality of the reports provided by citizens, in order to assess the        the model with soft information and the management of the
quality of the fused information.                                          heterogeneous quality in the numerous soft information items.
   Index Terms—Ontologies, Hard-Soft Fusion, Natural Lan-
guage Processing                                                                         II. C ONTEXT AND RELATED WORK
                                                                           A. The ODYSSEA Project
                        I. I NTRODUCTION
                                                                                       ODYSSEA (http://odysseaplatform.eu/) is an EU H2020-
   Coastal tourism is an important source of wealth in Europe
                                                                                    funded project aiming to develop, operate and demonstrate an
and generates a total of C 183 billion in gross value added.
                                                                                    interoperable and cost-effective platform that fully integrates
This represents over one third of the maritime economy while
                                                                                    networks of observing and forecasting systems across the
employing over 3.2 million people1 . During the past years,
                                                                                    Mediterranean basin, addressing both the open sea and the
anomalies in jellyfish populations have led to undesirable
                                                                                    coastal zone. The project involves 28 partners (universities,
consequences. Jellyfish blooms have become very common
                                                                                    research centres, international organizations, NGOs and private
and several sectors, such as coastal tourism and fisheries
                                                                                    companies).
are majorly affected by their presence. For example, jellyfish
                                                                                       Within the ODYSSEA project, a biophysical approach for
blooms repel thousands of beachgoers and the fishing industry
                                                                                    invasive species monitoring was proposed. If complex models
encounters clogged fishnets and stings. However, predicting
                                                                                    are developed to model the drift and expansion of invasive
and monitoring jellyfish blooms is challenging. Unlike other
                                                                                    species, it is often difficult to validate and initialize these
disastrous events, such as oil spills, they cannot be spotted
                                                                                    models with information concerning the actual presence of
through satellite imagery before they reach the beaches.
                                                                                    such species. Jellyfish, for instance, are very difficult to
   Within the H2020 ODYSSEA project, a biophysical drift
                                                                                    spot with currently deployed physical and biological sensors.
model was developed, which predicts jellyfish blooms and
                                                                                    However, when a beach is invaded by jellyfish, a lot of people
their location of appearance. The model encompasses a large
                                                                                    share the information on social media or dedicated citizen
number of parameters, and among them, the different stages
                                                                                    science apps. Our idea is to use information gathered on social
of development of the jellyfish. In order to collect data for
                                                                                    media and dedicated apps to support the monitoring of invasive
model validation, we relied on information gathered from
                                                                                    species, the same way as social media is used to support crisis
social networks, namely Twitter, and citizens reports collected
                                                                                    management [1]. The role played by social media in crisis and
 1 https://ec.europa.eu/maritimeaffairs/sites/maritimeaffairs/files/docs/body/study-emergency events take action from the situation assessment
maritime-and-coastal-tourism en.pdf                                                 phase, with new sources of information about the ongoing

                                                  All rights reserved. Copyright © 2020 by ISIF
FUSION2020 Virtual conference, Pretoria, South Africa 6 - 9 July 2020
(potentially remote) situation, to the dispatch of response shift of a jellyfish shoal was estimated by a drift model
efforts. Therefore, the use and management of social media (Lagrangian type), in which particles are assimilated to the
during a crisis is an emerging and rapidly growing trend in jellyfish shoal.
the crisis management and IT research communities (examples
of such work are described in references [2] to [11]). Similarly
to what has been done in the crisis management domain we
would like to use the information provided by citizens through
social media and mobile apps to improve invasive species
monitoring.
B. Jellyfish Invasion Monitoring Use Case
Although an essential part of a healthy marine ecosystem,
anomalies in jellyfish populations have led to undesirable
consequences for societies dependent on marine resources.
When favourable conditions are present, jellyfish population
quickly expand resulting in jellyfish blooms. These blooms
consist of large numbers of jellyfish and can be problematic
through their direct interference with human activities (e.g.
tourism, fishing, etc.).
Unfortunately, jellyfish blooms have been very common The initial offshore position of the jellyfish shoal is deter-
globally in recent years and could be linked to climate change, mined by sightings. The forecast model is feed by the data
overfishing and eutrophication. According to the latest report provided by a huge number of volunteers (fishing vessels,
on World Fisheries and Aquaculture, more than 30 of major pleasure crafts, etc), who collect the information on the
commercial marine species are being fished to unsustainable presence of jellyfish at sea. The information is collected in two
levels, creating an imbalance in the species distribution of different ways: the first consists of filling in an excel sheet with
the marine environment. Jellyfish are preys of many Mediter- the information related to the species sighted (if known), the
ranean top predators, however, since the numbers of predators approximate number of jellyfish in the shoal and their position
gradually decline, jellyfish populations are flourishing. In addi- taken from the GPS data of the boat. The information is sent
tion to that, an increasing trend in chlorophyll-a concentration by e-mail to be processed. The second option for initial data
in the Mediterranean Sea shows phytoplankton growth, which collection is based on the use of an app that directly feeds
creates a suitable environment with high food availability for the prediction system. Both data collection systems allow to
jellyfish. attach photos for supporting the identification of the jellyfish
The most affected by jellyfish blooms is the tourism sector species listed.
which suffers losses in millions of euros when blooms block On the one hand, the prediction system is used to send
beaches and sting bathers. While the stings can be painful and warnings of the arrival of jellyfish on the beaches in order to
last up to two weeks, it is not the only effect as the inconve- limit bathing. On the other hand, the system itself is a source
nience the mauve stinger causes repels thousands of potential of data that allows universities and research centers to continue
beachgoers. Second to tourism comes the fishing industry and their studies on the proliferation of jellyfish.
aquaculture. The fishing industry suffers because of clogged In Spain, there are several prediction systems running thanks
fishing nets, painful stings and a reduced economic revenue. to the close cooperation between Administration, Research
Moreover, in the aquaculture sector mainly salmon and sea Centers and Volunteers. The forecast drift model of jellyfish is
bream species are impacted as jellyfish swarms may damage obtained by a combination of hydrodynamic and meteorologi-
whole fish farms in case they are floating by and therefore cal models. Based on the currents (Regional Ocean Modeling
causing economic losses in millions. The consequences of System (ROMS) model) and wind (Aemet meteorological
episodes of jellyfish blooms are detrimental to all three sectors. model), a drift model was applied (Lagrangian type), in which
In order to solve this problem, the first and most important particles are assimilated to the organisms (jellyfish) sighted.
step is to report sightings and issue early warnings on jellyfish The sighting system is based on the participation of vol-
occurrence to the relevant end-users in the affected sectors. unteers (fishing vessels, pleasure crafts, etc.) in the collection
For dealing with this problem, the ODYSSEA project aims of information on the presence of jellyfish at sea. To ensure
to create an integrated system for the sighting, prediction and that the sightings meet quality criteria, the Administration
research of jellyfish on the Mediterranean coast. and Research Centers elaborated guidelines for the identifi-
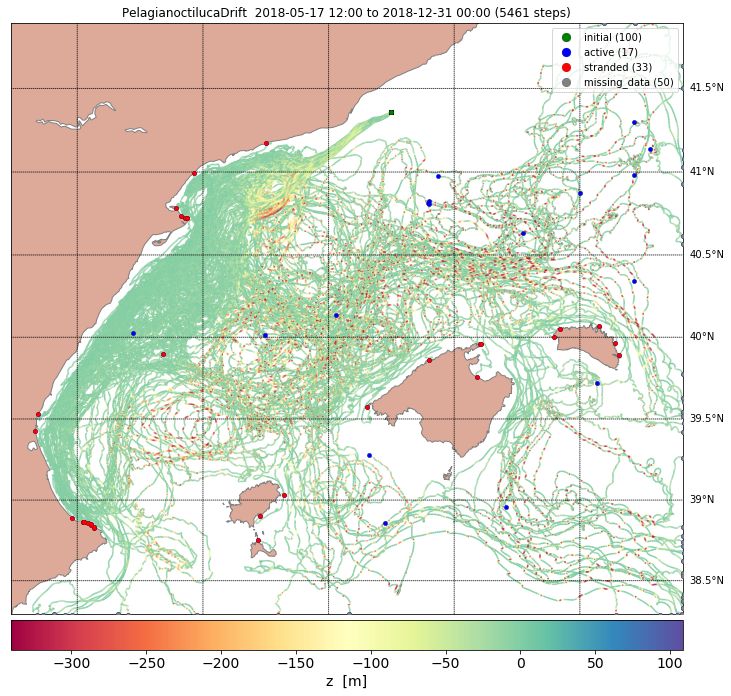
The jellyfish prediction system runs thanks to the close cation of the most common jellyfish species in the Spanish
cooperation between Administration, Research Centers and Mediterranean coast, which were distributed among numer-
Volunteers. Deltares has been responsible of developing a ous agents (fishermen’s associations, recreational fishermen’s
forecast drifts model of jellyfish, which is obtained by a associations, conservationist associations, diving clubs, surf
combination of hydrodynamic and meteorological models. The collectives, research entities, etc.).
All rights reserved. Copyright © 2020 by ISIF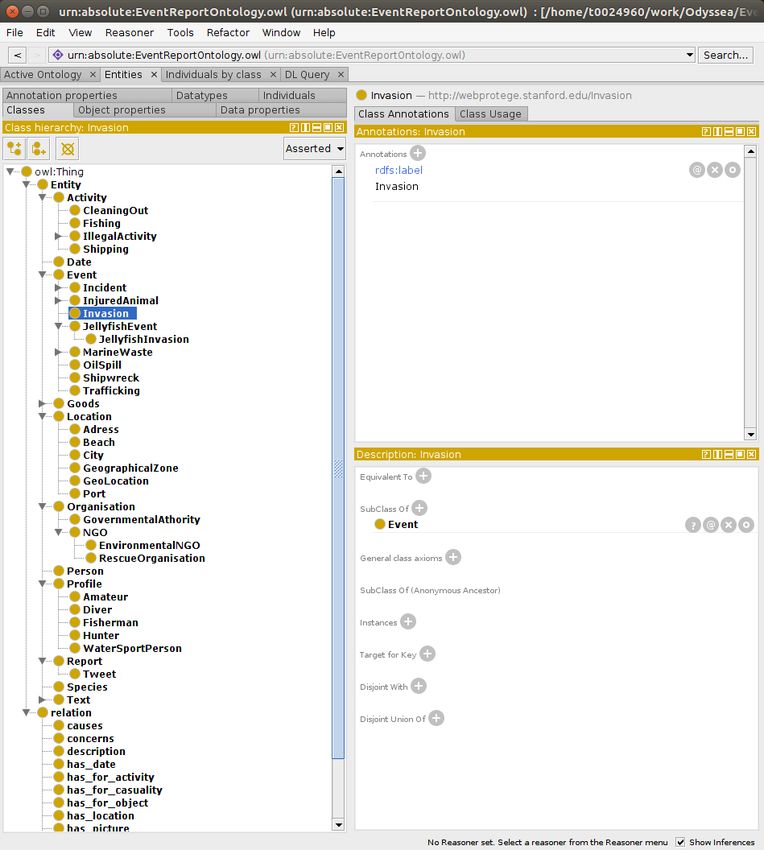
FUSION2020                                   Virtual conference, Pretoria, South Africa                                          6 - 9 July 2020

             III. M ODELLING JELLYFISH DRIFT
   Using numerical modelling tools the behaviour of jellyfish
can be simulated and their horizontal and vertical migra-
tion can be predicted. These predictions may include the
likelihood of jellyfish spatial and temporal distributions and
potential stranding locations before they reach the coast in
touristic areas. Within the ODYSSEA project an individual-
based model (IBM) was developed to simulate the life cycle of
mauve stinger (Pelagia noctiluca) from fertilized egg stage to
the adult stage [17]. This IBM combines available biological
and behavioral knowledge on the mauve stinger with freely
available hydrodynamic fields from the Copernicus Marine
Environment Monitoring Service (CMEMS). It should be
noted that current developments focus only on the mauve
stinger but the model can be adapted to other species.
   More specifically, the jellyfish drift model is a biophysical
model which describes both the lifecycle and the horizon-
tal transport of the jellyfish. The lifecycle modelling in-
cludes spawning (release of fertilized eggs), stage development
(growth), and behavioural processes such as diurnal vertical
migration and temperature-induced behaviour (motility ad-             Fig. 1. Illustrative example output of jellyfish drift model, developed within
justed for the effect if temperature).                                the H2020 ODYSSEA project, indicating trajectories together with initial
   The model is driven by the hydrodynamic field input                locations, active particle positions, and stranded jellyfish in the Balearic Sea.
from CMEMS models and is built in the general Lagrangian
particle tracking framework OpenDrift [16]. By combining
                                                                         We first describe the use of a domain ontology to param-
hydrodynamics, particle tracking and life cycle, the spatial
                                                                      eterize generic semantic information fusion algorithms. We
and temporal variations in distributions of jellyfish can be
                                                                      then describe the theoretical approach of conceptual graphs
simulated (see Figure 1).
                                                                      fusion that is used in the semantic information fusion platform
   Initial validation of this biophysical model was performed         and finally explain how this platform (namely InSyTo, [14])
with the aim to compare it with other more simplistic jellyfish       is specialized and used within our use case.
prediction approaches, which only included simple drifting, or
fixed diurnal behaviour. This general qualitative analysis was        A. Domain Ontology
conducted by comparing the predicted and observed stranding              Within the jellyfish monitoring use case, an ontology was
locations per month and per administrative units (NUTS2016).          designed to model the application domain. It is used to specify
For the given model period (May to December 2018), the                the usage of the data and the end-users needs. The ontology is
biophysical model performed the best in predicting jellyfish          the conceptual model, describing the application. It represents
sightings, followed by the simple drift model and the fixed           the different actors of the domain and the relations over these
diurnal behavior model. Nevertheless, it should be noted that         actors. Furthermore, it is used to parameterize the generic
the spatial and temporal coverage of the currently available          algorithms, that manage the soft data (i.e. actual observations
citizen sourced data is insufficient to conduct comprehensive         of jellyfish reported by citizens).
model validation. This motivates our study to investigate the            Figure 2 depicts the ontology used in our use case. It spec-
effectiveness of soft information fusion techniques in order to       ifies different events of interest regarding marine environment
enrich the validation dataset. In the future, after comprehensive     management, and for which the ODYSSEA project aims at
validation, this jellyfish drift modelling tool could be used to      providing citizen sourced information.
issue early warnings to inform local authorities and industries
for suspending bathing on affected areas or take other response       B. Conceptual Graphs Representation
measures to limit damages to their operations.                           Graph-based structures seem to be key structures for situa-
                                                                      tion understanding and soft information representation. Graph-
      IV. O BTAINING INFORMATION FROM CITIZENS
                                                                      based formalisms are easily readable and understandable by
   In order to obtain information from citizens, we developed         humans and graphs are a natural way to represent several
a processing chain that gathers information from Twitter as           ideas or objects interacting with each other. Our approach
well as from a dedicated mobile app. The processing chain             relies on the use of bipartite graphs, more specifically a
relies on the use of an ontology and the conceptual graphs            subset of the conceptual graphs ( [12], [13]) to represent soft
formalism, to provide a pivot representation framework. Thus,         data and knowledge. The conceptual graphs formalism is a
information items, coming from both sources can be merged.            model that encompasses a basic ontology (called vocabulary),

                                              All rights reserved. Copyright © 2020 by ISIF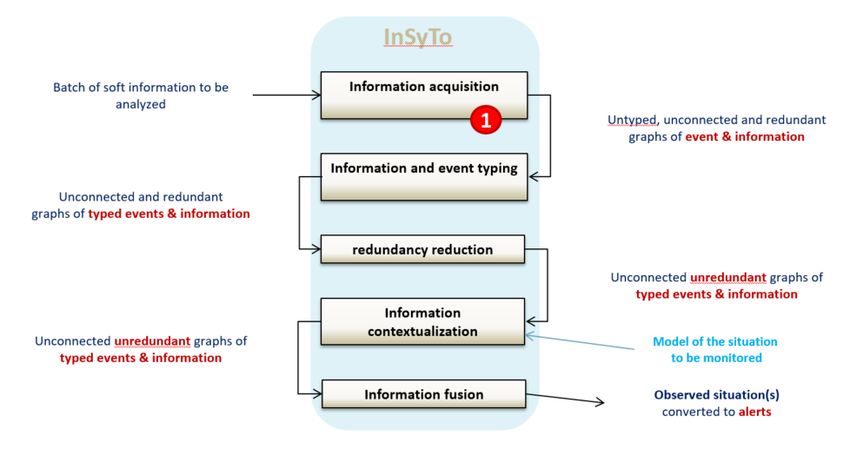
FUSION2020                                         Virtual conference, Pretoria, South Africa                              6 - 9 July 2020

                                                                           generic individual marker is either blank or noted with a star *,
                                                                           if the individual object referred to is unknown.
                                                                              The term relation is used to refer to a relation node. The
                                                                           relation nodes of a conceptual graph indicate the relations
                                                                           that hold between the different entities of the situation that
                                                                           is represented. Each relation node is labeled with a relation
                                                                           type that points out the kind of relation that is represented.
                                                                              The notion of vocabulary is defined in [13]. The concept
                                                                           types and the conceptual relation types, which are used to label
                                                                           the concept and relation nodes, are organized in hierarchies.
                                                                              Formally, we denote the set of concept types as TC , the set
                                                                           of relation types as TR and the set of individual markers that
                                                                           are used to labeled the concept nodes as markers, which de-
                                                                           fines a vocabulary V = (TC , TR , markers). A basic conceptual
                                                                           graph G is then defined by a 4-uple G = (CG , RG , EG , lG ),
                                                                           where
                                                                              •   (CG , RG , EG ) is a finite undirected and bipartite multi-
                                                                                  graph. CG is the set of concept nodes. RG is the set of
                                                                                  relation nodes, and EG is the set of edges.
       Fig. 2. Odyssea ontology for jellyfish invasion monitoring             •   lG is a naming function of the nodes and edges of the
                                                                                  graph G which satisfies:
                                                                                   1) A concept node c is labeled with a pair lG (c) =
graph structures and operations on the graphs. The vocabulary
                                                                                      (type(c), marker(c)), where type(c) 2 TC and
defines the different types of concepts and relations that exist
                                                                                      marker(c) 2 markers [ {*}.
in the modelled application domain, while the graphs provide
                                                                                   2) A relation node r is labeled by lG (r) 2 TR . lG (r)
a representation of the observations which are provided by the
                                                                                      is also called the type of r.
information sources.
   Basic conceptual graphs are bipartite graphs containing                   Within our case study, the vocabulary defined to support the
concept and relation nodes. Figure 3 gives an example of                   conceptual graphs is the domain ontology described in IV-A.
a conceptual graph. The rectangular boxes represent concept                This basic domain ontology contains the T-box part of the
nodes and the ovals represent relation nodes.                              ontology, that is used as a support for the types of concepts
                                                                           and relations used in the nodes of the conceptual graphs.
                                                                             The facts themselves, corresponding to the A-box of the
                        JellyfishInvasion: Evt                             ontology, are not defined in the basic ontology, as one of
                                                                           the the purposes of our work is to acquire them through the
                                                                           automatic extraction of information from the citizens reports.
                                                                           These facts will be stored as conceptual graphs, arranged in a
                             has location
                                                                           big information network.

                                                                           C. InSyTo : a platform for semantic information management
                         Beach: Malvarrosa                                    The InSyTo Synthesis platform encompasses a generic
               Fig. 3. An example of conceptual graph                      graph-based fusion algorithm made of two interrelated com-
                                                                           ponents. The first component is a generic sub-graph matching
   The term concept is used to refer to a concept node. The                algorithm, which itself relies on the use of fusion strategies.
concepts represent the “things” or entities that exist. A concept          The graph matching component takes care of the overall struc-
is labeled with two components: the conceptual type and the                tures of the initial and fused observations. It is in charge of the
individual marker.                                                         structural consistency of the fused information, regarding the
   The conceptual type defines the category to which the                   structures of the initial observations, within the fusion process.
entity belongs. For instance, in Figure 3 the concept [Beach:                 The fusion strategy part is made of similarity, compatibility
:Malvarrosa] is an instance of the category Beach, i.e., its               and functions over elements of the graphs to be fused. They
conceptual type is Country.                                                enable the customization of the generic fusion algorithm
   The individual marker relates a concept to a specific                   according to the context in which it is used. According to
object of the world. The object represented by [Beach:                     the fusion strategies that are used, the InSyTo graph fusion
:Malvarrosa] has the name (or value) Malvarrosa. The                       algorithm provides three different operations. These operations
individual markers may also be undefined. An undefined or                  are depicted in figure 4 and described hereafter.

                                                   All rights reserved. Copyright © 2020 by ISIF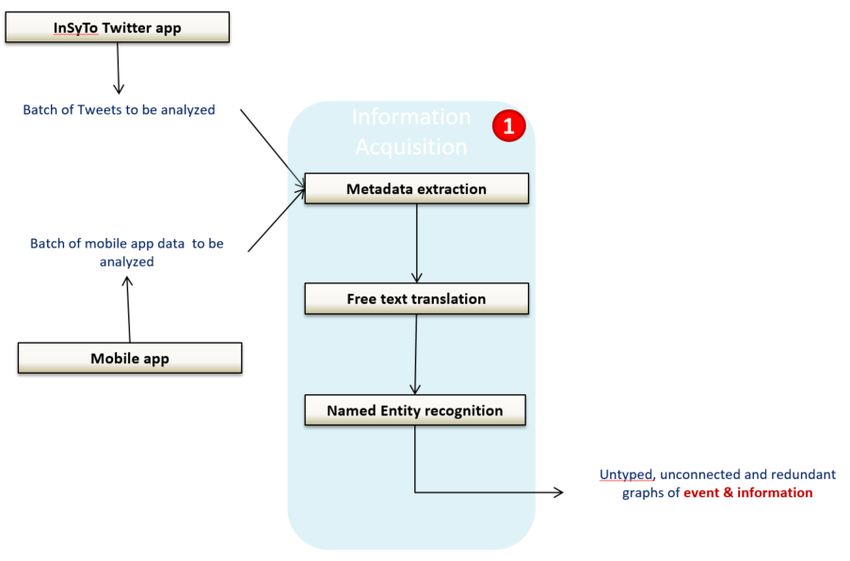
FUSION2020                                       Virtual conference, Pretoria, South Africa                             6 - 9 July 2020

                                                                         function. The use of the model constraints the structure of
                                                                         the fused observation.
                                                                         D. Tweet analysis using InSyTo
                                                                             We describe how these three functions are combined and
                                                                         used to acquire citizen sourced information through specific
                                                                         apps and social media. Within the jellyfish monitoring use
                                                                         case, we first made an inventory of the existing media com-
                                                                         monly used by citizens in order to report about events that may
                                                                         have an impact on touristic activities, such as jellyfish blooms.
                                                                         It appears that two classes of media are nowadays commonly
                                                                         used. The first one is composed of the many existing social
                                                                         networks through which citizens share with their connected
                                                                         fellows reports about what they encounter. These reports may
                                                                         include textual descriptions of events and opinions, images
                                                                         and/or videos. The reports are sometimes geo-localised.
                                                                             The second class of media is the one related to dedicated
                                                                         mobile applications. Through these applications, users receive
                                                                         higher guidance for reporting events. The reports are generally
                                                                         geo-localised and quality controlled. This result in structured
                Fig. 4. Example of a conceptual graph                    databases, potentially including free text fields.
                                                                             In both media, the language used to fill free comments
                                                                         depend on the users. Therefore, the set of soft information
   1) Information Synthesis: Information synthesis enables               items that we can gather through citizens are multilingual.
one to collect and organize information about a specific                     For our use case, we selected Twitter as a representative
subject. Through information synthesis, all the gathered in-             of the first class of media: social networks. As no dataset
formation items are organized into a network. The redundant              of tweets exist, to our knowledge, containing information
part of the information items are detected and eliminated.               and observations about jellyfish blooms, we acquired tweets
   The fusion strategies are used within information synthesis,          using several hashtags and keywords (jellyfish invasion, beach,
in order to enable the fusion of information items that are              ...) in three languages (English, French and Spanish). The
slightly different but describe the same situation of the real           dataset obtained shows both the strength and weaknesses
life. These discrepancies may appear when different sources              of using social media as an information source. The tweets
of information with potentially different levels of precision for        cover a geographically wide area, but the contents are very
instance, are used to draw a picture of an on-going situation            poor, often not delivering factual report on the situation and
(see [14]).                                                              no information is available on the quantity and species for
   2) Information Query: All the instances of information                instance. Furthermore, the quantity of Tweets acquire in this
corresponding to a specified graph pattern may be found within           way is very small. The experiments conducted on Twitter
a network of information, through the information query                  illustrated that it is possible to make use of such media when
function.                                                                and where no other sources of information are available, but
   The specialization relationship between the query and the             we need to have other sources of information, more reliable,
data graphs imply that the structure of the query graph must             detailed and widely used by citizens.
be entirely found in the data graph. The query function relies               This analysis lead us to consider adding information from
on the search for injective homomorphism between the query               the second class of media: dedicated apps. Regarding this
graph and the data graph.                                                second class, and although the specific ODYSSEA Project
   3) Information Fusion: When a model of a situation of                 App is unavailable yet, there are apps that enable citizen to
interest (e.g. an activity involving a specific person at a specific     provide information on jellyfish bloom sightings, marine litters
date) is available, one may want to monitor the situation and            and other information of interest, such as the JellyWatch App
trigger further processes if an instance of such a situation             (jellywatch.org). These organisations are better known and
is happening. Therefore, different observations, potentially             their application is more widely used. The citizens reporting
coming from different sources, are filtered out in order to keep         the events are trained and provide quantitative and qualitative
observations of interest only. They are then assembled through           information. The data acquired through these kinds of apps
information fusion in order to provide a representation of the           have the opposite characteristics from the one acquired through
ongoing situation of interest, as precise as possible.                   Twitter. Reports are factual and well completed. The geo-
   The model of situation is, within information fusion, more            localisation of the event reported is always given, but reports
generic than the observation graphs. Further more, fusion                cover only a very small geographical area, linking to the
strategies may be used, as for the Information Synthesis                 actions of NGOs for promoting the use of the app.

                                                 All rights reserved. Copyright © 2020 by ISIF
FUSION2020 Virtual conference, Pretoria, South Africa 6 - 9 July 2020
In order to use our approach on a worldwide basis, we will
need to work together with NGOs and app providers implanted
in all the communities and areas of interest around the seas.
The work presented here is a preliminary proof of concept,
taking into account a few information sources.
The InSyTo platform described above is used to analyse and
aggregate information collected from both sources. Figure 5
describes the overall information processing chain. The first
step of information acquisition is specific to each source of
information and is detailed hereafter. Once the data acquisition
step is performed however, the processing of the information
items is shared for any information source.
Fig. 6. Analysis of a batch of Soft information items with InSyTo
tweet reports about an “InvasionEvent”. If both keywords are
used, a sub-type of JellyFishEvent and InvasionEvent will be
search for in the Ontology and we will deduce that the twee
reports about a “JellyfishInvasionEvent”.
Once the typing step has occurred, concepts nodes may
be redundant in the information graph and the graph is still
unconnected as some relations were not retrieved from the
text, as said before. Thus a step of internal fusion, using
Fig. 5. Analysis of a batch of Soft information items with InSyTo
the synthesis function occurs. It enables removing redundant
information.
The information acquisition step is made of parts, as de-
Then each information graph, representing an event being
picted on Figure 6. First, the metadata of the information
reported, is fused (using the fusion function) with a model
items are extracted. As the format of the information items and
of event. This model is a graph representing the minimal
their metadata are specific to each source of information, this
ideal event report and containing not instanciated nodes. For
operation is ad-hoc. Then, to analyze the natural language parts
instance, knowing that an event takes place somewhere, at
of the information items (texts of the tweets and comments or
a specific date, the model of event will include an “Event”
descriptions boxes of the mobile app), we rely on the Named
node, connected to a “Location” and “Date” node through
Entity recognition (NER) function of Spacy [15]. Therefore,
”has for location” and “has for date” relations.
for information items containing text in a language for which
Once all this steps have been achieved, each tweet graph
Spacy has no model, we first translate them using Google
is added to the situational information network using the
Translate API [19].
synthesis function. Cues indicating the presence of jellyfish
Regarding the transformation of input soft information into
can be searched for. To do so, the query function of InSyTo
graphs, named entities are extracted by Spacy and used to build
is used. A graph (depicted on Figure 7) representing the
the concept nodes of the information graph. Other concept
following question is queried over the semantic information
nodes and relations, such as the author of the report, the date
network :
of the report, keywords etc. are extracted form the metadata.
As many relations among entities may be expressed in the text • What = Jellyfish
of the tweet but not extracted automatically, the information • Where ?
graph is unconnected and some of the concepts have generic • When ?
types, with values corresponding to the keywords. • How (many) ?
Once this information acquisition phase is performed, the The graphs answering this query represents the occurrences
main analysis is applied equally on graphs coming from any of jellyfish invasion that have been reported by citizens. The
source of information. information collected can be used to validate the drift model. It
A second step depicted on Figure 5. It consists in in- should be noted, however, that due to the temporal and spatial
terpreting the keywords into types of events that are being discontinuity the extracted features (’Location’ and ’Date’)
reported in the tweet. For this step, we rely on a keyword- need to be further aggregated into monthly averages and spatial
type of event correspondence table. For instance, the use of zones according, for example according to administrative units
the keyword #jellyfish will imply that the tweet reports about (NUTS2016), see figure 8. By comparing the number of
a “JellyfishEvent”. The use of #invasion will imply that the reported and predicted individuals within a geographic region
All rights reserved. Copyright © 2020 by ISIFFUSION2020 Virtual conference, Pretoria, South Africa 6 - 9 July 2020
JellyfishInvasion together with tweet acquisition and google translation means,
has location Location
in order to get as much information as possible from the
different available sources and applications.
As a first step of mixing the use of biophysical drift model
and soft information for jellyfish, we limited our approach to
has date Date
the validation of the drift model with the citizen data reports.
However, our aim, regarding future work is to go beyond the
validation of the model with citizen reports and initialize the
drift model thanks to inputs gathered from citizens. This is a
quantity Quantity
complex task as only jellyfish having reached their full-grown
Fig. 7. Query graph for jellyfish reports stage are usually spotted by citizens on beaches. Therefore, we
will have to disable the other stages of jellyfish development
in the drift model if it is initialized by sightings. Consequently,
for a specific month allows us to perform qualitative valida- validating this new parameterisation of the drift model will be
tion. Nevertheless, differences between the temporal coverage essential, and the loss or gain in prediction quality between
of observed and predicted jellyfish stranding remain as the the use of the full model and the use of the model reduced to
biophysical model provides predictions for the full calendar full-grown state jellyfish should be quantified.
year while observations are mainly available during summer A second track for future work, is taking advantage of the
period (peak season). uncertain information management feature provided by InSyTo
[21]. As seen before, citizens may provide data from different
InSyTo
means. Specialized applications, ensure that the citizen re-
porting information is well-intentioned and willing to provide
Q e ed Q e ed Q e ed as efficient as possible information. However, these apps are
L ca Da e Q a
not sufficiently widely used nowadays and we still lack of
input data from most of the regions of the world. On the
Aggrega ion contrary, a lot of people use their favourite social media in
order to share information with their connections. They don’t
aim at providing sound and complete observations, from a sci-
Geographic zones Quantity
(e. . NUTS2016
Weeks / Months /
f
Qualitative entific perspective. However, in places where we lack of input
Seasons comparison
ad a e ) d d a information, their inputs may be valuable. As we are fully
aware of the different levels of quality of input information
Aggrega ion acquired through these two means, we aim at defining quality
parameters and use them in order to provide jellyfish observers
with quoted information regarding the confidence we have on
P ed c ed P ed c ed P ed c ed
L ca Da e Q a
its quality.
Biophysical jelly sh
drift model
ACKNOWLEDGMENT
The research leading to these results received funding from
the European Union’s Horizon 2020 Research and Innovation
Fig. 8. Validation process using the output of InSyTo and biophysical jellyfish
drift models Program (H2020-BG-12-2016-2) under grant agreement No.
727277 - ODYSSEA (Towards an integrated Mediterranean
V. C ONCLUSION AND F UTURE WORK Sea Observing System). The article reflects only authors’ view
and that the Commission is not responsible for any use that
In this paper we presented a work that aims at using may be made of the information it contains.
both biophysical modelling and fusion of soft information for
jellyfish invasion monitoring. We first presented the jellyfish R EFERENCES
drift model that is used for jellyfish invasion forecasting.
We explained how the information of the actual presence of [1] C. Laudy, Marcin PRZYBYSZEWSKI, Anna STACHOWICZ, Fabio
RUINI, Alessandro ZANASI. Fusion 2017 Using Social Media in Crisis
jellyfish reported by citizens can be used in order to validate Management - SOTERIA Fusion Center for Managing Information
the drift model. The presented methodology aimed at enriching Gaps, FUSION 2017, July 2017, Xi’an, China
existing citizen sources datasets since the lack of coherent in- [2] Mukherjee, S. The Use of Twitter, Facebook, LinkedIn etc. as Strategic
Tools for Crisis Communication. International Journal of Management
situ observations do not permit for comprehensive quantitative and International Business Studies, 4(2), 175–180, 2014.
assessment. [3] Mergel, I. Social Media Practices in Local Emer-
To gather and aggregate all the reports of jellyfish from gency Management. Results from Central New
York. Retrieved from http://sotechem.syr.edu/wp-
citizens, we use the InSyTo platform, that provide soft in- content/uploads/2014/11/SoTechEM Executive Report-
formation fusion services. The fusion services are organised mwedit111914.pdf [sotechem.syr.edu], (2014).
All rights reserved. Copyright © 2020 by ISIFFUSION2020 Virtual conference, Pretoria, South Africa 6 - 9 July 2020
[4] Yin, J., Lampert, A., Cameron, M., Robinson, B., Power, R. Using Social
Media to Enhance Emergency Situation Awareness. IEEE Intelligent
Systems, 27(6), 52–59, 2012.
[5] Kryvasheyeu, Y., Chen, H., Obradovich, N., Moro, E., Hentenryck,
P. Van, Fowler, J., Cebrian, M. (2016). Rapid assessment of disaster
damage using social media activity. Science Advances, 2(3), 2016.
[6] Jin, Y., Liu, B. F., Austin, L. L. Examining the Role of Social Media
in Effective Crisis Management: The Effects of Crisis Origin, Informa-
tion Form, and Source on Publics’ Crisis Responses. Communication
Research, 41(1), 74–94, (2014).
[7] Abbasi, M.-A., Kumar, S., Filho, J. A. A., Liu, H. Lessons Learned
in Using Social Media for Disaster Relief - ASU Crisis Response
Game. In Proceedings of SBP12, the International Conference on
Social Computing, Behavioral-Cultural Modeling, and Prediction (pp.
282–289), (2012).
[8] Cresci, S., Cimino, A., Dell’Orletta, F., Tesconi, M. Crisis Mapping
During Natural Disasters via Text Analysis of Social Media Messages. In
Proceedings of WISE 2015, the International Conference on Web Infor-
mation Systems Engineering. http://doi.org/10.1007/978-3-319-26190-4
[doi.org], (2015).
[9] McClendon, S., Robinson, A. C. Leveraging Geospatially-Oriented
Social Media Communications in Disaster Response. In Proceedings
of the 9th International ISCRAM Conference (pp. 2–11), (2012).
[10] Chen, R., Sakamoto, Y. Perspective Matters: Sharing of Crisis In-
formation in Social Media. In Proceedings of the 2003 46th Hawaii
International Conference on System Sciences (pp. 2033–2041). Ieee.
http://doi.org/10.1109/HICSS.2013.447 [doi.org], (2013)
[11] Olteanu, A., Vieweg, S., Castillo, C. What to Expect When the Un-
expected Happens: Social Media Communications Across Crises. In
Proceedings of CSCW ’15, the 18th ACM Conference on Computer-
Supported Cooperative Work and Social Computing, (2015).
[12] Sowa, J-F. Conceptual Structures. Information Processing in Mind and
Machine. Addison-Wesley, Reading, MA. 1984.
[13] Chein, M., Mugnier, M.-L. Graph-based Knowledge Representation:
Computational Foundations of Conceptual Graphs. Springer. 2008.
[14] Laudy C. Semantic Knowledge Representations for Soft Data Fusion
— Efficient Decision Support Systems - Practice and Challenges From
Current to Future. Chiang Jao Publisher. 2011.
[15] Honnibal, M., Montani, I. spaCy 2: Natural language understanding
with Bloom embeddings, convolutional neural networks and incremental
parsing. To appear.
[16] Dagestad, K.-F., Röhrs, J., Breivik, Ø., Ådlandsvik, B. (2018). OpenDrift
v1.0: a generic framework for trajectory modelling. Geosci. Model Dev,
11, 1405–1420. https://doi.org/10.5194/gmd-11-1405-2018
[17] El Rahi, J., Jellyfish Modelling in the Spanish Coastal Waters: Life
Cycle, Transport and Stranding of Pelagia noctiluca. Master Thesis,
Deltares, Delft. 2019.
[18] C. Laudy, Rumors detection on Social Media during Crisis Management,
ISCRAM 2017, May 2017, Albi, France
[19] https://cloud.google.com/translate/docs/apis
[20] https://github.com/explosion/spaCy/releases/tag/v2.2.4
[21] S. Fossier, C. Laudy, F. Pichon. Managing uncertainty in conceptual
graph-based soft information fusion. FUSION 2013: 930-937
All rights reserved. Copyright © 2020 by ISIFYou can also read