MIZORAM - KALADAN RIVER, MIZORAM March 2021 For updated information, please visit www.ibef.org - IBEF Presentation

 
CONTINUE READING
MIZORAM - KALADAN RIVER, MIZORAM March 2021 For updated information, please visit www.ibef.org - IBEF Presentation
MIZORAM

                   KALADAN RIVER, MIZORAM
                                            March 2021
          For updated information, please visit www.ibef.org
MIZORAM - KALADAN RIVER, MIZORAM March 2021 For updated information, please visit www.ibef.org - IBEF Presentation
Table of Contents

        Executive Summary           3

        Introduction                4

        Economic Snapshot           9

        Physical Infrastructure     15

        Social Infrastructure       22

        Industrial Infrastructure   25

        Key Sectors                 28

        Key Procedures & Policies   33

        Appendix                    38

 2
MIZORAM - KALADAN RIVER, MIZORAM March 2021 For updated information, please visit www.ibef.org - IBEF Presentation
Executive summary

                     Strong bamboo processing sector
      1                  •   In Mizoram, ~85.41% of the total geographical area is covered by forests, of which Bamboo forests cover 3,267 sq.
                             kms. There is an estimated growing stock of 25.26 million metric tonnes of 35 varieties of bamboo in the state.

                     Sericulture
      2                  •   Raw silk production in Mizoram stood at 104 metric tonnes in 2019-20.

                     Scope for fisheries^
      3                  •   Mizoram has 24,000 hectares of area that could be utilised for fish farming. Of this, just 5,477 hectares have been
                             developed as ponds and tanks until 2018-19. The state’s fish production stood at 7,230 MT in 2019.

                      Large hydroelectric power potential
      4                  •   Mizoram has the potential to generate 4,500 megawatt (MW) of hydro power.

 Source: Mizoram Economic Survey 2017-18, Central Electricity Authority, Ministry of Textiles

 3
MIZORAM - KALADAN RIVER, MIZORAM March 2021 For updated information, please visit www.ibef.org - IBEF Presentation
INTRODUCTION

4
MIZORAM - KALADAN RIVER, MIZORAM March 2021 For updated information, please visit www.ibef.org - IBEF Presentation
Mizoram Fact File

                                                             Aizawl
                                                               Capital              52 persons per sq km                     1.18 million
                                                                                       population density                   total population

                                                      21,081 sq.km.
                                                        Geographical area                  0.54 million                  0.55 million
                                                                                         female population              male population

                                                                                                                                976
                                                                                                                              Sex ratio
                                                             91.33%               Administrative districts:   8      (females per 1,000 males)
                                                            Literacy rate
     Key Insights

     • Mizoram shares borders with other north-eastern states of Manipur, Tripura and Assam and neighbouring countries of Bangladesh & Myanmar.
     • The most spoken languages of the state are Mizo & English, apart from the various local dialects.
     • Kolasib, Vairengte, Bairabi, Saiha, Champhai & Sairang are the key cities in the state.
     • Mizoram has primarily sand-loamy & clay-loamy soil with deposits of shell limestone, coloured hard stone, clay mineral, coal seam, oil & gas.

 Source: Economic Survey 2017-18, Census 2011

 5
MIZORAM - KALADAN RIVER, MIZORAM March 2021 For updated information, please visit www.ibef.org - IBEF Presentation
Advantage: Mizoram

          Abundant natural resources                       Rich labour pool & infrastructure
                                                           support
        Bamboo forests cover 3,267 square
         kilometre of Mizoram’s geographical area          With a literacy rate of 91.33%, Mizoram offers a highly
         and contribute 14% to the country’s bamboo         literate workforce. Knowledge of English is an added
         production.                                        advantage for the Mizo workforce.
        The climatic conditions in the state provide a    With improving road, rail & air connectivity & the
         breeding ground for commercial exploitation        establishment of trade routes with neighbouring countries,
         of all kinds of silkworm.                          trade facilitation has improved over the last decade.

     High economic
     Growth supported by
     constructive policies
   The Gross State Domestic
                                                                                       Location advantage
    Product (GSDP) at current prices                                                   and trade opportunities
    increased at a 15.03% CAGR (in                                                      Industries in the state enjoy a
    Rs.) between FY16 and FY20.                                                          unique location-specific advantage.
   The state provides a wide variety                                                    Bordering Myanmar & Bangladesh,
    of incentives under its various                                                      Mizoram offers a gateway for
    policies.                                                                            engaging in international trade with
                                                                                         Southeast Asian countries.
   Special incentives for promotion
    of export-oriented industries and                                                   Government is taking steps to
    other thrust sectors are also                                                        boost palm oil cultivation in the
    provided.                                                                            state.

 Source: Economic Survey 2019-20, Census 2011

 6
MIZORAM - KALADAN RIVER, MIZORAM March 2021 For updated information, please visit www.ibef.org - IBEF Presentation
Mizoram in figures

     Mizoram’s Contribution to Indian Economy (2019-20)                                       Physical Infrastructure in Mizoram

 GSDP
          GSDP as a percentage of all states’ GSDP                                                   Installed power capacity (MW) (as of February
           India: 100.00 | Mizoram: 0.10
                                                                                                     2021)
                                                                                                     India: 379,130.41 | Mizoram : 207.45
          GSDP growth rate (%)
          India: 7.2 | Mizoram : 19.85
                                                                                                     Wireless subscribers (million) (as of January 2021)
          Per capita GSDP (US$)                                                                      India: 1,163.40 | Mizoram^: 12.29
          India: 2,015.53| Mizoram : 2,252.03
                                                                                                      Internet subscribers (million) (as of September 2020)
     Social Indicators                                                                                India: 776.45 | Mizoram^: 8.47

           Literacy rate (%)                                                                         National highway length (km) (as of September 2019)
           India: 73.0 | Mizoram : 91.33                                                             India: 132,499 | Mizoram : : 1,423
           Birth rate (per 1,000 population) (2018)                                                   Airport (No.)
           India: 20.0| Mizoram : 14.8
                                                                                                      India: 153 | Mizoram :1

 Note: ^- Combined figures for the Northeast states comprising Arunachal Pradesh, Manipur, Meghalaya, Mizoram, Nagaland and Tripura

 7
MIZORAM - KALADAN RIVER, MIZORAM March 2021 For updated information, please visit www.ibef.org - IBEF Presentation
State vision

             1 QUALITY OF LIFE OF PEOPLE                                          8 GROWTH RATE IN GSDP
              Improving standard of living of people                              Government plans to grow GSDP by
               in the region to meet the national                                   12.8% and per capita GSDP by
               standard by 2020.                                                    10.1% over the period 2015-2022.
              Improving the quality and creating

                                                               1          8
               state-of-art hospitals and educational
               institutions.

 2 PROMOTING INVESTMENTS                                                                      7 GOVERNANCE
  Encouraging public investment in                                                            Better governance and ensuring
                                                                                                peace and harmony through

                                                       2                            7
   infrastructure to attract private
   investment.                                                                                  maximising self-governance and
                                                                                                increased people participation.
  Creating a centre for trade and
   commerce        through     improving
   relations with neighbouring countries.

 3 AGRICULTURE
                                                                                              6 INDUSTRY
  Encouraging           HYV       crops
   through better use of organic manure,               3                            6          Development of agro-processing and
                                                                                                sericulture industries.
   fertilizers and pesticides.
  Preventing soil erosion by controlling                                                      Increase       in     investment   in
   floods.                                                                                      manufacturing units depending upon
                                                                                                the availability of resources in the

                                                               4          5
  Promoting cultivation of horticulture
                                                                                                region.
   crops.
                          4 INFRASTRUCTURE
                           NER Vision 2020 recognises the challenges         5 TOURISM
                            faced by power sector in Mizoram. Objective        Focusing and developing services that
                            of the vision is to upgrade and expand the          would promote tourism and create
                            power transmission network in the state.            employment opportunities in the state.

 Source: NER Vision 2030; HYV: High Yielding Variety

 8
MIZORAM - KALADAN RIVER, MIZORAM March 2021 For updated information, please visit www.ibef.org - IBEF Presentation
ECONOMIC SNAPSHOT

9
MIZORAM - KALADAN RIVER, MIZORAM March 2021 For updated information, please visit www.ibef.org - IBEF Presentation
Economic snapshot – GSDP

                              GSDP of Mizoram at current prices                                                                    Per Capita GSDP of Mizoram at current prices

       4                            CAGR (in Rs.) 15.03%                                                            300    3,500                                                                         240000
                                                                                                                                                   CAGR (in Rs.) 14.90%
       4

                                                                                                 3.76
                                                                                                                           3,000                                                                         210000

                                                                                                                                                                                               221,380
                                                                                                                    250

                                                                                                                                                                                             3,122.87
                                                                                                           265.03
       3                                                                                                                                                                                                 180000

                                                                              3.19

                                                                                                                                                                                   187,921
                                                                                                                           2,500

                                                                                                                                                                                  2,688.81
                                                       3.01

                                                                                        222.87
                                                                                                                    200

                                                                                                                                                                  2,559.84
       3                                                                                                                                                                                                 150000

                                                                                                                                                                 164,982
                                                                 193.85
                                    2.56

                                                                                                                           2,000

                                                                                                                                                     2,110.80
                                                                                                                                                     141,614
                 2.31

                                              171.92

       2                                                                                                            150                                                                                  120000

                                                                                                                                        1,940.17
                                                                                                                                        127,004
                           151.39

                                                                                                                           1,500
       2                                                                                                                                                                                                 90000
                                                                                                                    100
                                                                                                                           1,000
       1                                                                                                                                                                                                 60000
                                                                                                                    50      500
       1                                                                                                                                                                                                 30000
       0                                                                                                            0         0                                                                          0
                                    2016-17

                                                       2017-18

                                                                              2018-19

                                                                                                 2019-20

                                                                                                                                                                                  2018-19

                                                                                                                                                                                             2019-20
                                                                                                                                                                 2017 -18
                 2015-16

                                                                                                                                        2015-16

                                                                                                                                                     2016-17
                                              US$ billion             Rs. billion                                                                               US$         Rs.

       At current prices, the Gross State Domestic Product (GSDP) of
                                                                                                                           The state’s per capita GSDP in 2019-20 was Rs. 221,380 (US$
           Mizoram reached Rs. 265.03 billion (US$ 3.61 billion) in 2019-20.
                                                                                                                            3015.37).

       The state’s GSDP (in Rs.) increased at a CAGR of 15.03%
                                                                                                                           The per capita GSDP (in Rs.) increased at a CAGR of 14.90%
           between 2015-16 and 2019-20.
                                                                                                                            between 2015-16 and 2019-20.

 Note: exchange rates used are averages of each year, P- Provisional, E- Estimate, AE- Advance Estimate
 Source: Ministry of Statistics and Programme Implementation

 10
Economic snapshot – NSDP

                             NSDP of Mizoram at current prices                                                                     Per Capita NSDP of Mizoram at current prices

       4                            CAGR (in Rs.) 15.67%                                                            250    3,500                                                                     240000
                                                                                                                                                  CAGR (in Rs.) 8.60%

                                                                                                           237.56
       4                                                                                                                   3,000                                                                     210000
                                                                                                                    200

                                                                                                                                                                                           204,018
                                                                                                 3.37

                                                                                                                                                                                          2,894.28
                                                                                        204.32
       3                                                                                                                                                                                             180000
                                                                                                                           2,500

                                                                                                                                                                                176,620
                                                                              2.92

                                                                                                                                                                               2,527.11
                                                                 176.61
       3                                                                                                                                                                                             150000

                                                                                                                                                                2,408.41
                                                       2.74
                                                                                                                    150

                                                                                                                                                               155,222
                                                                                                                           2,000
                                              149.28

       2                                                                                                                                                                                             120000
                                    2.23

                                                                                                                                                   1,894.58
                                                                                                                                                   127,107
                           132.71
                 2.03

                                                                                                                                       1,742.36
                                                                                                                           1,500

                                                                                                                                       114,055
       2                                                                                                            100                                                                              90000
                                                                                                                           1,000
       1                                                                                                                                                                                             60000
                                                                                                                    50
       1                                                                                                                    500                                                                      30000

       0                                                                                                            0         0                                                                      0

                                                                                                                                                   2016-17

                                                                                                                                                               2017-18

                                                                                                                                                                               2018-19

                                                                                                                                                                                          2019-20
                                    2016-17

                                                       2017-18

                                                                              2018-19

                                                                                                 2019-20

                                                                                                                                       2015-16
                 2015-16

                                              US$ billion             Rs. billion                                                                             US$        Rs.

       At current prices, the Net State Domestic Product of Mizoram                                                       The state’s per capita NSDP in 2019-20 was Rs. 204,018 (US$
           reached Rs. 237.56 billion (US$ 3.37 billion) in 2019-20.                                                        2,894.28).

       The state’s NSDP (in Rs.) increased at a CAGR of 15.67%                                                            The per capita GSDP (in Rs.) increased at a CAGR of 15.65%
           between 2015-16 and 2019-20.                                                                                     between 2015-16 and 2019-20.

 Note: exchange rates used are averages of each year
 Source: Ministry of Statistics and Programme Implementation

 11
Economic snapshot – Percentage distribution of GSVA

   With a CAGR (in Rs.) of 20.70% between 2011-12 and 2019-20, the           GSVA composition by sector at current prices
      primary sector was the fastest-growing sector and contributed
      26.95% to Mizoram’s Gross Service Value Added (GSVA) in 2019-        100%
                                                                                        59.43%        CAGR*        43.28%
      20. The growth was driven by the agriculture, fishing and forestry
                                                                           90%
      industries.
                                                                           80%                       12.31%

   The tertiary sector contributed 43.28% to Mizoram’s GSVA in 2019-
                                                                           70%
      20 and increased at a 12.31% CAGR between 2011-12 and 2019-20.
                                                                           60%
   The secondary sector increased at a 22.99% CAGR during the same
                                                                           50%
                                                                                                                   29.77%
      period and contributed 23.80% to the state’s GSVA.
                                                                           40%
                                                                                        19.78%       22.99%
                                                                           30%
                                                                                                                   26.95%
                                                                           20%
                                                                                        20.80%
                                                                           10%
                                                                                                     20.70%

                                                                            0%
                                                                                        2011-12                    2019-20

                                                                                         Primary   Secondary   Tertiary

 Source: Ministry of Statistics and Programme Implementation

 12
Economic snapshot – FDI inflow & investments

   According to the Department for Promotion of Industry and Internal                  FDI Inflow Visakhapatnam
                                                                                                   in Mizoram* April
                                                                                                                  port
                                                                                                                     2000-September
                                                                                                                       traffic (million 2019
                                                                                                                                        tonnes)
                                                                                                                                             (US$ million)
      Trade (DPIIT), FDI inflows to the Northeast states totalled to US$                                                                                                  6
                                                                                                                                                                                 122
      122 million from April 2000 to September 2019.                                     120                                                                        7

   The state Government signed investment pacts worth Rs. 2,100                         110                                                                13
      crore (US$ 325.83 million) during Mizoram Magnetic Investors
                                                                                         100                                                          2
      Summit held in April 2018.
                                                                                                                                              10
                                                                                          90
                                                                                                                                       5
                                                                                                                          5     1
                                                                                          80
                                                                                                                  1
                                                                                                           8
                                                                                          70
                                                                                                64
                                                                                          60

                                                                                          50

                                                                                          40

                                                                                                           FY11

                                                                                                                  FY12

                                                                                                                         FY13

                                                                                                                                FY14

                                                                                                                                       FY15

                                                                                                                                              FY16

                                                                                                                                                     FY17

                                                                                                                                                            FY18

                                                                                                                                                                   FY19

                                                                                                                                                                          FY20
                                                                                                FY 01-10

                                                                                                                                                                                 FY01-20
 Note: * - Including Assam, Arunachal Pradesh, Manipur, Mizoram, Nagaland and Tripura
 Source: Department for Promotion of Industry and Internal Trade

 13
Economic snapshot – Export

             Merchandise Export from Mizoram (US$ million)                         Composition of Key Items Exported from Mizoram (FY21*)

      1.60

      1.40
                             1.44                                                                                 0.7%
                                                  1.33
      1.20

      1.00                                 1.07                                                        36.4%

      0.80                                                                                                                         62.9%
                                                         0.58
      0.60

      0.40                                                         0.45

      0.20     0.28
                                    0.03
      0.00
               FY15          FY16   FY17   FY18   FY19   FY20     FY21*                 Hand Tool, Cutting Tool of Metals   Marine Products   Fresh Fruits

  In FY21*, the total merchandise exports from the state stood at US$ 0.45 million.

  Mizoram exports key items such as hand tools, metal cutting tools, marine products and fresh fruits.

  In FY21*, the total exports of hand tools and metal cutting tools stood at US$ 0.19 million (62.9%).

 Note: *till February 2021
 Source: DGCIS Analytics

 14
PHYSICAL INFRASTRUCTURE

15
Physical infrastructure – Roads
   The state had a road network of 8,918.74 km during 2018-19.
    Mizoram had 1414.32 km of national highways in FY20.
                                                                                           Road Network in Mizoram (2019-20)
   The road density in the state was measured at 42.30 km per 100
    square km during 2018-19.
                                                                                           Road Class                          Total Length (km)
   The state is well connected through national highways (NH) - NH-
    44A, NH-54, NH-54A, NH-54B, NH-150, NH-154 and NH-502A - to                            National Highways                       1,414.32
    neighbouring states.
                                                                                           State Highways                            170
   The key agencies that maintain roads in the state include the Public
    Works Department (PWD) & Pushpak (Border Roads Organisation).                          District Roads                           1,410.2

   New roads are being constructed under the Look East Policy, across
    southern part of Mizoram, for linking the state with the neighbouring
    countries for enhancing the exchange of goods, access to social &
    economic development, etc.

   In State Budget 2021-22, the government has proposed to allocate
    Rs. 46,664.90 lakh (US$ 63.64 million) for the development of roads
    and bridges.

 Source: National Highways Authority of India, Mizoram Economic Survey 2019-20, Mizoram State Budget 2021-21
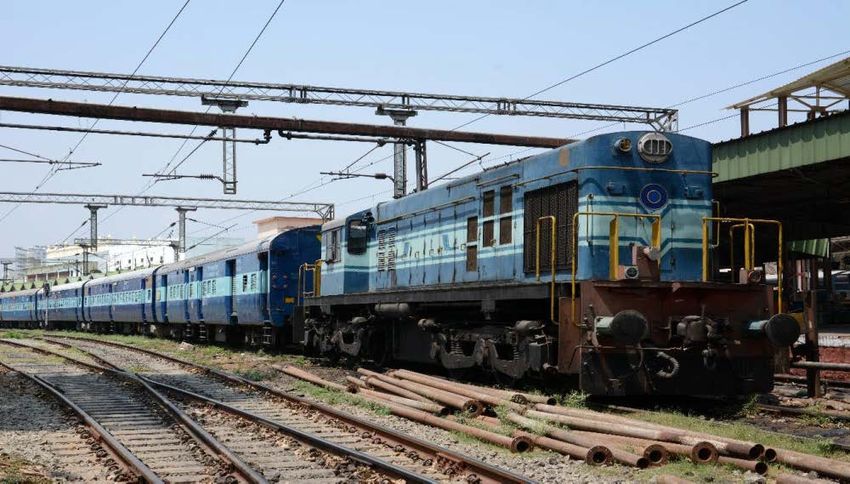
 16
Physical infrastructure – Railways

   The Bairabi railway station provides railway connectivity with Silchar
    in Assam. The state’s capital Aizwal is expected to get rail
    connectivity by 2022.

   The construction of the extension of a vital broad gauge rail link
    between Bairabi rail terminus on the Mizoram-Assam border and
    Sairang, a village 20 km west of Aizawl, is in progress. The land
    acquisition on the US$ 394.8 million Bairabi-Sairang railway project
    has been cleared. The deadline for completion of the project is 2020.

   Bhairabi-Sairang route is planned to be commissioned in 2018-19.
    Mizoram will get connected with the main rail lines through 52 Km
    Sairang - Bhairabi rail line, crossing through 23 tunnels, 36 major
    and 147 minor bridges.

   The Prime Minister’s Project Monitoring Group has cleared the US$
    729.7 million Lumding-Silchar (482 km) gauge conversion project
    aimed at providing seamless connectivity to lower Assam and
    Tripura, Mizoram and Manipur with the rest of India.

   The capitals of North-eastern states to be connected by broad gauge
    rail network and be completed by 2022.

   In November 2020, Hindustan Construction Company (HCC), in a
                                                                              Railway station, Bairabi
    joint venture with Vensar Constructions Company (VCCL), won two
    projects totalling to Rs. 236 crore (32.32 million) in Mizoram from the
    Northeast Frontier Railway.

 Source: Mizoram Economic Survey, Maps of India, News Article

 17
Physical infrastructure – Airports and Waterways

    Mizoram has one operational airport at Lengpui. Daily air
      connectivity is available through multiple air carriers.

    All eight district capitals are now connected by the state
                                                                                                      Airport, Lengpui
      government’s helicopter service which connects at least two
      destinations in a day.

    Mizoram is developing waterway connectivity with the port of Akyab
      Sittwe in Myanmar along the Chhimtuipui river for enhancing trade
      opportunities. The project is expected to be completed by 2020.

    From April 2020 to February 2021, Lengpui (Aizawl) Airport in
      Mizoram recorded 342 metric tonnes in freight, along with 62,362
      passengers and 1,033 aircraft movements.

    Under the State Budget 2021-22, Rs. 382.40 lakh (US$ 521,439.11)                     Lengpui (Aizawl) airport traffic
      has been allocated to the civil aviation sector.
                                                                                                                             2019-20    2020-21*

                                                                                           Aircraft movement (no.)            2,320      1,033

                                                                                           Passenger traffic (no.)           2,06,647   62,362

                                                                                           Freight (metric tonnes)             413        342

  Note: *till February 2021
 Source: Mizoram Economic Survey 2019-20, Airports Authority of India, Mizoram State Budget 2020-21

 18
Physical infrastructure – Power

                            Installed power capacity (MW)                            Break-up of Installed Capacity by Source (FY21*)

        250

        200                                                                                          18%

                                                             207.44

                                                                      207.45
                                                    206.42
                                           192.02
        150
                                                                                                                            Hydropower
                                136.90

                                                                                                                   47%
                   121.80

        100                                                                                                                 Thermal Power
                                                                                                                            Renewable Power
         50
                                                                                                 35%

           0
                   FY16

                                FY17

                                           FY18

                                                    FY19

                                                             FY20

                                                                      FY21*
    As of February 2021, Mizoram had a total installed power-generation capacity of 207.45 MW, comprising hydro (97.94 MW), thermal (71.51 MW)
     and renewable energy sources (38.00 MW).

    Energy requirement in state was 536 million units (MU) in 2019-20.

    The state has the potential to harness 4,500 MW of hydro power.

    By 2021, Mizoram Government plans to construct four solar plants and a solar park to generate 80 MW solar power.

    On December 5, 2020, Mizoram’s first solar power plant was commissioned at Tlungvel with a capacity of 2 MW.

    Under the State Budget 2021-22, Rs. 69,740.29 lakh (US$ 95.11 million) has been allocated to the energy sector.

 Note: MW- Megawatt, *till February 2021
 Source: Central Electricity Authority

 19
Physical infrastructure – Telecom

         Telecom Infrastructure (as of January 2021)

                                    1
        Wireless subscribers (million)                        12.29

                                1
                                                                                                            Performance of Bharat Net
        Wireline subscribers                                 99,275
                                                                                                           Service-ready GPs (as of November
                                1                                                                                                                        241
        Internet subscribers (million) (as of                                                              2020)
                                                               8.47
        September 2020)

                      1
        Teledensity (%)                                       80.18

   According to the Telecom Regulatory Authority of India (TRAI), Mizoram1 had 12.29 million wireless and 99,275 wireline subscribers, as of January
      2021.

   The number of internet subscribers in Mizoram1 stood at 8.47 million, as of September 2020.

   Mizoram1 had a total teledensity of 80.18%, as of January 2021.

   By January 2021, 1.53 million subscribers had submitted requests for mobile number portability in the region1.

   As of January 2021, Bharti Airtel had the largest wireless subscriber base in the region1.

 Note: 1 - Combined figures for Northeast states comprising Arunachal Pradesh, Manipur, Meghalaya, Mizoram, Nagaland and Tripura, GP - Gram Panchayatt
 Source: Telecom Regulatory Authority of India

 20
Physical infrastructure – Urban

    The state Government has created Urban Development and &                              Atal Mission for Rejuvenation and Urban Transformation up to
                                                                                           January 2019
      Poverty Alleviation Department to implement various schemes for
      housing, urban development and reduction of poverty.
                                                                                           Allocation                                                 US$ million

    Under the State Budget 2021-22, Rs. 32,260.69 lakh (US$ 43.97
                                                                                           Total allocation for projects (including
                                                                                                                                                             19.44
      million) has been allocated for urban development.                                   State share)

                                                                                           Committed Central Assistance                                      17.49
    Aizawl has been selected under Atal Mission for Rejuvenation and
      Urban Transformation (AMRUT) for which Rs. 140.25 crore (US$                         Sanctioned Central Assistance                                     11.17
      19.44 million) has been allocated to Mizoram as of January 2019.

    Aizawl has also been selected under the Smart Cities Mission of
      Government of India. Up to July 2018, Rs. 55 crore (US$ 8.2 million)
      has been released to the state for the mission.

 Source: JNNURM, Ministry of Urban Development, Government of India, Ministry of Development of North Eastern Region (DoNER), Mizoram State Budget 2021-22

 21
SOCIAL INFRASTRUCTURE

22
Social infrastructure – Education

       AICTE Approved Education Statistics (2020-21)

                                   Undergraduate                   Postgraduate         Diploma

       Total
                                             2                             3               3
       Institutions

       Girl's Enrolment                     21                             27             72

       Boy's
                                            69                             32             123
       Enrolment

   Mizoram is among the top-ranking states in the country in terms of literacy rate. Mizoram has a literacy rate of 91.33%; the male literacy rate is
      93.34% and the female literacy rate is 89.26%. Gross Enrolment Ratio at the primary & middle-school level has been high, indicating low number
      of students dropping out.

   Under the State Budget 2021-22, the government has allocated Rs. 182,790.91 lakh (US$ 249.16 million) to the education, sports and art &
      culture sectors.

   In 2019-20, Mizoram had 2 undergraduate, 3 postgraduate and 3 diploma courses in AICTE-approved institutes.

 Source: Mizoram Economic Survey 2019-20, AISHE 2018-19, Mizoram State Budget 2021-22

 23
Social infrastructure – Health

                                                                                          Health Infrastructure (As of May 2020)
        Government and non-
         government hospitals(Data as                 31                                 Sub-centres                                        521
         of March 2018)
                                                                                         Primary health centres                             76
        Nurse-population ratio(Data as
                                                    1:666
         of March 2018)                                                                  Community health centres                           10

        Health worker-population                                                         Sub-district hospital                              26
                                                    1:590
         ratio(Data as of March 2018)
                                                                                         District Hospitals                                 11

   The Government has established a medical college at the Falkwan Referral Hospital in Mizoram. The state Government has initiated Vanaspati
    Van project to enhance availability of herbal medicines to the rural population. The Mizoram Institute of Medical Education and Research (MIMER)
    is waiting for approval from the Medical Council of India.

   As of May 2020, the state has 76 sub centres, 521 primary health centres, 10 community health centres, 26 sub-district hospitals and 11 district
    hospitals.

   The state government has allotted Rs. 59,597.36 lakh (US$ 81.23 million) for health & family welfare under its annual budget 2021-22.

   Under the Ministry of Ayurveda, Yoga and Naturopathy, Unani, Siddha and Homoeopathy (AYUSH), the state Government has decided to provide
    the rural poor of Mizoram with free medicines.

 Source: NHRM, SRS Bulletin 2017, Mizoram State Budget 2021-22

 24
INDUSTRIAL INFRASTRUCTURE

25
Industrial infrastructure … (1/2)

   Mizoram has eight industrial estates, of which five are operational                    State enterprises for development of various trades

      and the remaining are yet to be developed.                                            Mizoram Agriculture Marketing Corporation

                                                                                            Mizoram Food and Allied Industries Corporation
   Zoram Industrial Development Corporation (ZIDCO) is responsible
                                                                                            Mizoram Khadi and Village Industries Board
      for the overall development of industrial infrastructure in the state.
                                                                                            Zoram Energy Development Agency
   The handicraft production centre at Luangmual manufactures items                        Zoram Handloom & Handicrafts Development Corporation
      of Mizo crafts like - Khumbeu, Thulte, Thlangra, Hnam, etc. and
                                                                                            Zoram Industrial Development Corporation
      promotes the crafts of the state.

   Thenzawl has been named as a Handloom City, stepping up the
      impetus for handloom textiles in the state.

   Under its annual budget 2021-22, the state government has allocated
      Rs. 9,019.55 lakh (US$ 12.29 million) to the industry and minerals
      sectors.

 Source: Mizoram Economic Survey, 2015-16, Statistical Handbook of Mizoram 2010, NEDFi Databank; SSI: Small Scale Industry, Mizoram State Budget 2020-21

 26
Industrial infrastructure … (2/2)

   The following table shows different industrial areas and their respective status.

  Parameters                                Total area (in bighas)     Present status

  Industrial estate, Zuangtui                       314.70             Out of 231 demarcated, 211 plots are allotted to 165 industrial units.

                                                                       Allotment process is yet started and 68 units are now given provisional
  Industrial growth centre, Luangmual               766.42
                                                                       allotments and expected to accommodate many more enterprises.

  Industrial estate, Bairabi                         26.20             Yet to be developed.

  Industrial estate, Kolasib                         32.33             Yet to be developed.

  Industrial estate, Pukpui                          76.68             Demarcation of plot completed, and allotment is given to 2 units.

  Industrial estate, Hmunhmeltha                    104.40             Yet to be developed.

  Bamboo Technology Park, Sairang                   130.13             Out of 10 plots demarcated 3 plots have been alloted.

                                                                       32 plots were developed and allotted to entrepreneurs; 14 units are now in
  Export Promotion Industrial Park at
                                                   1,390.22            operation. Up-gradation of the Park is being done and expected to accommodate
  Lengte
                                                                       some more small enterprises.

 Source: Mizoram Economic Survey 2019-20

 27
KEY SECTORS

28
Key sector – Bamboo based industries

   Bamboo forests cover 3,267 square kilometre of Mizoram’s                                Bamboo Resources in Mizoram (ISFR 2019)

      geographical area. There is an estimated growing stock of 25.26                                   Parameter                                 Statistics
      million metric tonnes of 35 varieties of bamboo in the state.
                                                                                            Bamboo Bearing Area (sq. kms.)                           3,467

   The National Bamboo Mission (NBM), a centrally sponsored                                Dense Bamboo Area (sq. kms.)                             1,383

      scheme, envisages to increase the coverage area under bamboo                          Scattered Bamboo Area (sq. kms.)                         6,862
      plantation & consequently increase the yield to 18-20 tonnes per
                                                                                            Green Culms (million)                                    863
      hectare from the current 3 tonnes.
                                                                                            Dry Culms                                                134

   In FY21, the annual allocation in Mizoram to implement the ‘National
      Bamboo Mission’ stood at Rs. 70 million (US$ 0.95 million).
                                                                                           Initiatives taken by the Mizoram Government
                                                                                              Establishment of nine bamboo chipping clusters.
                                                                                              Production of bamboo construction materials.
                                                                                              Revival of Mizoram Venus Bamboo.
                                                                                              Establishment of three round agarbati stick making units.
                                                                                              Project square agarbati sticks for jail inmates.
                                                                                              Establishment of two units of bamboo sliver and one mat making unit at
                                                                                               Darlak and Bairabi, respectively.
                                                                                              Establishment of bamboo pebble unit at E. Phaileng.
                                                                                              Establishment of bamboo charcoal and bamboo vinegar unit.

 Source: Mizoram Economic Survey 2017-18, Bamboo Development Agency, Ministry of Agriculture, Indian State of Forests Report 2019

 29
Key sector – Textiles and Handlooms

   Factors such as good climatic conditions, fertility of the soil and                                  Raw Silk production (in metric tonnes)
      rainfall help in the breeding of all kinds of silkworms in Mizoram. All
      varieties of silk, including mulberry, eri, muga, tasar and raw silk, are                 120

      commercially exploited in the state. Raw silk production in Mizoram                       100
                                                                                                                                                        104.00
      stood at 104 metric tonnes in FY20.                                                                                                   92.00
                                                                                                 80
                                                                                                                                  83.60
                                                                                                                     76.00
   The state Government is working towards bringing maximum families                            60
                                                                                                        64.00
      under sericulture farming and silkworm rearing. The Government of                          40
      Mizoram has opened one research & training institute at Aizawl
                                                                                                 20
      (Zemabawk) which provides training and certification courses in
                                                                                                  0
      Sericulture.
                                                                                                         FY16        FY17         FY18      FY19        FY20

   Ethnic handloom and crafts of Mizoram have a large market in India
      and abroad. Bamboo crafts and the ready-to-wear ethnic clothing are
      being marketed by the Government agencies. The Mizoram                                    In the state budget 2021-22, Rs. 2,003.50 lakh (US$ 2.73 million)
      Government is expanding the business by involving private players in                       has been allotted for sericulture.
      manufacturing, marketing and distribution of handloom and crafts of
      Mizoram.

 Note: P - Provisional, *- till December 2019
 Source: Mizoram Economic Survey 2019-20, Ministry of Textiles, Mizoram State Budget 2021-22

 30
Key sector – Agriculture and Allied industries

   Approximately 60% of workers in Mizoram are engaged in                                   Area and production of horticulture crops (2019-20)
      agriculture & allied sectors. Paddy is the principal food crop & the
      staple food in Mizoram. The state has high potential in processing of                                                         Area      Production
                                                                                                   Year
      spices such as chilli, ginger and turmeric and palm oil related                                                             (‘000 Ha)    (‘000 MT)
      products. Mizoram accounts for about 13.2% of the total fruits
                                                                                                   Fruits                           63.77          344.91
      produced in the Northeast.

                                                                                                Vegetables                          36.49          181.70
   Total horticulture production in Mizoram was 638.95 thousand metric
      tonnes as per 3rd advance estimates 2019-20. In FY20, the state                              Spices                           28.22          101.49
      produced 344.91 thousand tonnes of fruits under an area of 63.77
                                                                                                 Plantation
                                                                                                                                    12.08           8.35
      thousand hectares. Similarly, 101.49 thousand tonnes of spices were                          Crops
      produced in the state under an area of 28.22 thousand hectares in                            Honey                              -             0.20
      FY20.
                                                                                                   Total                           141.45          638.95
   In July 2020, Zoram Mega Food Park Ltd. was inaugurated at
      Kolasib in Mizoram to benefit >25,000 farmers and provide
      employment opportunities to >5,000 people in the region.

   The state government has allotted Rs. 86,550.07 lakh (US$ 117.95
      million) for agriculture & allied activities under its annual budget
      2021-22.

 Source: Mizoram Economic Survey 2019-20, Department of Agriculture and farmers Welfare, Ministry of Food Processing Industries

 31
Key sector – Tourism

   With its highly green hills, crisscrossing rivers, and interspersed                    Total tourist arrivals in Mizoram
      lakes, Mizoram is a tourist’s paradise. Under the Swadesh Darshan
                                                                                 200,000
      scheme, North East India circuit and eco circuit are being developed                                                      2,249

      in Mizoram.                                                                150,000                                       163,762

                                                                                 100,000
   The state also organises three festivals - Chapchar Kut in March,                        1,155               967

                                                                                  50,000                        76,551
      Anthurium Festival in September and Thalfavang Kut in November-                       67,772

      December, in order to attract more tourists to the state.
                                                                                      -
                                                                                             2017               2018            2019
   In 2019, foreign tourist arrivals and domestic tourist visits in the state
                                                                                                     Domestic     Foreign
      stood at 2,249 and 1,53,762, respectively.

   In August 2020, the Union Minister of State for Tourism Mr. Prahlad
      Singh Patel inaugurated the ‘Thenzawl Golf Resort’ project in
      Mizoram under the Swadesh Darshan Scheme.

   The state government has allotted Rs. 1,089.78 lakh (US$ 1.48
      million) to the tourism sector under its annual budget 2021-22.

 Note: P - Provisional
 Source: Mizoram Economic Survey 2017-18, News articles, Ministry of Tourism

 32
KEY PROCEDURES AND POLICIES

33
Key approvals required

            List of approvals and clearances required              Departments to be consulted

                                    Incorporation of company              Registrar of Companies

         Registration, Industrial Entrepreneurs Memorandum,
                industrial licences / Permission for land use /
                                             Allotment of land            Department of Industries

        Site environmental approval / No-objection Certificate
           and consent under Water and Pollution Control Act          Mizoram Pollution Control Board

      Registration under States Sales Tax Act and Central and                Excise Department
                          State Excise Act / Commercial taxes

                         Sanction of power / Power feasibility         Power & Electricity Department
                                         / Power connection

          Approval for construction activity and building plan            Public Works Department

            Water and sewerage clearance / Water connection       Public Health and Engineering Department

 34
Cost of doing business in Mizoram

  Approvals and clearances required                    Department            Source

  Hotel (per room per night)                         US$ 8 to U$ 25          Ministry of Tourism

  Office space rent (2,000 sq ft)              US$ 60 to US$ 600 per month   Industry sources

  Residential space rent (2,000 sq ft)         US$ 60 to US$ 200 per month   Industry sources

                                                   Unskilled: US$ 4.19
                                                                             Ministry of Labour and Employment,
  Labour cost (minimum wages per day) (2016)      Semi-skilled: US$ 4.5
                                                                             Government of India
                                                  Skilled: US$ 5.7- 7.14

 35
Contact list

               Agency                                    Contact information

                                                         258, 1st floor, Vigyan Bhavan-Annexe
                                                         New Delhi - 110011
               Ministry for Development of North
                                                         Phone: 91-11-2302 2401, 2302 2400
               Eastern Region
                                                         Fax: 91-11-2306 2754
                                                         Website: www.mdoner.gov.in

                                                         State Public Information Officer-Joint Director of
                                                         Industries,
               Department of Industries, Government of   Department of Industries
               Mizoram                                   Aizawl, Mizoram
                                                         E-mail: director@industries.mizoram.gov.in
                                                         Website: www.industries.mizoram.gov.in

                                                         New Secretariat Complex, Khatla, Aizawl,
               Zoram Industrial Development              P. Box - 125, AIZWAL - 796 001. MIZORAM
               Corporation                               Ph. 0389-2310190, 2326271(Fax)
                                                         Website: http://industries.mizoram.gov.in/psizidco.html

 36
State acts and policies

                     Mizoram Responsible Tourism Policy, 2020

      1              To enhance livelihood of people and funding support from the Centre and other
                     stakeholders.
                                                                                                         Read more

                     Industrial Rooftop Solar Policy 2020 in Mizoram
                     To ensure reliable power supply and a sustainable energy mix for the state.
      2              According to the policy, the state is expected to develop 80 MW of solar projects (rooftop +
                     ground-mounted) to meet 10.5% renewable purchase obligation (RPO) by 2021-22.
                     In May 2020, Mizoram issued an empanelment tender for 500 KW of rooftop solar in the
                     residential segment.                                                                 Read more

                     Mizoram Socio-Economic Development Policy 2019

      3              To increase the Gross State Domestic Product (GSDP) of Mizoram
                     To prioritise bio-diversity, ecosystem functioning and socio-economic development
                                                                                                         Read more

 37
APPENDIX

38
Sources

                       Data                                                                 Sources

 GSDP (state)                                   Planning and Implementation Department, Government of Mizoram

 Per capita GSDP figures                        Planning and Implementation Department, Government of Mizoram, MOSPI

 GSDP (India)                                   Central Statistics Office

  Installed power capacity (MW)                 Central Electricity Authority

  Wireless subscribers (No)                     Telecom Regulatory Authority of India

  Internet subscribers (million)                Telecom Regulatory Authority of India

  National highway length (km)                  NHAI, Roads and Building Department-Government of India

  Airports (No)                                 Airports Authority of India

  Literacy rate (%)                             Census 2011

  Birth rate (per 1,000 population)             SRS Bulletin, 2018
  Cumulative FDI equity inflows (US$ billion)   Department for Promotion of Industry and Internal Trade

  Operational PPP projects (No)                 DEA , Ministry of Finance, Government of India

 39
Exchange rates

  Exchange Rates (Fiscal Year)                                                 Exchange Rates (Calendar Year)

                    Year                           Rs. Equivalent of one US$               Year                 Rs. Equivalent of one US$
                  2004-05                                   44.95                          2005                          44.11

                  2005-06                                   44.28                          2006                          45.33
                  2006-07                                   45.29                          2007                          41.29
                  2007-08                                   40.24                          2008                          43.42
                  2008-09                                   45.91                          2009                          48.35
                  2009-10                                   47.42                          2010                          45.74
                  2010-11                                   45.58                          2011                          46.67
                  2011-12                                   47.95                          2012                          53.49
                  2012-13                                   54.45                          2013                          58.63
                  2013-14                                   60.50                          2014                          61.03
                  2014-15                                   61.15                          2015                          64.15
                  2015-16                                   65.46                          2016                          67.21
                  2016-17                                   67.09                          2017                          65.12
                  2017-18                                   64.45                          2018                          68.36
                  2018-19                                   69.89                          2019                          69.89
                  2019-20                                   70.49                          2020                          74.18
                  2020-21                                   72.59                         2021*                          73.69

 Note: As of February 2021
 Source: Reserve Bank of India, Average for the year

 40
Disclaimer

  “India Brand Equity Foundation (IBEF) engaged Sutherland Global Services private Limited to prepare/update this presentation.

  All rights reserved. All copyright in this presentation and related works is solely and exclusively owned by IBEF, delivered during the course of
  engagement under the Professional Service Agreement signed by the Parties. The same may not be reproduced, wholly or in part in any material
  form (including photocopying or storing it in any medium by electronic means and whether or not transiently or incidentally to some other use of this
  presentation), modified or in any manner communicated to any third party except with the written approval of IBEF.

  This presentation is for information purposes only. While due care has been taken during the compilation of this presentation to ensure that the
  information is accurate to the best of Sutherland Global Services’ Private Limited and IBEF’s knowledge and belief, the content is not to be construed
  in any manner whatsoever as a substitute for professional advice.

  Sutherland Global Services Private Limited and IBEF neither recommend nor endorse any specific products or services that may have been
  mentioned in this presentation and nor do they assume any liability, damages or responsibility for the outcome of decisions taken as a result of any
  reliance placed on this presentation.

  Neither Sutherland Global Services Private Limited nor IBEF shall be liable for any special, direct, indirect or consequential damages that may arise
  due to any act or omission on the part of the user due to any reliance placed or guidance taken from any portion of this presentation.”

 41
You can also read