Mobile Phone Charging: Power Statistics & Energy Consumption Pattern Analysis using Developed "PowerStats" Android Application - sersc
←
→
Page content transcription
If your browser does not render page correctly, please read the page content below
International Journal of Disaster Recovery and Business Continuity
                                                                                 Vol.11, No. 3, (2020), pp. 846–867

 Mobile Phone Charging: Power Statistics & Energy Consumption Pattern
      Analysis using Developed “PowerStats” Android Application
                         Saloni Kuralkar, Preeti Mulay*, Archana Chaudhari

                              Symbiosis Institute of Technology,
                   Symbiosis International (Deemed University), Pune, India
                             *Email: preeti.mulay@sitpune.edu.in

                                                Abstract
Nowadays Mobile phones have become an essential part of life. The number of mobile phone users is
also increasing rapidly; each person in a house has their handsets, leads to the rapid increase of mobile
phone usages in every age group. This will ultimately lead to more electricity consumption required to
charge a mobile phone. Mobile phone energy usage depends on factors such as Software energy use,
equipment, devices, device contact with apps, wireless network, sensor network, etc. Hence, the paper
presents a developed android application named “PowerStats” which gives the statistics of mobile
phone charging patterns of users as per the i. Model of phones ii. Plugged in/out battery percentage iii.
Plugged in/out timestamp iv. Voltage & v. Current. Based on these statistics, further analysis is done
as I. The mobile phone charging patterns of users. II. The mobile battery and its consumption capacity.
III. To show that electricity required to charge a group of mobile phones in a household is equivalent
to Air Conditioners, on a large scale. IV. To predict the best classification algorithm for the collected
dataset from the application.

Keywords: Power Statistic; Direct-Indirect charging; Machine learning; Supervised Learning; Smart
Meter.

1. Introduction
Mobile phones are a very valuable development because they have been the main device used in human
life. The whole world is accepting and adopting the ways towards the advancement of technology.
Surveys have consistently shown that people even prefer their mobile phones over television. In the
past 20 years, global cell phone subscribers have risen from 12.4 million to more than 5.6 billion ,
accounting for around 70 % of the world 's population. According to the new statistics from GSMA
Intelligence, there are 5.19 billion individual cell phone subscribers in the world today. Today
smartphones are used at an annual rate of 8 percent, with well over 1 million new smartphones used
every day on average. These statistics show the rapid increase in the usage of mobile phone users.

1.1 Statistics of Mobile Phone Users Worldwide
Figure 1 shows the maximum number of Mobile Phone Users rising around the world. South Korea
leads with 71.5% of the population who are mobile users.

                 Figure 1: Mobile Phone Trends in 2020 - Stats & Facts Worldwide.
     Source: https://www.vpnmentor.com/blog/vital-internet-trends/ (accessed on 3rd April 2020)

                                                                                                             846
ISSN: 2005-4289 IJDRBC
Copyright ⓒ2020 SERSC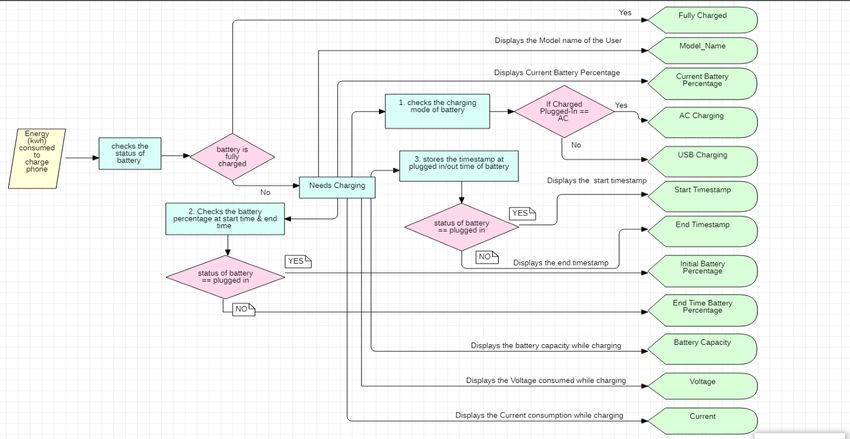
International Journal of Disaster Recovery and Business Continuity
                                                                                 Vol.11, No. 3, (2020), pp. 846–867

A mobile phone is a computer tool that is used to operate various operations, operate it software,
wireless network interoperability, information exchange within a server and a network technology
environment. It requires a battery as a power source. These batteries need 1 to 4 hours of charging which
is not necessary as an average of 14 hours for a few hours of talk time. The mobile phone is often used
in social networking, gaming, GPS applications, video sharing and another device connectivity. These
specifications required the mobile system to process immensely. Ultimately, a lot of power energy is
consumed during processing. Despite increasingly rising competition for machine power the approaches
to this issue would not be applied regularly depending on the device's output. Today, electricity plays a
critical function in everyday life. Since we use a lot of electrical energy-dependent appliances, it's
pretty hard to live without electricity.

1.2 Factors Influencing Energy Consumption in Mobile Phones
Electronic products, in particular mobile phones, are powered by batteries that are small in size and so
in performance. This means that effective energy conservation is of utmost importance in these
appliances. Efficient energy usage requires a good view of when and how to utilize the electricity.
Hence factors affecting the energy consumption are: A) Baseline cases: 1. Suspended device 2. Idle
device and 3. Displays, B) Micro-benchmarks: 1. CPU & RAM 2. Flash storage 3. Network and 4. GPS
C) Usage Scenarios: 1. Audio and Video playback 2. Text messaging 3. Voice calls 4. Emailing and 5.
Web Browsing.

1.3 Household Electricity Consumption of Appliances
The mobile phone users’ population is increasing rapidly, and the demand for energy consumption &
generation is also increasing. Rather than increasing the Energy production, supply and installations of
utility centres the demand for energy can be adjusted. Figure 2 gives the percentage of energy usages
of different electrical & electronic appliances. The graph even depicts the percentage of energy usages
of electronic appliances (i.e. mobile phones) is almost equivalent to the percentage of energy usages of
other electrical appliances.

Figure 2: Household Energy Usage- Percentage of energy usages of appliances, Source: US Energy
                                 Information Administration

These statistics give the idea behind the proposed research work, as the Mobile Phone users are rapidly
increasing and simultaneously the demand of energy to charge such a rising mobile usage population is
also increasing.

The paper presents a new approach to deal with the energy consumption and power statistics of mobile
phone charging. The research methodology is as follows:
               1. Determine the best fit classification algorithm for the collected dataset.
               2. To show that electric energy required to charge a mobile phone is
               equivalent to other electrical devices such as Air Conditioners, on a large
               scale. 3. To study and analyse: i. The mobile phone charging patterns of
               users and ii. The mobile battery and its consumption capacity. 4.
               Comparing the direct and indirect method of charging for the phone model,
               the usage of the battery in mAh(ampere-hour), the voltage needed to charge

                                                                                                             847
ISSN: 2005-4289 IJDRBC
Copyright ⓒ2020 SERSC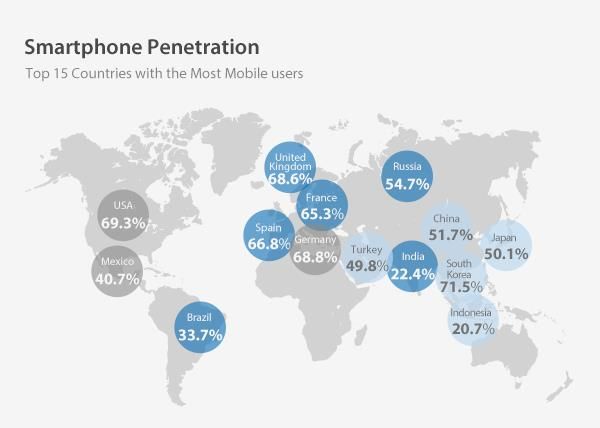
International Journal of Disaster Recovery and Business Continuity
                                                                                  Vol.11, No. 3, (2020), pp. 846–867

                the cell, the time necessary to charge it fully, etc., and then, after evaluating
                the results, the result is determined:

The most efficient way of charging is determined which consume less energy or the best mode of
charging is determined which keeps the long-lasting battery power w.r.t the model of the handset.

The format of the paper is as follows: section 2 and section 3 describes the related work, data summary
and preparation; section 4 and section 5 is the proposed methodology, experimental results and section
6 is a Discussion, and section 7 is conclusion and future research directions.

2. Literature Review
In the past years, extensive research has been done to reduce energy consumption and discover the ways
to manage the energy load. The different perspectives of the load minimization and the reason behind
the maximum energy consumption has been found. The electrical devices lead to consumption of energy
hence the study leads to further monitor the energy consumption patterns of these different electrical
devices. So, different research cases exist to classify the above scenario.
Due to the increasing demand for electricity, researchers are focusing on alternative sources of reduction
in energy consumption. The alternate ways introduced by researchers to reduce energy consumption are
1. Load Profiling 2. Peak Load Estimation 3. Demand – Response 4. Smart Grid

Some Existing Methods to Reduce the Energy Consumption:
      1. Load Profiling: Smart Grid Technology field test financed by the USA for the Pacific
      North-West Grid Wise Testbed Project was obtained from the Pacific North-West
      National Laboratory (PNNL) Researcher; PNNL Energy was started in 2004. The
      initiative observed the energy consumption of 112 households in a bipartisan
      communication network for 15 minutes and ambient temperatures per hour. 96 data points
      per element are collected every day in every home, per 15 minutes at a data sampling
      scale. In order for data collected from each household to be transmitted and processed by
      a "intelligent meter profiling program," the transmitting ability of the telephone network
      and the control centre storage space will be significantly greater than the normal data
      collection. (Ambrosio et al. 2007)
      2. Peak Load Estimation: Adequate power planning for substations and feeders relies
      largely on a reliable estimation of the potential peak demand for electricity. A
      conventional correlated peak load calculation is based on an analytical measure of high
      demand for variance, suggesting individual peak usage rates and diversification of supply
      across multiple inhabitants. (Sun et al. 2019)
      3. The Demand Response (DR): Energy demand adjustments rather than supply
      modification have been introduced in programs. "Time of Use (ToU),' one of the DR's
      most well-known programs, encourages customers to shift their consumption pattern to
      less hours of energy consumption in return of incentives, also known as outsource hours.
      (Pabon et al. 2016)
      4. Smart Grid: A broad repository of Smart Grid initiatives in Europe using project data
      to enable the study of trends and developments. The study discusses many facets of the
      Smart Grids framework to explain the state of the art of their operation, the evolving
      characteristics of the new electricity network and future developments. A core objective
      of the study is to explain how Smart Grid initiatives tackle and respond to the EU energy
      policy issues and to map out the major advantages and beneficiaries. Particular attention
      is paid to recognizing the most significant obstacles to innovation and potential
      approaches that may help to resolve them. (Liu et al. 2019)

Furthermore, the researchers concentrate on the other electronic devices apart from the larger ones such
as cell phones and the power required to charge them, factors affecting power usage etc. The study
described below relates to the same factor.

                                                                                                              848
ISSN: 2005-4289 IJDRBC
Copyright ⓒ2020 SERSC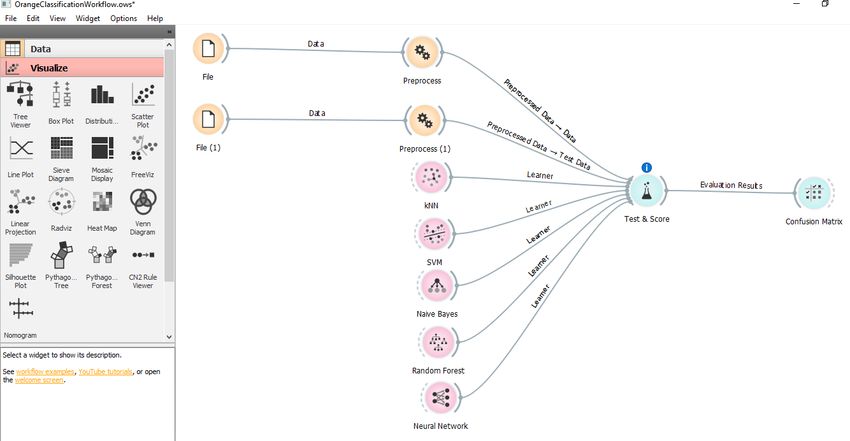
International Journal of Disaster Recovery and Business Continuity
                                                                                  Vol.11, No. 3, (2020), pp. 846–867

The current study work deals with the measurement of power use in terms of resource use across the
specific cell phone variables. A system to identify and track the use of mobile apps for electricity.
Approach to the measurement of the energy usage of the standard cellular device, the Openmoko Neo
Free running mobile phone, has been decomposed into the main subsystems of the network in a large
range of realistic scenarios. Specifically, it is suggested that power allocation, memory, touch screen,
computer equipment, audio, data, and various network interfaces be broken down. The system's total
energy model as a feature of major use scenarios. This offers a good foundation for working on future
energy saving research on mobile devices. (Carroll and Heiser, 2010)

Considering the effect of application load on smartphone energy use, an energy-efficient timeline
algorithm has been developed for specific program loads. Others looked at the relation between the
energy expended while transmitting values and the bandwidth of the network. (Schulman et al. 2010)
Introduced a performance method for Wi-Fi & 3 G that would consider the effect of a good /bad
connection on the electricity used by the cellular components installed in the device. (Ding et al. 2013)
Authors in Test the usage of connection capacity and transmission values on 802.11 networks. They
concluded that mobile, device background, and OS are among the many variables that influence the
optimum option of data transmission strategy. While cell phones are widely used in cloud technologies
to form what is known while cell cloud computing, research has suggested energy saving techniques
for mobile cloud technology. (Al-Ayyoub et al. 2015), (Bahwaireth et al. 2015) and (Rice and Hay,
2010)

In the same way, a thorough study of scalable and efficient mobile cloud storage was carried out, the
writers proposed a system that assigns research to certain programs to be performed on a smart machine
and transfers other activities to be performed on a server. (Fekete et al. 2013) and (Tawalbeh et al. 2015)
Methods for moving outsourced operations from a mobile unit to a remote network (e.g. cloud) have
been implemented to reduce electricity consumption and local time of execution on a mobile device.
(Carroll and Heiser, 2010) and (Jararweh et al. 2013)
Authors proposed a theoretical framework for a power-efficient software operated on a hypothetical
wireless network. They can consider two factors for application, the size of the data and the timeline
for fulfilment of the query. The empiric results of this empirical approach determine the position of the
power-efficient system run for each device. Depending on the survey in question, it can therefore be
argued that the unloading process may be used to minimize energy use in a cell phone device, but a
number of considerations influence the performance of such a method, such as the nature of the devices,
the size of the data and the internet connection. (Zhang, Weiwen, et al. 2013)

Energy usage is being evaluated for the unique features of two famous smartphone firms, namely
Galaxy Note3 and Sony Xperia Z2. Calculations are rendered using software that calculates the power
used in any aspect of the handset. The results gathered to provide more comprehensive information of
these apps contribute to the overall power consumption of the device. (Tawalbeha et al. 2016)

A geographically dependent Wi-Fi scanning technique that identifies the closest Wi-Fi signal access
points (APs) depending on the device's positioning data. This allows consumers to intelligently switch
to the Wi-Fi device as they arrive at the closest Wi-Fi network AP. We will always meet the customer
's criteria for optimal connectivity in terms of bandwidth. It prevents long stretches of idleness and
greatly reduces the number of unwanted Wi-Fi searches on a mobile computer. Our experiments and
measurements demonstrate that our system effectively saves money for Wi-Fi phones and internet
mediators. (Xia et al. 2015)

Measurement of the energy consumption properties of three popular mobile networking technologies:
3 G, GSM, and Wi-Fi. We note that the 3 G we GSM suffer more energy due to the remaining energy
statistics after the transition has been completed. Based on these measurements, a method of energy
consumed by the activity of the network has been developed for each device , i.e. TailEnder, a protocol
that reduces energy use for growing smartphone applications. For systems that can tolerate a small
delay, such as e-mails, TailEnder aims to popular the overall capital consumed by dealing on user-
specific timelines. (Benkhelifa et al. 2015)
                                                                                                              849
ISSN: 2005-4289 IJDRBC
Copyright ⓒ2020 SERSC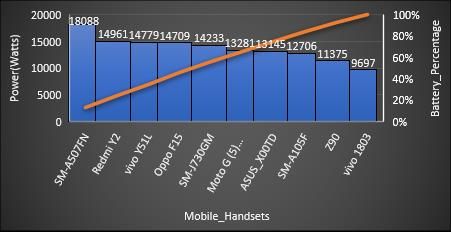
International Journal of Disaster Recovery and Business Continuity
Vol.11, No. 3, (2020), pp. 846–867
Paper clusters use domestic energy using smart metre data from the Danish town of Esbjerg. Methods
of time series analysis and wavelets are used to allow the K-Means clustering method to compensate
for auto data correlation and increase clustering efficiency. The results show the value of data awareness
and we recognize sub-clusters of use in housing styles and allow K-Means to achieve adequate
clustering by accounting for a temporary portion. The analysis also shows that the diligent pre-
processing of data to compensate for the intrinsic structure allows improved clustering efficiency
through the K-Means approach. (Alexander et al. 2018)
3. Data Summary and Preparation
This section introduces the proposed android application “PowerStats”, which is used to collect the
dataset to do further analysis. Data Collection of Mobile Phones Charging Pattern is done using the
developed “PowerStats” Android Application.
3.1 Data Collection and Pre-Processing
The Android Application- “PowerStats” is developed to collect the data from Users to analyze their
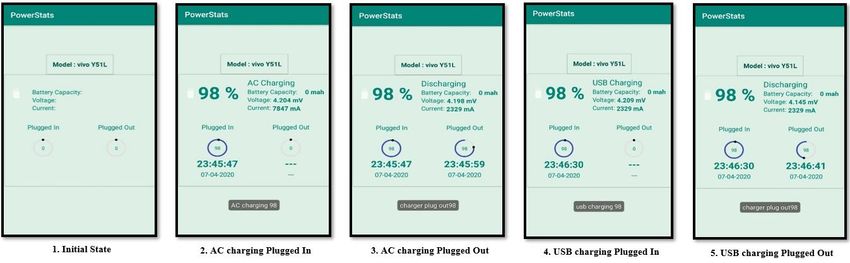
charging patterns. Figure 3 shows the User Interface of the developed Android Application. The purpose
of the application is to collect the dataset required to do further analysis of the proposed research study.
The figure consists of different states of application: 1. Initial State: is the idle interface state of an
application. 2. AC Charging Plugged In: is the state when the direct method of charging is used. 3. AC
Charging Plugged Out: is the state when the charger is plugged out. 4. USB Charging Plugged In: is the
state when the in-direct method of charging is used. 5. USB Charging Plugged Out: is the state when
charger is plugged out.
Figure 3: User Interface of “PowerStats” Android Application
This section introduces the electricity consumption data that will be analysed for the remainder of this
paper. This paper analyses consumption patterns of 10 mobile phone users in the cities of Nagpur and
Pune. The literature does not advise on the time length for analysing consumption patterns. The third
week of December 2019 is selected, starting on Monday the 16th and ending of April, Thursday the
30th, with all days included. Table 1 shows the description of data in terms of various quantitative
measures.
Table 1. Initial data description, comprising 8 distinct quantitative measures of the data applied
Data Values
Description
Country India
Region Region Maharashtra;
Cities: Nagpur, Pune
Size 3,56,821 bytes
850
ISSN: 2005-4289 IJDRBC
Copyright ⓒ2020 SERSC
International Journal of Disaster Recovery and Business Continuity
                                                                                   Vol.11, No. 3, (2020), pp. 846–867

                              Missing            20 instances
                              Values
                              Start Date         16 Dec 2019
                              End Date           30 April 2020
                              Length             2813 observations
                              Number of          10
                              User’s

3.1.1 Distributed System Architecture of Android Application “PowerStats”
The application is a Distributed System which is divided into 3 phases:
1. User Interface or Front End i.e. Android Application; 2. Interconnection between Sender & Receiver
i.e. MongoDB Stitch Application; 3. Data Storage or Back End i.e. MongoDB Atlas. In this distributed
system there is android mobile having an android application in which users basic charging information
is collected. The interconnection is done using MongoDB Stitch Application which connects to the
MongoDB Atlas cloud.
Components of Application: 1. Model (Company) name of Handset, 2. Plugged in/out battery
percentage, 3. Plugged in/out timestamp, 4. Mode of Charging: AC or USB, 5. Battery Capacity mAh,
6. Voltage mV, 7. Current mA.
Figure 4 depicts the system architecture of android application (PowerStats) which has android
interface, the interconnection between cloud and device is a Stitch React Native SDK and the storage
is done on Atlas.

                                       Figure 4: Architecture of System
3.1.2 Algorithm for “PowerStats” Android Application
        Input: Plug In/Out battery charger, PlugInOutBattery().
        Output: 1. Mode of Charging( Direct i.e. AC or Indirect i.e. USB); 2. Battery Percentage at
        Plug In/Out; 3. Timestamp at Plug In/Out; 4. Voltage; 5. Current 6. Battery Capacity.
        Initialize: I, α, β, ϒ , θ, ψ, ω, status, batteryPct, timestamp, voltage, current, battery_capacity;
        foreach item I € PlugInOutBattery(α) do
                 if (I== Plugged In) then status = Plugged In //checks the status of battery
                 return status
                 else if (I== Plugged Out) then status = Plugged Out
                 return status
                 else
                           return idle
                 end if
        end for
        foreach item I € PlugInOutBattery(β) do
                 if (I== AC charge plugged in) then (AC charge) //checks the charging mode of
        battery
                 return AC charge;
                 else If (I== USB charge plugged in) then (USB charge)
                                                                                                               851
ISSN: 2005-4289 IJDRBC
Copyright ⓒ2020 SERSC
International Journal of Disaster Recovery and Business Continuity
Vol.11, No. 3, (2020), pp. 846–867
return USB charge
else
return null
end if
end for
foreach item I € PlugInOutBattery(ϒ ) do
float batteryPct = level * 100 / (float)scale; // formula to calculate battery percentage
if ( α == plugged in) then (store the plug-in time battery percentage) // battery percentage
at plug in/ out time
return batteryPct
else if (α == plugged out) then (store the plug-out time battery percentage)
return batteryPct
else
return null
end if
end for
foreach item I € PlugInOutBattery(λ) do
if (α == plugged in) then (store the start timestamp) //stores the timestamp
return timestamp
else if (α == plugged out) then (store the end timestamp)
return timestamp
else
return null
end if
end for
foreach item I € PlugInOutBattery(θ) do // voltage while charging
float voltage = float.valueOf(sharedpreferences.getString("voltage", "00")) / 1000.0f
return voltage.
end for
foreach item I € PlugInOutBattery(ψ) do // current while charging
int current = int.valueOf(sharedpreferences.getString("current", "0")) / 100
return current.
end for
foreach item I € PlugInOutBattery(ω) do // battery capacity while charging
int battery_capacity = int.valueOf(sharedpreferences.getString("battery_capacity","0000"))
return battery_capacity.
end for
3.1.3 Data Pre-Processing
Data pre-processing is done to enhance the data consistency, increase efficiency and make ease in the
mining process. This phase makes the data more efficient for further steps. Mostly the pre-processing
is done to remove values with errors, imputing the null values, normalizing the values, dimensionality
reduction, etc. Pre-processing features applied is: Imputing Missing Values - with Average or most
frequent values.
3.2 Workflow of “PowerStats” Android Application
Figure 5 depicts the complete stepwise workflow of the Android Application. The figure consists of
parameters which are checked to give the required results such as plugged in/out battery percentage,
plugged in/out timestamp, charging mode, voltage and current required, model/handset of mobile,
battery capacity of the phone.
852
ISSN: 2005-4289 IJDRBC
Copyright ⓒ2020 SERSCInternational Journal of Disaster Recovery and Business Continuity
Vol.11, No. 3, (2020), pp. 846–867
Figure 5: Flowchart shows the Workflow of the “PowerStats” Application
3.3 Comparative Analysis of : “Existing Mobile Battery Applications of Google Playstore” vs.
“PowerStats”
There are more than 40 android applications related to mobile battery on Google Playstore. The
applications with highest ratings and have some features to that of developed application “PowerStats”
are considered for the comparative analysis.
Table 2 shows the specifications of the different Mobile based battery applications of playstore platform
vs. the developed application “PowerStats”.
Table 2: Comparative Specification of “Mobile Battery based Apps” vs. “PowerStats”
Android
Applications Green Battery
Features
Batte Charger Developed
Batte ry - with AccuBatte Ampe Battery Applicatio
ry Powe Battery ry re Doctor n:
r Saver “PowerSta
Saver and ts”
Free, Optimiz
CPU er
better
1. Displays battery
information in
percent (%)
2. Offers quality
support for different
Android devices.
3. Full support for
all known screen
resolutions
4. Battery
Information in terms
of:
853
ISSN: 2005-4289 IJDRBC
Copyright ⓒ2020 SERSCInternational Journal of Disaster Recovery and Business Continuity
Vol.11, No. 3, (2020), pp. 846–867
- Temper (in terms (in terms of
ature of voltage)
- Voltage temperatu
- Health re)
Status
- Technol
ogy
5. Accurate –
power available
time remaining of
phone.
6. Track battery
charge status
7. Battery charging
history
8. Measure real
battery capacity (in
mAh)
9. Measure the
charging and
discharging current
of your battery
10. Displays
battery’s timestamp
(date & time) at the
time of plugged in
and plugged out.
11. Displays battery
percentage at the
plugged in and
plugged out time.
12. Displays the
mobile handset
model name.
13. Displays the
mode of charging
(AC or USB mode).
Figure 6 shows the different mobile handsets and their battery percentage patterns w.r.t the power
consumption. SM-A507 consumes more power and its battery charging percentage pattern lies between
0-90%. Similarly, lowest consumption of power is done by Vivo 1803 and its battery charging
percentage pattern lies between 0-50%.
854
ISSN: 2005-4289 IJDRBC
Copyright ⓒ2020 SERSCInternational Journal of Disaster Recovery and Business Continuity
Vol.11, No. 3, (2020), pp. 846–867
Figure 6 : Cumulative frequency graph of different handsets and their power consumption varying
between the battery percentages
3.4 Dataset Validation
Methods Used to Validate the Collected Dataset. Figure 10 shows the Statistical Analysis of Data which
is done using different methods such as 1. Nominal & Internal Scale Measurements Method 1.1 Range
Check, 1.2 Type Check; 2. Physical or Mathematical Model-Based Method 2.1 Extreme Value check
using statistics; 3. Statistical Method Spearman Correlation Coefficient. After performing the analysis
on Sage Research Methods among various statistical method the Spearman Correlation Coefficient is
most suitable for the dataset. Hence the Spearman Correlation Coefficient method is selected to find
the dependent or independent variables among the dataset. Table 3 shows the various methods to
perform data validation such as 1. Nominal & Interval Scale Measurements Method 2. Physical Or
Mathematical Model-Based Method and 3. Statistical Method.
Table 3: Statistical Data Validation Table
Data Validation
Nominal & Physical Statistical Method
Techniques Interval Scale Or
Measurements Mathem
Attributes of Dataset Method atical
Model-
Based
Methods
1. 2. 3. 4. Spearman Correlation Coefficient
Range Type Extreme
Check Check value
(Ensure (Valid check
s the ates using
data the statistics
lies data (determi
within is of nes
a correc “outlier
specific t data ”)
range) type)
1. Age (10- Text 1. 100 between the values of Voltage & Current.
2. Gender (Male Text - Null Hypothesis H0: H0: There is no
or [monotonic] association between Voltage and
Female) Current Values
3. Profession - Text - There are two methods to calculate
Spearman's correlation depending on whether:
4. - Text - 1. your data does not have tied ranks or
Model_Name
855
ISSN: 2005-4289 IJDRBC
Copyright ⓒ2020 SERSCInternational Journal of Disaster Recovery and Business Continuity
Vol.11, No. 3, (2020), pp. 846–867
5. Start% (0% - Numer 1. 100%
6. End% (0% - Numer 1. 100%
there are tied ranks is:
7. (AC or Text -
Mode_of_char USB)
ging
8. ((16 Date 1. greater where i = paired score.
Start_Timesta Dec & than Metho COR(data1$ COV(data1$
mp 2019 to Time 1576514 d Voltage, Voltage,
30 April 603 data1$Curre data1$Curre
2020) 2. less nt) nt)
i.e. than
(157651 1556642 Spear -0.016 -0.861
4603 – 603 man
155664 Correl
2603) ation
9. ((16 Date 1. greater Coeffic
End_Timestam Dec & than ient
p 2019 to Time 1576514
30 April 603 Hence the Voltage & Current variables has no
2020) 2. less association and they are independent. As the -
i.e. than 1International Journal of Disaster Recovery and Business Continuity
Vol.11, No. 3, (2020), pp. 846–867
The theoretical mathematical structure for the study of the smart meter data is defined in this section.
In Section 4.1 the concept of statistical learning begins, and a flow chart is presented illustrating the
procedure employed in this paper. The literature review in Section 2 identified algorithms such as:
KNN, SVM, Naïve Bayes, Random Forest, Neural Network as the most prevalent classification method
for the large volume dataset.
4.1. Statistical Learning
Applying controlled or non-supervised learning will tip the statistical separation of data into smaller,
more homogenic subsets. The differentiation between controlled and unsupervised learning is related
to variations in the initial conditions of the problem. There are several established class names and
comprehension of the identification characteristics of the class for supervised learning difficulties. This
membership knowledge is used to create a mathematical function that maps observations into classes.
Figure 7 shows the flow of methodology used in the paper. The data is collected, pre-processed and
classified using different methods, such as for imputing missing values average/most frequent method
is used and for supervised learning different classification algorithms are used and the best-fit algorithm
is determined.
Figure 7: Methodology Flowchart
The classification is done using ORANGE tool. The classification is done using the different
classification algorithms such as KNN, SVM, Naïve Bayes, Random Forest, Neural Network. Figure 8
depicts the workflow of supervised learning. The widget File has Training data and widget File1 has
Testing data. Different learners are used to classifying the dataset. The Test & Score widget is used to
give results and classification accuracy. The confusion matrix shows the number of classified and
misclassified instances.
Figure 8: Workflow of supervised learning on ORANGE tool
5. Experimental Results
857
ISSN: 2005-4289 IJDRBC
Copyright ⓒ2020 SERSCInternational Journal of Disaster Recovery and Business Continuity
Vol.11, No. 3, (2020), pp. 846–867
5.1 Supervised Learning Methods
The collected dataset from the “PowerStats” Android Application has gone through the phase of Pre-
Processing and then done the Data Classification using various Classification Algorithm.
The Supervised Learning method is applied to the dataset in the following steps:
1. The dataset is split into Training and Testing data, in the ratio 50-50, 60-40, 70-30.
2. Different Classification Learners are applied to the Training data.
3. The Classification Accuracy of both Training & Testing data is determined.
Hence the conclusion to predict the good classification algorithm for the dataset is done in two ways:
1. Maximum Correctly Classified Instances or 2. Least number of Misclassified Instances.
Table 4 depicts the comparative analysis of classification algorithms on the dataset collected based on
factors such as 1. Training Set Size, and 2. Classification Accuracy.
Table 4: Comparative Analysis of Supervised Learners
5.2 Comparative Analysis of Energy Consumption of Air Conditioners with Mobile Phones
Electricity Energy Usage Comparison in between Air Conditioner & Mobile Phone Charging-
Considered a household Scenario where on an average there are 4 mobile phone handsets and 1 Air
Conditioner.
Table 5 shows the data of energy consumption of household mobile phones as follows:
1. Number of Phones in a Household, 2. Model / Company of Handset, 3. The average number of times
phones are charged in the time duration, 4. Average battery percentage at the plug in time in 137 days
duration, 5. Average battery percentage at plug out time in 137 days duration, 6. Average Power
Consumption per hour, 7. Total mobile charging power consumption of a household.
Calculation Steps:
1. The average number of times phones are charged in 137 days duration = Total number of times
phones are charged / Total Number of Days
2. Average battery percentage at the plugin time in 137 days duration= Total number of times phones
are plugged in battery percentage / Total Number of Days.
3. Average battery percentage at plug out time in 137 days duration= Total number of times phones are
plugged out battery percentage / Total Number of Days.
4. Power (watts) = voltage (volt)* current (ampere)
5. Average Power Consumption/hour (watts/hour)= .total Power (watts)/total time (hours)
6. Total mobile charging power consumption of a household= Total addition of Average Power
Consumption/hour (watts/hour)
Table 5: Comparative Energy Consumption Table of Mobile Phones Vs Air Conditioners
Househol Numb Model of Avera Average Average Average Total
ds er of Phones ge battery battery Power mobile
Phone numbe percenta percenta Consumpti charging
s r of ge at ge at on power
times plug in plug out per hour consumpti
phones time in time in on of a
are 137 days 137 days household
charge duration duration
d in
137
days
durati
on
Househol 3 1. Redmi Y2 1 time 47% 74% 180.46 563.46
d1 per day watts/hour watts/hour
858
ISSN: 2005-4289 IJDRBC
Copyright ⓒ2020 SERSCInternational Journal of Disaster Recovery and Business Continuity
Vol.11, No. 3, (2020), pp. 846–867
Classific Train/ Targe Training Data Actu Classific Test Data Actu Classific
ation Test t al ation al ation
Algorith Split Class Corre Misclas Insta Accurac Insta Accurac
m ratio (Mode ctly sified nces y of nces y of
of Classi Instanc Trainin Testing
Charg g set Corre Misclas set
fied es ctly sified
ing) Insta Classi Instanc
nces fied es
Insta
nces
1. KNN 50-50 AC 579 187 766 0.720 522 189 711 0.531
Chargi
ratio ng (72%) (53.1%)
USB 432 207 639 225 471 696
Chargi
ng
60- 40 AC 681 223 904 0.722 252 321 573 0.514
ratio Chargi
ng (72.2%) (51.4%)
USB 537 246 783 326 226 552
Chargi
ng
70-30 AC 795 255 1050 0.719 163 264 427 0.518
Chargi
ratio ng (71.9%) (51.8%)
USB 620 299 919 274 142 416
Chargi
ng
2. SVM 50-50 AC 630 136 766 0.580 651 60 711 0.512
ratio Chargi
ng (58%) (51.2%)
USB 185 454 639 70 626 696
Chargi
ng
60- 40 AC 788 116 904 0.554 532 41 573 0.512
ratio Chargi
ng (54.4%) (51.2%)
USB 147 636 783 44 508 552
Chargi
ng
859
ISSN: 2005-4289 IJDRBC
Copyright ⓒ2020 SERSCInternational Journal of Disaster Recovery and Business Continuity
Vol.11, No. 3, (2020), pp. 846–867
70-30 AC 885 165 1050 0.538 376 51 427 0.492
ratio Chargi
ng (53.8%) (49.2%)
USB 174 745 919 39 377 416
Chargi
ng
3. 50-50 AC 422 344 766 0.618 240 471 711 0.515
Naïve ratio Chargi
Bayes ng (61.8%) (51.5%)
USB 446 193 639 485 211 696
Chargi
ng
60- 40 AC 448 456 904 0.587 130 443 573 0.498
ratio Chargi
ng (58.7%) (49.8%)
USB 543 240 783 430 122 552
Chargi
ng
70-30 AC 505 545 1050 0.587 138 289 427 0.504
ratio Chargi
ng (58.7%) (50.4%)
USB 651 268 919 287 129 416
Chargi
ng
4. 50-50 AC 734 32 766 0.962 482 229 711 0.513
Random ratio Chargi
Forest ng (96.2%) (51.3%)
USB 614 25 639 205 491 696
Chargi
ng
60- 40 AC 877 27 904 0.956 301 272 573 0.488
ratio Chargi
ng (95.6%) (48.8%)
USB 758 25 783 254 298 552
Chargi
ng
2. SM- 1 time 49% 73% 195.86
A507FN per day watts/hour
860
ISSN: 2005-4289 IJDRBC
Copyright ⓒ2020 SERSCInternational Journal of Disaster Recovery and Business Continuity
Vol.11, No. 3, (2020), pp. 846–867
70-30 AC 1016 34 1050 0.960 186 241 427 0.515
ratio Chargi
ng (96%) (51.5%)
USB 879 40 919 234 182 416
Chargi
ng
5. 50-50 AC 563 203 766 0.649 666 45 711 0.512
Neural ratio Chargi
Networ ng (64.9%) (51.2%)
k
USB 349 290 639 54 642 696
Chargi
ng
60- 40 AC 556 348 904 0.646 440 133 573 0.504
ratio Chargi
ng (64.6%) (50.4%)
USB 533 250 783 127 425 552
Chargi
ng
70-30 AC 671 379 1050 0.642 267 160 427 0.474
ratio Chargi
ng (64.2%) (47.4%)
USB 593 326 919 133 283 416
Chargi
ng
3.ASUS_X00 4 times 48% 74% 187.14
TD per day watts/hour
Househol 5 1. vivo 1803 2 times 46% 73% 127.49 795.5
d2 per day watts/hour watts/hour
2. vivo Y51L 3 times 51% 72% 166.48
per day watts/hour
3. SM-A105F 1 time 50% 75% 168.59
per day watts/hour
4. Z90 1 time 49% 76% 132.95
per day watts/hour
5. Oppo F15 2 times 48% 72% 199.99
per day watts/hour
Househol 2 1. SM- 1 time 50% 79% 971.10 1121.67
d3 J730GM per day watts/hour Watts/hour
2. Moto G (5) 1 Time 49% 75% 150.57
Plus per day watts/hour
861
ISSN: 2005-4289 IJDRBC
Copyright ⓒ2020 SERSCInternational Journal of Disaster Recovery and Business Continuity
Vol.11, No. 3, (2020), pp. 846–867
Figure 9 gives the comparative scenario of a household mobile phone charging energy consumption Vs
different Split AC Type consumption. The power consumption is in terms of watts/hour. In Split AC
Type 1 Ton 5 star, the mobile phone charging consumption on average is more than the AC
consumption. Similarly, in 0.8 Ton 5 star and 1 Ton 3 star also; in other scenarios, the consumption is
almost equal.
2500
Power Consumption watts/hour
2000
1500
1000
500
0
1 1.5 2 0.8 1 1.5 2 1 1.5 2
Ton, Ton, Ton, Ton, Ton, Ton, Ton, Ton, Ton, Ton,
5 star 5 star 5 star 5 star 3 star 3 star 3 star 2 star 2 star 2 star
AC Consumption
984 1490 1732 812 1092 1566 1938 1154 1709 2210
watts/hour
Household 1 563.46 563.46 563.46 563.46 563.46 563.46 563.46 563.46 563.46 563.46
Household 2 795.5 795.5 795.5 795.5 795.5 795.5 795.5 795.5 795.5 795.5
Household 3 1121.7 1121.7 1121.7 1121.7 1121.7 1121.7 1121.7 1121.7 1121.7 1121.7
AC Consumption watts/hour Household 1 Household 2 Household 3
Figure 9: Generalised Household Energy Consumption Comparison Scenario
5.3 Determine the Most Efficient Mode of Charging
The most efficient way of charging is determined which consume less energy or the best mode of
charging is determined which keeps the long-lasting battery power w.r.t the model of the mobile
handset; as the mobile phone charging can be done in two ways: 1. Direct charging i.e. AC charging
Mode. 2. Indirect charging i.e. USB charging mode, it involves 2 devices apparently more electric
energy consumption.
Table 6 shows the Comparison between the Modes of Charging on the basis of the 1. Gender, 2.
Profession, 3. Mobile Model Name, 4. New/Old Handset of Phone, 5. Average Battery lasting time.
Table 6: Comparative Table of Modes of Charging w.r.t Model of Mobile Handset
Sr. No. Gender Profession Mobile Model Mode of Average battery Conclusion
Name charging lasting time
1 Male Student ASUS_X00TD USB 01:47:56 (1 hour USB charging mode
Charging 47 minutes) is more suitable and
has long lasting
battery power.
AC 01:41:17 (1 hour For ASUS_X00TD
Charging 41 minutes) Model.
862
ISSN: 2005-4289 IJDRBC
Copyright ⓒ2020 SERSCInternational Journal of Disaster Recovery and Business Continuity
Vol.11, No. 3, (2020), pp. 846–867
2. Female Engineer vivo Y51L USB 01:07:34 (1 hour AC charging mode is
Charging 7 minutes) more suitable and
has long lasting
battery power.
AC 03:22:53 (3 hour For vivo Y51L
Charging 22 minutes) Model.
3. Male Student Z90 USB 1:13:00 (1 hours AC charging mode is
Charging 13 minutes) more suitable and
has long lasting
battery power.
AC 01:41:17 (1 hour For Z90 Model.
Charging 41 minutes)
4. Female Student SM-A105F USB 2:45:10 (2 hours AC charging mode is
Charging 45 minutes) more suitable and
has long lasting
battery power.
AC 15:51:00 (15 For SM-A105F
Charging hours 51 Model.
minutes)
5. Female Engineer vivo 1803 USB 3:36:45 (3 hours AC charging mode is
Charging 36 minutes) more suitable and
has long lasting
battery power.
AC 16:16:00 (16 For vivo 1803
Charging hours 16 Model.
minutes)
6. Male Student Redmi Y2 USB 2:16:25 (2 hours AC charging mode is
Charging 16 minutes) more suitable and
has long lasting
battery power.
AC 04:53:41 (4 For Redmi Y2
Charging hours 53 Model.
minutes)
7. Female Engineer SM-A507FN USB 3:20:15 AC charging mode is
Charging more suitable and has
(3 hours 20 long lasting battery
minutes) power.
AC 5:40:22 For SM-A507FN
Charging Model.
(5 hours 40
minutes)
8. Male Engineer SM-J730GM USB 2:50:12 AC charging mode is
Charging more suitable and has
863
ISSN: 2005-4289 IJDRBC
Copyright ⓒ2020 SERSCInternational Journal of Disaster Recovery and Business Continuity
Vol.11, No. 3, (2020), pp. 846–867
(2 hours 50 long lasting battery
minutes) power.
For SM-J730GM
AC 4:45:36 Model.
Charging
(4 hours 45
minutes)
9. Female Student Moto G (5) USB 3:54:19 AC charging mode is
Plus Charging more suitable and has
(3 hours 54 long lasting battery
minutes) power.
AC 6:40:46 For Moto G (5) Plus
Charging Model.
(6 hours 40
minutes)
10. Male Engineer Oppo F15 USB 4:40:16 USB charging mode
Charging is more suitable and
(4 hours 40 has long lasting
minutes ) battery power.
AC 2:25:45 For Oppo F15 Model.
Charging
(2 hours 25
minutes)
5.4 Analysis of Charging Patterns of Users
To study and analyze :
i. The mobile phone charging patterns of users.
ii. The mobile battery and its consumption capacity.
Figure 10 shows the average plug in and plug out battery percentage of different mobile handsets. The
plug-in time varies between 0-50% and plug out time in between 70-100%.
100
90
Battery Percentage
80
70
60
50
40
30
20
10
0
Mobile Handset Models
Plug In Time Battery % Plug Out Time Battery %
Figure 10: Comparative Plug In & Plug Out battery percentage with the mobile handsets
6. Discussion
The Random Forest & KNN algorithm has classified maximum number of correct instances or least
misclassified instances; hence Random Forest & KNN are the best fit classification algorithms of the
dataset. (Table 5) The electricity required to charge a group of mobile phones in a household is almost
equivalent to run an Air Conditioner in the same household. (Figure 9) Hence; the Mobile phone Usage
864
ISSN: 2005-4289 IJDRBC
Copyright ⓒ2020 SERSCInternational Journal of Disaster Recovery and Business Continuity
Vol.11, No. 3, (2020), pp. 846–867
are directly proportional to the increasing Energy consumption and the other electric devices such as
Air Conditioners are not only responsible. The best mode of charging is determined on the average
long-lasting battery charging capacity; the best mode depends on the mobile handsets. On an average
Direct Charging (AC) Mode is most efficient way to do the charging of phones to keep the battery
power long lasting. (Table 6). The study and analysis of collected dataset gives more interesting results
such as: 1. The plug-in time varies between 0-50% and plug out time in between 70-100%.(Figure 10)
and 2.
7. Conclusion and Future Research Directions
The research shows the impact of increasing population of mobile users on power consumption and
gives the thorough comparison of different mobile phone charging methods. The results also show the
comparative scenarios of power consumption between Air Conditioners and Mobile Phones. On the
basis of the results the conclusion is that the power consumption required to charge a group of mobile
phones is equivalent to other electrical appliances like Air Conditioners.
In future work, the research can be done on different geographical part as the temperature, humidity
varies as per the different environment and landmarks, and these variables affects the electricity
consumption, hence the results may vary according to the region and its respective climate. And to give
new horizons to the research, the researchers can also include the varying temperature, seasons,
humidity while doing the analysis.
8. Acknowledgement & Funding Statement
This research was supported by “Microsoft Azure: AI for earth”. We would like to thank “Sakal India
Foundation” for research scholarship (Grant).
9. Author’s Note
The author(s) declare(s) that there is no conflict of interest regarding the publication of this article.
Authors confirmed that the data and the paper are free of plagiarism.
References
1. Al-Ayyoub, M., Y. Jararweh, L. Tawalbeh, E. Benkhelifa and A. Basalamah. 2015.
Power Optimization of Large-Scale Mobile Cloud Computing Systems. 3rd
International Conference on Future Internet of Things and Cloud, Rome. 670-674. doi:
10.1109/FiCloud.2015.126.
2. Alexander T.; Per Sieverts N. and Henrik M. 2018. Electricity Consumption Clustering
Using Smart Meter Data. MDPI Journal, Energies 11, 859. doi:10.3390/en11040859.
3. Ambrosio, R., Brous J., Carlon T. A., Chassin D. P. et. al. 2007. Demonstration Projects
Part I. Olympic Peninsula Project, Pacific Northwest GridWise™ Testbed.
4. Bahwaireth, K. S., L. Tawalbeh, A. Basalamah, Y. Jararweh and M. Tawalbeh, 2015. Efficient
techniques for energy optimization in Mobile Cloud Computing, IEEE/ACS 12th International
Conference of Computer Systems and Applications (AICCSA), Marrakech. 1-8. doi:
10.1109/AICCSA.2015.7507267.
5. Balasubramanian, N., A. Balasubramanian, A. Venkataramani. 2009. Energy Consumption in
Mobile Phones: A Measurement Study and Implications for Network Applications,
Conference: Proceedings of the 9th ACM SIGCOMM Conference on Internet Measurement,
Chicago, Illinois, USA. 4-6. doi: 10.1145/1644893.1644927.
6. Benkhelifa, E., T. Welsh, L. Tawalbeh, Y. Jararweh, A. Basalamah. 2015. User Profiling for
Energy Optimisation in Mobile Cloud Computing. Procedia Computer Science 31(52): 1159-
1165. doi: 10.1016/j.procs.2015.05.151
7. Carroll, A. and G. Heiser. 2010. An analysis of power consumption in a smartphone. In
Proceedings of the 2010 USENIX conference on USENIX annual technical conference
(USENIXATC’10). USENIX Association, USA, 21.
https://dl.acm.org/doi/10.5555/1855840.1855861
8. Clark, P. and T. Niblett. 1989. The CN2 induction algorithm. Mach Learn 3, 261–283.
https://doi.org/10.1007/BF00116835
865
ISSN: 2005-4289 IJDRBC
Copyright ⓒ2020 SERSCInternational Journal of Disaster Recovery and Business Continuity
Vol.11, No. 3, (2020), pp. 846–867
9. Dabbura Imad. 2018. Coding Neural Network — Forward Propagation and Backpropagtion,
towards Data Science.
10. Devlin, M.A. and B. P. Hayes. 2019. Non-Intrusive Load Monitoring and Classification of
Activities of Daily Living Using Residential Smart Meter Data. IEEE Transactions on
Consumer Electronics 65(3):339-348. doi: 10.1109/TCE.2019.2918922.
11. Ding, N., D. Wagner, X. Chen, A. Pathak, Y. C. Hu, and A. Rice. 2013. Characterizing and
modeling the impact of wireless signal strength on smartphone battery drain. In Proceedings of
the ACM SIGMETRICS/international conference on Measurement and modeling of computer
systems (SIGMETRICS ’13). Association for Computing Machinery, New York, USA, 29–40.
doi: https://doi.org/10.1145/2465529.2466586.
12. Fekete, K., K. Csorba, T. Vajk, B. Forstner, and K. Pandi. 2013. Towards an energy efficient
code generator for mobile phones. In Cognitive Info communications (CogInfoCom), IEEE 4th
International Conference, Budapest, Hungary 647-652. doi:
10.1109/CogInfoCom.2013.6719182.
13. Firman, M., A. Saputra, T. Widiyaningtyas, A. Wibawa. 2018. Illiteracy Classification Using
K Means-Naïve Bayes Algorithm. towards Data Science. doi: 10.30630/joiv.2.3.129.
14. Giordano, V., F. Gangale, G. Fulli, M. Sanchez Jimenez, et. al. 2011. Smart Grid Projects in
Europe: lessons learned and current developments. Publications Office of the European Union.
doi:10.2790/32946.
15. Jararweh, Y., L. Tawalbeh, F. Ababneh, F. Dosari. 2013. Resource Efficient Mobile
Computing Using Cloudlet Infrastructure. In Proceedings of the 2013 IEEE 9th International
Conference on Mobile Ad-hoc and Sensor Networks (MSN ’13). IEEE Computer Society, USA,
373–377. https://doi.org/10.1109/MSN.2013.75
16. Liu, N., J. Wang and L. Wang. 2018. Hybrid Energy Sharing for Multiple Microgrids in an
Integrated Heat–Electricity Energy System. IEEE Transactions on Sustainable Energy 10(3):
1139-1151. doi: 10.1109/TSTE.2018.2861986.
17. Liu, Y., L. Xiao, G. Yao and S. Q. Bu. 2019. Pricing-Based Demand Response for a Smart
Home With Various Types of Household Appliances Considering Customer Satisfaction. IEEE
Access 7: 86463-86472. doi: 10.1109/ACCESS.2019.2924110.
18. Lopez, K., C. Gagne and M. A. Gardner. 2019. Demand-Side Management Using Deep
Learning for Smart Charging of Electric Vehicles. IEEE Transactions on Smart Grid 10(3):
2683-2691. doi: 10.1109/TSG.2018.2808247.
19. Osisanwo F.Y., J. E. T. Akinsola, O. Awodele, J. O. Hinmikaiye, O. Olakanmi, J. Akinjobi.
2017. Comparison of various classification algorithms with large data set and more attributes.
International Journal of Computer Trends and Technology (IJCTT) 48 (3). doi:
10.14445/22312803/IJCTT-V48P126.
20. Pabon, M, T. Eveleigh and B. Tanju. 2016. Smart Meter data analytics for optimal
customer selection in demand response programs. Energy Procedia 107: 7-11. doi:
10.1016/j.egypro.2016.12.128.
21. Rice, A. and S. Hay. 2010. Measuring mobile phone energy consumption for 802.11 wireless
networking. Pervasive and Mobile Computing DBLP 6(6):593-606. doi:
10.1016/j.pmcj.2010.07.005
22. Ruiz-Cortes M., E. Gonzalez-Romera, R. Amaral-Lopes. 2019. Optimal Charge/Discharge
Scheduling of Batteries in Microgrids of Prosumers. IEEE Transactions on Energy Conversion
34(1): 468-477. doi: 10.1109/TEC.2018.2878351.
23. Schulman, A., Navda, V., Ramjee, R., Spring, N., Deshpande, P., Grunewald, C., Jain, K.,
Padmanabhan, Venkata NBartendr. 2010. A Practical Approach to Energy-Aware Cellular Data
Scheduling. Proceedings of the Sixteenth Annual International Conference on Mobile
Computing and Networking, Chicago, Illinois, USA 85–96. doi: 10.1145/1859995.1860006.
24. Srikantha, P. and D. Kundur. 2019. Hierarchical Signal Processing for Tractable Power Flow
Management in Electric Grid Networks. IEEE Transactions on Signal and Information
Processing over Networks 5(1): 86-99. doi: 10.1109/TSIPN.2018.2858750.
866
ISSN: 2005-4289 IJDRBC
Copyright ⓒ2020 SERSCInternational Journal of Disaster Recovery and Business Continuity
Vol.11, No. 3, (2020), pp. 846–867
25. Sun, M., Y. Wang, G. Strbac, C. Kang. 2019. Probabilistic Peak Load Estimation in
Smart Cities Using Smart Meter Data. IEEE Transactions on Industrial Electronics
66(2): 1608 – 1618. doi: 10.1109/TIE.2018.2803732.
26. Tawalbeh, L., N. Alassaf, W. Bakheder, and A. Tawalbeh. 2015. Resilience Mobile Cloud
Computing: Features, Applications and Challenges. 2015 Fifth International Conference on e-
Learning (econf), Manama 280-284. doi: 10.1109/ECONF.2015.59.
27. Tawalbeha M., A. Eardleya, Tawalbehb Lo’ai. 2016. The 13th International Conference on
Mobile Systems and Pervasive Computing (MobiSPC 2016) Studying the Energy Consumption
in Mobile Devices, Procedia Computer Science Elsevier B.V Leuven, Belgium 94: 183 – 189.
doi: 10.1016/j.procs.2016.08.028.
28. Ustun, T. S. and Y. Aoto. 2019. Analysis of Smart Inverter’s Impact on the Distribution
Network Operation.” IEEE Access 7: 9790-9804. doi: 10.1109/ACCESS.2019.2891241.
29. Xia, F.; Hsu, C.; Liu, X. et al. 2015. The power of smartphones. Multimedia Systems 21: 87–
101. https://doi.org/10.1007/s00530-013-0337-x
30. Zhai, S., Z. Wang, X. Yan and G. He. 2019. Appliance Flexibility Analysis Considering User
Behavior in Home Energy Management System Using Smart Plugs. IEEE Transactions on
Industrial Electronics 66(2): 1391-1401. doi: 10.1109/TIE.2018.2815949.
31. Zhang, Weiwen, et al. 2013. Energy-optimal mobile cloud computing under stochastic wireless
channel. Wireless Communications. IEEE Transactions on Wireless Communications
12(9):4569-4581. doi: 10.1109/TWC.2013.072513.121842.
32. Zhang, X., Y. Li, S. Lu, H. F. Hamann, B. M Hodge and B. Lehman. 2019. A Solar Time-
Based Analog Ensemble Method for Regional Solar Power Forecasting. IEEE Transactions on
Sustainable Energy 10(1): 268-279. doi: 10.1109/TSTE.2018.2832634.
33. Zhang, Y., K. Meng, W Kong and Z. Y. Dong. 2019. Collaborative Filtering-Based Electricity
Plan Recommender System. IEEE Transactions on Industrial Informatics 15(3): 1393-1404.
doi: 10.1109/TII.2018.2856842.
867
ISSN: 2005-4289 IJDRBC
Copyright ⓒ2020 SERSCYou can also read