Mobility on Demand (MOD) Sandbox Demonstration: Valley Metro Mobility Platform
←
→
Page content transcription
If your browser does not render page correctly, please read the page content below
Mobility on Demand (MOD)
     Sandbox Demonstration:
Valley Metro Mobility Platform
                      Final Report

                          MARCH 2021

                             FTA Report No. 0188
                     Federal Transit Administration

                                      PREPARED BY

                              Angie DeVore, MBA
                   Manager of Project Management
                                      Valley Metro

                                  Ziad Yassine, M.S.
                                 Elliot Martin, Ph.D.
                       Transportation Sustainability
                                   Research Center
                   University of California, Berkeley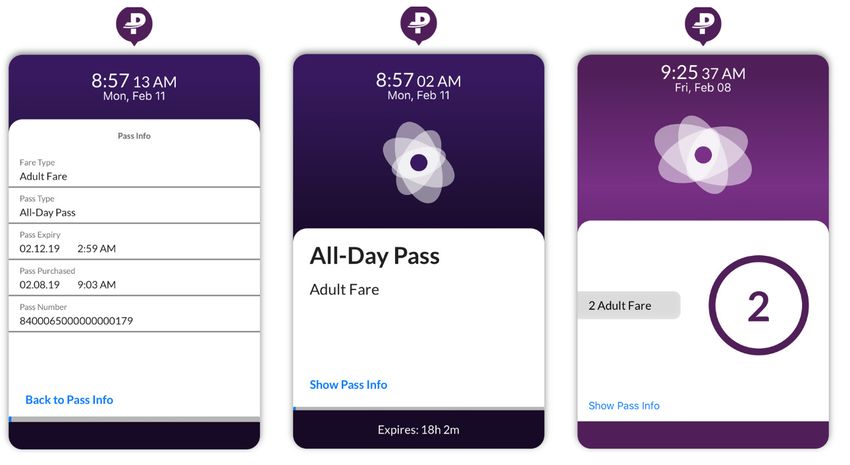
COVER PHOTO
Courtesy of Valley Metro

DISCLAIMER
This document is disseminated under the sponsorship of the U.S. Department of Transportation in the interest of information
exchange. The United States Government assumes no liability for its contents or use thereof. The United States Government
does not endorse products or manufacturers. Trade or manufacturers’ names appear herein solely because they are considered
essential to the objective of this report. The opinions and/or recommendations expressed herein do not necessarily reflect those
of the U.S. Department of Transportation.
Mobility on
Demand (MOD)
Sandbox
Demonstration:
Valley Metro
Mobility Platform
Final Report

MARCH 2021
FTA Report No. 0188

PREPARED BY

Angie DeVore, MBA, Manager of Project Management
Valley Metro
101 North First Avenue, Suite 1400
Phoenix, AZ 85003

Ziad Yassine, M.S.
Elliot Martin, Ph.D.
Transportation Sustainability Research Center
University of California, Berkeley
2150 Allston Way, #280
Berkeley, CA 94704

SPONSORED BY

Federal Transit Administration
Office of Research, Demonstration and Innovation
U.S. Department of Transportation
1200 New Jersey Avenue, SE
Washington, DC 20590

AVAIL ABLE ONLINE

https://www.transit.dot.gov/about/research-innovation

                 FEDERAL TRANSIT ADMINISTRATION         i
            FEDERAL TRANSIT ADMINISTRATION              i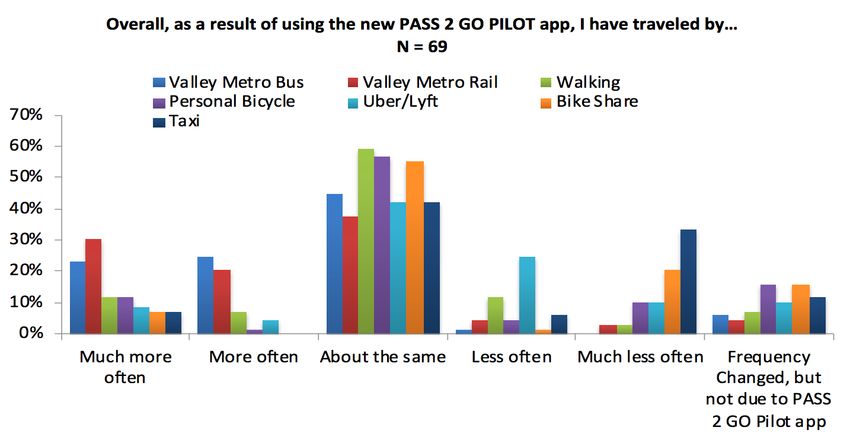
Metric Conversion Table

SYMBOL    WHEN YOU KNOW              MULTIPLY BY              TO FIND              SYMBOL

                                      LENGTH

  in            inches                    25.4                millimeters            mm

  ft              feet                   0.305                  meters                m

  yd             yards                   0.914                  meters                m

  mi             miles                    1.61                kilometers             km

                                      VOLUME

 fl oz        fluid ounces               29.57                 milliliters           mL

 gal            gallons                  3.785                    liter                   L

  ft3          cubic feet                0.028               cubic meters             m3

 yd3          cubic yards                0.765               cubic meters             m3

                NOTE: volumes greater than 1000 L shall be shown in m3

                                        MASS

  oz            ounces                   28.35                  grams                 g

  lb            pounds                   0.454                kilograms               kg

                                                              megagrams
  T       short tons (2000 lb)           0.907                                    Mg (or “t”)
                                                           (or “metric ton”)

                             TEMPERATURE (exact degrees)

  o                                    5 (F-32)/9                                     o
      F       Fahrenheit                                        Celsius                   C
                                      or (F-32)/1.8

                                                                   FEDERAL TRANSIT ADMINISTRATION    i
                                                              FEDERAL TRANSIT ADMINISTRATION        ii
1. Form Approved
REPORT DOCUMENTATION PAGE OMB No. 0704-0188
The public reporting burden for this collection of information is estimated to average 1 hour per response, including the time for reviewing instruc-
tions, searching existing data sources, gathering and maintaining the data needed, and completing and reviewing the collection of information. Send
comments regarding this burden estimate or any other aspect of this collection of information, including suggestions for reducing the burden, to
Department of Defense, Washington Headquarters Services, Directorate for Information Operations and Reports (0704-0188), 1215 Jefferson Davis
Highway, Suite 1204, Arlington, VA 22202-4302. Respondents should be aware that notwithstanding any other provision of law, no person shall be
subject to any penalty for failing to comply with a collection of information if it does not display a currently valid OMB control number.
1. REPORT DATE 2. REPORT TYPE 3. DATES COVERED
March 2021 Final January 2017–December 2019
4. TITLE AND SUBTITLE 5a. CONTRACT NUMBER
Mobility on Demand (MOD) Sandbox Demonstration: Valley Metro Mobility Platform,
Final Report
5b. GRANT NUMBER
5c. PROGRAM ELEMENT NUMBER
6. AUTHOR(S) 5d. PROGRAM NUMBER
Angie DeVore (Valley Metro), Ziad Yassine, Elliot Martin (UC Berkeley) 5e. TASK NUMBER
7. PERFORMING ORGANIZATION NAME(S) AND ADDRESSE(ES) 5f. WORK UNIT NUMBER
Valley Metro
8. PERFORMING ORGANIZATION REPORT
101 North First Avenue, Suite 1400, Phoenix, AZ 85003
NUMBER
Transportation Sustainability Research Center FTA Report No. 0188
University of California, Berkeley
2150 Allston Way, #280, Berkeley, CA 94704
9. SPONSORING/MONITORING AGENCY NAME(S) AND ADDRESS(ES) 10. SPONSOR/MONITOR'S ACRONYM(S)
U.S. Department of Transportation FTA
Federal Transit Administration
Office of Research, Demonstration and Innovation 11. SPONSOR/MONITOR'S REPORT NUMBER(S)
1200 New Jersey Avenue, SE, Washington, DC 20590
12 . DISTRIBUTION/AVAILABILITY STATEMENT
Available from: National Technical Information Service (NTIS), Springfield, VA 22161; (703) 605-6000, Fax (703) 605-6900,
email [orders@ntis.gov]; Distribution Code TRI-30
13. SUPPLEMENTARY NOTES NOTES [www.transit.dot.gov/about/research-innovation] [https://www.transit.dot.gov/about/research-innovation]
[https://doi.org/10.21949/1520674 Suggested citation: Federal Transit Administration. Mobility on Demand (MOD) Sandbox Demonstration: Valley
Metro Mobility Platform, Final Report. Washington, D.C.: United States Department of Transportation, 2021. https://doi.org/10.21949/1520674
14. ABSTRACT
Valley Metro is actively communicating the value of transit in connecting communities and enhancing lives by exploring innovative solu-
tions to bolster the customer experience and responding to changing values. Through the Mobility on Demand (MOD) Sandbox Program, FTA
empowered Valley Metro to explore innovative business models and partnerships to deliver high-quality, seamless, and equitable mobility
options. Valley Metro’s MOD Sandbox Demonstration project, the Pass2Go® pilot app, enables users the ability to pay for fares, plan trips, and
obtain transportation information in a more convenient and customizable solution. This report discusses the project goals and evolution in
addition to key challenges and lessons learned during its planning and execution.
15. SUBJECT TERMS Transit, multimodal trip planning, fare payment, mobile ticket purchasing, smartphone app, travel behavior impacts
16. SECURITY CLASSIFICATION OF: 17. LIMITATION OF 18. NUMBER 19a. NAME OF RESPONSIBLE PERSON
ABSTRACT OF PAGES
a. REPORT b. ABSTRACT c. THIS PAGE 46
Unclassified Unclassified Unclassified 19b. TELEPHONE NUMBER
Standard Form 298 (Rev. 8/98)
Prescribed by ANSI Std. Z39.18TABLE OF CONTENTS
1 Executive Summary
4 Section 1: Introduction
6 Section 2: Project Description
10 Section 3: Project Evolution
15 Section 4: Evaluation
31 Section 5: Conclusions and Recommendations
36 Acronyms/Abbreviations
37 References
FEDERAL TRANSIT ADMINISTRATION ivLIST OF FIGURES
7 Figure 2-1: Day passes purchased through Pass2Go® app
8 Figure 2-2: Trip planning using Pass2Go® app
16 Figure 4-1: Household size distribution (Waves 1–3)
16 Figure 4-2: Housing type distribution (Waves 1–3)
17 Figure 4-3: Household income distribution (Waves 1–3)
17 Figure 4-4: Highest education level distribution (Waves 1
through 3 Waves 1–3)
18 Figure 4-5: Race or ethnicity distribution (Waves 1–3)
18 Figure 4-6: Vehicle ownership distribution (Waves 1–3)
19 Figure 4-7: Transportation mode use distribution (Waves 1–3)
20 Figure 4-8: Before/after change in transportation mode use (Waves 1–3)
20 Figure 4-9: Change in planning times as a result of Pass2Go® pilot
(Waves 1–3)
21 Figure 4-10: Change in wait times as a result of Pass2Go® pilot
(Waves 1–3)
21 Figure 4-11: Change in access to public transit as a result of Pass2Go® pilot
(Waves 1–3)
22 Figure 4-12: Change in use of on-demand transportation as a result of
Pass2Go® pilot (Waves 1–3)
23 Figure 4-13: Household size distribution (Wave 4)
24 Figure 4-14: Household income distribution (Wave 4)
24 Figure 4-15: Highest education level distribution (Wave 4)
25 Figure 4-16: Race or ethnicity distribution (Wave 4)
25 Figure 4-17: Vehicle ownership distribution (Wave 4)
26 Figure 4-18: Transportation mode use distribution (Wave 4)
26 Figure 4-19: Change in planning times as a result of Pass2Go® pilot (Wave 4)
27 Figure 4-20: Change in wait times as a result of Pass2Go® pilot (Wave 4)
27 Figure 4-21: Effect of access to transit passes on public transit use (Wave 4)
28 Figure 4-22: Use of Pass2Go® in a different city (Wave 4)
28 Figure 4-23: Impact of Pass2Go® pilot availability (Wave 4)
29 Figure 4-24: Pass2Go® pilot used features (extended tester survey)
29 Figure 4-25: Impact of Pass2Go® pilot availability (extended tester survey)
30 Figure 4-26: Impact of Pass2Go® pilot on transportation mode use
(extended tester survey)
LIST OF TABLES
13 Table 3–1: Study Participation Results (Waves 1–4)
FEDERAL TRANSIT ADMINISTRATION vACKNOWLEDGMENTS
There were several contributors to this project and this report. Valley
Metro would like to thank WestGroup Research, including Kathy DeBoer
and Stephanie Apostol, for their design and implementation of the study that
informed the evaluation of this project. Valley Metro would also like to thank
Routematch, including Katie Charles and Rob Bryans, for their work toward the
implementation of the Pass2Go® app and Transit Data Platform. WestGroup
research made contributions to the survey questions, and UC Berkeley made
contributions leading the survey and evaluation design and data analysis. Finally,
Valley Metro would like to thank the Federal Transit Administration for its
funding and oversight of this project.
ABSTRACT
Valley Metro is actively communicating the value of transit in connecting
communities and enhancing lives by exploring innovative solutions to bolster the
customer experience and responding to changing values. Through the Mobility
on Demand (MOD) Sandbox Program, FTA empowered Valley Metro to explore
innovative business models and partnerships to deliver high-quality, seamless,
and equitable mobility options. Valley Metro’s MOD Sandbox Demonstration
project, the Pass2Go® pilot app, provided users with the ability to pay for fares,
plan trips, and obtain transportation information through a more convenient and
customizable solution. This report discusses the project goals and evolution as
well as key challenges and lessons learned during its planning and execution.
FEDERAL TRANSIT ADMINISTRATION viEXECUTIVE The Federal Transit Administration (FTA) has led the Mobility on Demand
SUMMARY (MOD) Sandbox Program aimed at exploring how new technologies can be
incorporated to complement and support the traditional functions of public
transit. Valley Metro, the regional public transportation authority of Maricopa
County, Arizona, was selected as one of 11 recipients of FTA’s MOD Sandbox
Demonstration projects. Valley Metro provides multimodal transit options,
including regional bus and light rail systems, to the 4.25 million residents of
Maricopa County (US Census, 2018). It developed the RidekickTM mobile
application (app) that functions as a basic trip planner for light rail and buses;
however, the existing app had limited features and was not accessible for
people with disabilities. Thus, the Valley Metro MOD Sandbox project, Mobility
Platform, was created to provide an updated version of the app with innovative
features. The Pass2Go® app was designed to improve trip planning, provide a
mobile single ticketing and payment system, and connect users with multiple
public and private transportation options.
The envisioned project was planned in two phases—Phase I included developing
Pass2Go® as a trip planner with real-time information and a single payment
system for public transit, and Phase II included integrating on-demand ride
sourcing services into the mobile app environment. Phase II programming was
completed for ridesourcing services; however, the project was unable to move
forward, as Lyft was not able to delegate the resources needed to move the
programming into the mobile environment.
The Valley Metro project had multiple objectives:
• Reducing trip planning, wait, and travel times.
• Encouraging the adoption of mobile-based technology for public transit.
• Improving first/last mile connectivity.
• Improving accessibility and trip planning methods for travelers with
disabilities.
• Enhancing the traveler experience.
• Providing an open data platform that allows transit agencies to exchange
travel information.
• Producing lessons learned for future projects.
To test and evaluate user response to the Pass2Go® app and its support to
the existing public transit system, Valley Metro contracted with WestGroup to
develop and implement a user survey. The study was set up in a series of four
three-month waves in which participants in each wave were required to take
a pre-study survey, use the Pass2Go® app, and then take a post-study survey.
An independent evaluation of the Valley Metro MOD Sandbox Demonstration
was conducted under a separate contract with the U.S. Department of
Transportation (USDOT) to determine the success of the project in meeting
FEDERAL TRANSIT ADMINISTRATION 1EXECUTIVE SUMMARY
its objectives. Valley Metro and WestGroup collaborated with the independent
evaluator throughout the project. Paired observations from both surveys as well
as app activity and payment data, the project’s open data platform, and insights
from expert (stakeholder/project partner) interviews were later used by the
independent evaluation team for analysis.
Overall, the analysis showed that the Pass2Go® app was an enhancement over
the existing RidekickTM app. Results showed that trip planning and wait times
were reduced, real-time information for public transit and planning methods were
improved, and accessibility was enhanced for travelers with disabilities.
The project encountered some technical and contractual challenges. From a
management perspective, it was important to reduce the size of the project
management team to facilitate response time and gain consensus. However,
a larger advisory group remained and was able to be involved and provide
feedback about the project. There was no specified timeline to establish project
partnerships, but it was noted that discussing strategies with potential partners
at the beginning of the project can be useful. This helps identify mutually-desired
objectives with a clear assessment of individual control and responsibilities. The
project’s open data platform allowed transit agencies to exchange information
and lessons learned which minimized duplication and increased productivity.
With respect to project evaluation, producing sufficient and usable data was
crucial to conduct an accurate analysis. Documenting the data collection
and management approach in addition to regularly communicating with the
independent evaluator proved beneficial for this purpose. For future projects, it
would be best for the project’s team to conduct an initial review and analysis of
the data followed by a more detailed analysis by the independent evaluator. In
addition, the hiring of a professional market research team helped with collecting
representative data by identifying target participants that were willing to provide
data throughout their ongoing participation.
From an operational perspective, internal and external communication was a key
challenge to guarantee that different operators understood how the mobile ticket
worked. For this purpose, Valley Metro conducted presentations and trainings
for bus and rail operators and other members of the operations teams. Another
challenge was testing the developed accessibility features for both Android and
iOS, for which a professional testing firm was hired. A technical support system
was developed to report bugs and issues and track their resolution status.
Although the fully accessible Pass2Go® app enabled users to receive General
Transit Feed Specification (GTFS) information, plan their trips, and purchase ride
passes for public transportation modes, it did not successfully integrate non-
Valley Metro operated transportation services, such as Lyft and GR:D Bike Share,
into a single payment system. The software development partner, Routematch,
FEDERAL TRANSIT ADMINISTRATION 2EXECUTIVE SUMMARY
formed a relationship with the Transportation Network Company (TNC)
partner, Lyft, as there were significant concerns around data privacy and working
with a government entity. After this relationship was established, Routematch
received the application programming interface (API) keys and wrote the
integration to establish a single payment solution for both the transit ticket and
the Lyft ride cost. Unfortunately, Lyft was unable to move this into the mobile
environment.
Pass2Go® was closed down, and the MOD Sandbox Demonstration ended in
December 2019. Building on the experience and lessons learned with it, Valley
Metro and partner agencies are moving on to new developments to continue
and expand on the functionality achieved during the project. Currently, the City
of Phoenix has procured a new fare collection system with VIX and Unwire,
which has an existing robust mobile app. The City of Phoenix and Valley Metro
ultimately opted to simplify the systems to use a single app that incorporates
multimodal transportation options and real-time transit information in a single
ticketing and payment system for different fare types. However, the lessons
learned from Pass2Go® deployment will serve to inform this new venture and
build upon its evaluated performance.
FEDERAL TRANSIT ADMINISTRATION 3SECTION
Introduction
1 Valley Metro is the regional public transportation authority providing
coordinated multimodal transit options to residents of greater Phoenix and
the Maricopa County urbanized areas in Arizona. Founded in 1993, the system
operates a 38-station light rail line and over 100 bus routes, including 61 local
routes and 20 commuter express routes. With an annual ridership exceeding
65 million rides per year, it is Arizona’s largest transit agency. Valley Metro
faces many of the first/last-mile challenges typical of transit agencies in the
present day; it operates in an environment with relatively high auto ownership
and navigates the complexities of delivering transit services to a region that
spans multiple jurisdictions and land-use environments while trying to keep
pace with the ever-advancing state of information technologies. Providing
transit services within this operational climate requires advancing the state
of practice with respect to customer interfaces. This includes improving the
capabilities of trip planning, payments, and first/last-mile connectivity.
In May 2016, the Federal Transit Administration (FTA) announced an $8 million
Public Transportation Innovation funding opportunity for Mobility on Demand
(MOD) Sandbox Demonstrations. In October 2016, Valley Metro was selected
as one of 11 MOD Sandbox Demonstration projects, Mobility Platform.
Valley Metro proposed the Mobility Platform project to address limitations
within its existing mobile application (app), RidekickTM , which provides trip
planning for light rail and buses. Valley Metro sought to improve trip planning
features, including its accessibility for people with disabilities, and to develop
an integrated app-based payment mechanism for its public transit services and
connecting private transportation modes, such as Transportation Network
Companies (TNCs). The app developed and tested within this initiative was
called Pass2Go®.
The project built on the functionality of the RidekickTM app through the
development of features not previously available. These enhanced features
included a fully-accessible transit app providing users with the ability to
purchase tickets for public transit in addition to improvements to the trip
planning functionality. The broader objective of these enhancements was
to improve the level of connectivity and accessibility throughout the transit
network, decrease the first/last-mile challenges facing riders, and allow
users to more easily pay for and plan their trips on a mobile platform. These
capabilities within a mobile platform also produced useful data, and the mobile
application permitted Valley Metro to measure ridership activity. Finally, the
project sought to improve connectivity with private transportation providers,
FEDERAL TRANSIT ADMINISTRATION 4SECTION 1: INTRODUCTION
including TNC options. This included an effort to integrate connections with
Lyft, whereby users would be able to book Lyft rides from within the app.
The project met most of its stated goals and delivered an improved app
experience to users within a test environment. One objective—integration
with the TNC within the app—was attempted with considerable good-
faith effort but ultimately not achieved. The project was implemented and
evaluated via surveys of users within four three-month waves. Three of those
waves were used to inform results presented by an independent evaluation
sponsored by the U.S. Department of Transportation (USDOT) and are
included in this report. Selected preliminary results from the final wave are
briefly summarized, with additional analysis in this report. The waves required
participants to use the app at least four times per month for three months and
complete pre- and post-study surveys. This report provides project insights
from Valley Metro’s experience implementing the MOD Sandbox Project.
In the sections that follow, the report details the project description and
evolution, results from data collection and analysis, and key conclusions and
lessons learned.
FEDERAL TRANSIT ADMINISTRATION 5SECTION
Project Description
2 Overview
The Valley Metro MOD Sandbox Demonstration project was designed around its
Pass2Go® app, which initially aimed to provide improved multimodal trip planning,
first/last-mile connections, mobile ticketing and payment, incident reporting, and a
link to other app-based transportation options.
Valley Metro has provided a RidekickTM mobile application for its users that features
trip planning for light rail and buses. The proposed Valley Metro Mobility Platform
was built on the existing functionality of RidekickTM by developing and testing
features not available to users. The initially-envisioned platform enabled users to
receive General Transit Feed Specification (GTFS) information, plan their trips, and
purchase ride passes for public transportation modes. The enhanced integration
was planned to improve the level of connectivity throughout the transit network,
decrease the first/last-mile challenge facing public transportation users, and allow
them to smoothly complete their trips from origin to destination all within a fully-
accessible app. It was also planned to incorporate private ride sourcing services into
the mobile application through its own application programming interfaces (APIs).
Thus, the project was divided into two phases—Phase I included developing the
app as an accessible trip planner that supports mobile ticketing and shows nearby
transit stops, and Phase II included the integration of GTFS data for public transit in
a fully-accessible application. Devices that support real-time travel information were
installed on transit buses; however, that information was not publicly available at the
conclusion of this project. Also, in Phase II, a multimodal trip planning feature was
planned to provide links to GR:D BikeShare, Lyft, and Uber. The Lyft integration
code was written but not executed, as Lyft was unable to move the programming
into the mobile app environment. Additionally, incident reporting (e.g., passenger
misconduct, disruptive behavior, illegal activity) via the app was discussed with
LiveSafe, but LiveSafe was not able to make the features work on the scale needed.
Project Goals
The Valley Metro MOD Sandbox Project had a number of objectives:
• Reducing traveler trip planning, wait, and travel times.
• Encouraging adoption of mobile-based technology and reducing the amount of
paper-based tickets and onboard cash pay.
• Improving first/last-mile connectivity.
• Improving accessibility of the mobile app and enhancing trip planning methods
for travelers with disabilities.
• Enhancing the customer experience through improved traveler information.
FEDERAL TRANSIT ADMINISTRATION 6SECTION 2: PROJECT DESCRIPTION
• Providing an open data platform that allows transit agencies to view and
exchange travel information.
• Producing lessons learned and recommendations for future projects through
expert (stakeholder/project partner) interviews.
Project Information
Problem Addressed
Valley Metro provides multimodal transit options to about 4.25 million residents.
It plans and operates regional bus and light rail systems and has provided the
RidekickTM mobile application as a trip planning tool for travelers. However, the
application was noted for having limited trip-planning features for multimodal trips,
and it was not accessible for some people with disabilities. Travelers would need
to access different mobile applications to plan, use, and pay for a multimodal trip
from their origin to their destination. Thus, Valley Metro envisioned a new mobile
application, Pass2Go®, as an accessible trip-planning platform providing real-time
transit information with public and private transportation options in addition to an
integrated payment system. This aligned with the primary objective of the MOD
Sandbox initiative to incorporate new technologies that complement and support
the traditional functions of public transit.
Valley Metro launched and deployed the Pass2Go® app to develop, test, and
evaluate user response to the integration of these features into the Valley Metro
public transit system. The app was designed to provide users with trip-planning
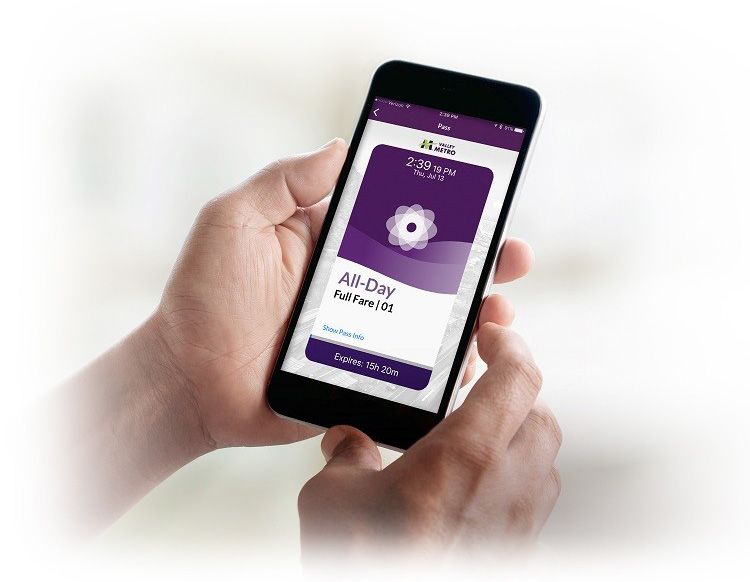
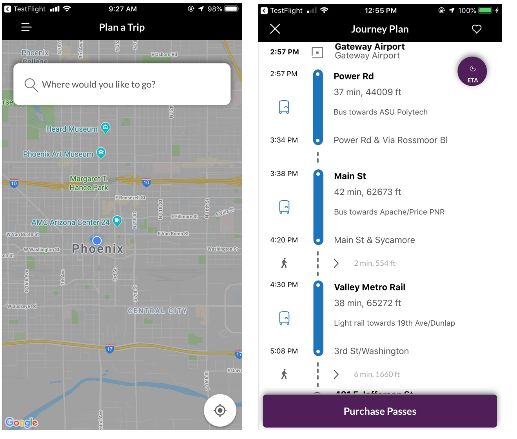
capabilities and allow them to purchase transit tickets. Figure 2-1 and Figure 2-2
provide example screen shots of key app functionalities.
Figure 2-1
Day passes purchased
through Pass2Go® app
FEDERAL TRANSIT ADMINISTRATION 7SECTION 2: PROJECT DESCRIPTION
Figure 2-2
Trip planning using
Pass2Go® app
The project was divided into Phase I and Phase II. Phase I was deployed in
2018, and Phase II was delayed and ultimately not fully implemented due to
unanticipated challenges. Minor app improvements implemented in Phase
II included accessibility fixes, addition of group passes, simplified checkout
process for saved cards, a next-ride feature, and interface updates.
Valley Metro contracted with WestGroup Research to develop and implement
a series of surveys in four waves. Each wave was designed as a before-and-
after survey implemented over successive periods of three months. During
these waves, respondents were recruited, invited to take a before survey in
the beginning, use the Pass2Go® app, and then take an after survey at the
end of the three-month period. Waves 1 through 3 took place in Phase I, and
wave 4 took place in Phase II. Data from the waves was compiled, and the
independent evaluation team received and analyzed the data in accordance
with an evaluation plan for the purposes of completing an independent
evaluation.
Outcomes
Evaluation of Phase I of the project showed that the Pass2Go® pilot app was
an enhancement over the existing RidekickTM app. The analysis, presented
FEDERAL TRANSIT ADMINISTRATION 8SECTION 2: PROJECT DESCRIPTION
in the independent evaluation report and based on 12 hypotheses, showed
that the project reduced user waiting and planning times, enhanced their
trip planning methods and access to real-time information, and improved
their accessibility and connectivity to multiple transportation options. Also,
the platform allowed Valley Metro and WestGroup Research the ability to
exchange travel information and produce lessons learned for future projects.
FEDERAL TRANSIT ADMINISTRATION 9SECTION
Project Evolution
3 Before the MOD Sandbox project, Valley Metro provided the RidekickTM
mobile application as a trip planning tool for travelers, and it was still the
primary public facing app of Valley Metro during the project. Valley Metro
developed the idea for the improved Pass2Go® mobile application with
additional features and engaged various stakeholders about its development,
including the Maricopa Association of Governments (MAG) and the City of
Phoenix. Over time, stakeholder engagement and coordination evolved across
the agencies at multiple levels. The process eventually involved approximately
60 people wanting to be part of the planning process. Valley Metro realized
that the size of the project management team was becoming large and assigned
the effort to a smaller project management team with a larger advisory
group that could still be involved and provide feedback in the Pass2Go®
development.
The project faced a tough start, as partners were overly optimistic on the time
needed to address several technical challenges. Valley Metro and Routematch,
the project’s technology partner and app developer, had established an
ambitious timeline for the project. One of the challenges presented by the
timeline was meeting its goals while maintaining the rigors required of the app
development cycle and all its required steps. For the app development process,
it was important to research integration points such as payments, next stops,
and trip planning to ensure compatibility. Certain safety and security features,
such as the integration with the LiveSafe app allowing passengers to report
incidents as they were in progress or request assistance from the Operations
Control Center (OCC), were dropped because of challenges with software
limitations surrounding the size and scope of the geographic area.
It was clear very early on that a third party would be needed to confirm or
provide feedback on accessibility improvements, including confirming the
implementation of a number of features or functional attributes (called Success
Criterion), as listed below:
• Name, Role, Value – To ensure that assistive technologies (AT) can gather
information about, activate (or set) and keep up-to-date on the status of user
interface controls in the content.
• Contrast (Minimum) – To provide enough contrast between text and its
background so that it can be read by people with moderately low vision.
• Keyboard – To ensure that, wherever possible, content can be operated
through a keyboard or keyboard interface (so an alternate keyboard can be
used).
FEDERAL TRANSIT ADMINISTRATION 10SECTION 3: PROJECT EVOLUTION
• Focus Visible – To help a person know which element has the keyboard
focus.
• Focus Order – To ensure that when users navigate sequentially through
content, they encounter information in an order that is consistent with the
meaning of the content and can be operated from the keyboard.
One goal of the project was to incorporate the use of paratransit service
into the app, but a challenge was that Valley Metro does not have oversight
of paratransit throughout the area. Due to these technical and jurisdictional
complexities, the paratransit features were dropped.
Another challenge involved the integration of LiveSafe into the app. LiveSafe’s
application developer conducted a thorough review and determined that
it could not meet the complex requirements to support a region-wide
transportation system. Other LiveSafe installations were primary geofenced
within college campuses and sports arenas.
The project encountered challenges advancing agreements with TNCs using
traditional contracting terms and vendor relationships. For Valley Metro, TNC
partners initially were very interested in integrating their services into the
new app. However, there were concerns about data protection, particularly
given that Arizona has a relatively open public records law. To overcome these
challenges, Valley Metro decided to have Routematch form a relationship
directly with Lyft, as no rides were being subsidized by Valley Metro or with
FTA funds. In addition to data concerns, Lyft expressed concerns about the
user experience and functions (i.e., Pass2Go® app interface) that would occur
outside of Lyft’s app.
Routematch had already worked with Lyft on another project whereby it
developed an integration for another agency that subsidized a portion of
its fares. To overcome the integration challenge of the Pass2Go® project,
Routematch obtained from Lyft an application API compatible with a mobile
environment similar to that developed for another entity that had a subsidized
fare program. This enabled Valley Metro’s integration to build off of this
previous development. As a result, the Mobility Platform project was planned
to be implemented in two phases—Phase I included accessibility improvements
such as next stop identification, mobile ticketing, and screen reading to the
app, and Phase II included the integration of GTFS data for public transit in a
fully-accessible application. Devices that support real-time travel information
were installed on transit buses; however, that information was not yet publicly
available at the conclusion of this project. Another goal in Phase II was
integrating ridesourcing services within the app. Ultimately, despite good-faith
efforts to achieve TNC integration, Phase II was initiated but not successfully
completed.
FEDERAL TRANSIT ADMINISTRATION 11SECTION 3: PROJECT EVOLUTION
The pilot study targeted participants who were periodic riders using daily
passes for public transit. Valley Metro hired WestGroup Research, a well-
known market research firm familiar with the local area, to assist with
participant recruitment and to develop an implementation strategy to
incentivize participants and solicit feedback. The project team decided to
implement the study in four three-month waves. Participants were asked to
use the pilot app a minimum of four times per month for three months and
complete before and after surveys for a one-time gift card incentive. Results
from the surveys were provided to the independent evaluator for analysis
and reporting. At the time of the MOD Sandbox Demonstration award,
WestGroup was in the middle of a pre-existing five-year contract with Valley
Metro, which allowed Valley Metro to bring its expertise into the project as
part of that existing relationship. WestGroup linked its project management
software with Routematch through an API to enable information-sharing
between them for the pilot participation. WestGroup found that a high level
of personal engagement was necessary. Initial pilot recruitment was conducted
predominantly through social media, e-mail marketing, and news stories.
Prospective users who passed an on-line pre-qualification survey were placed
into an internal dashboard, which was a management software used to track
participation and communicate with participants.
WestGroup then called these individuals to make sure they understood
the program’s terms, conditions, and requirements. The API also allowed
WestGroup to provide targeted marketing and technical support throughout
the pilot. Project stakeholders indicated that personal assistance was
particularly valuable for iOS users who had a more complicated sign-up and
installation process via the Apple store.
The recruitment process was subject to considerable attrition. Recruitment
statistics from Waves 1 through 4 revealed that about 53% of the 3,222 who
completed the recruitment survey passed this screener. However, only 49%
of this 53% (~26% of the 3,222) fully registered to participate. Of this smaller
fully-registered population, only 50% fully completed Waves 1 through 4. This
means that of those who started the process, only about 13% made it all the
way through the study and completed the requirements. This attrition rate
shows the common challenges with maintaining sustained participation in the
study. Table 3–1 presents the summarized participation statistics, those who
fully registered to participate, for Waves 1 through 4.
FEDERAL TRANSIT ADMINISTRATION 12SECTION 3: PROJECT EVOLUTION
Table 3-1
Study Participation Results (Waves 1–4)
Pass2Go® Pilot – Recruit Info Wave 1 Wave 2 Wave 3 Wave 4 Total
Completed recruit survey 680 682 804 1,056 3,222
Disqualified/screened out 324 295 346 413 1,378
Qualified, opted out at end of recruit survey 66 18 32 31 147
Qualified to participate via recruit survey 290 369 426 612 1,697
Registration and Participation Wave 1 Wave 2 Wave 3 Wave 4 Total
Fully registered to participate 166 199 274 195 834
Dropped out 64 96 127 118 405
Current participants 101 103 147 77 428
Completed pre-evaluation survey 101 103 147 77 428
Registered in Pass2Go® pilot app 100 103 147 77 427
Ready to Go! (pre-eval + app) 100 103 147 77 427
Completed post-evaluation survey/completed study 86 103 147 77 413
App Pass Purchases & Activations Wave 1 Wave 2 Wave 3 Wave 4 Total
Purchased 1 or more passes 105 121 188 91 505
Activated 1 or more passes 105 116 184 86 491
Activated 4+ unique passes 95 106 161 74 436
Activated 6+ unique passes 90 104 151 71 416
Activated 8+ unique passes 90 104 151 65 410
Activated 10+ unique passes 86 103 149 54 392
Activated 12+ unique passes (study requirement) 86 103 147 41 377
Goal:
Wave Notes Complete Complete Complete Complete 400 Total
Completes
Another component in the evolution of Pass2Go® was communication and
training for bus drivers, rail operators, security, and operations teams to
understand how the pass functioned. Valley Metro released several documents
including internal memoranda, frequently asked questions (FAQs), PowerPoint
training presentations, and posters for operations and customer service
facilities. Valley Metro also had internal monitors with custom messages
and held team-building and lunchtime activities to demonstrate the app on
different devices and what constituted a valid pass. At times, Valley Metro
had challenges conducting outreach to contractors it did not directly employ.
Valley Metro Regional Public Transportation Authority (RPTA) is one of
two major operators providing regional service marketed as “Valley Metro”
and, together with the City of Phoenix, they contract with several private
providers. This resulted in occasional situations in which riders would
encounter bus operators unfamiliar with the app-based pass, thus requiring
app users to purchase another pass. Valley Metro also created a webpage with
FEDERAL TRANSIT ADMINISTRATION 13SECTION 3: PROJECT EVOLUTION
a phone number and email address to report technical issues and an internal
dashboard for tracking customer service help tickets. A high percentage of
customer service tickets were filed either to inquire about how to join the
pilot or about how to install the app once a user had been enrolled in it.
In the section that follows, results of data collected and analyzed by the
project evaluation are presented, including data collected across the four
waves of test users and an extended user survey, as are insights about project
impacts from these data sources.
FEDERAL TRANSIT ADMINISTRATION 14SECTION
Evaluation
4 This section presents the results of a Valley Metro evaluation of the MOD
Sandbox Demonstration project in conjunction with the USDOT-sponsored
independent evaluation. The study was set up in four three-month waves.
Participants were asked to use the app four times per month for three months
and to complete pre-and post-study surveys. Participants were provided with a
gift card upon completion of all study requirements. It was necessary to identify
participants who were willing to provide ongoing participation in the pilot
program to provide statistically-valid data. WestGroup was hired to assist with
participant recruitment and to develop an implementation strategy to incentivize
participants and solicit feedback.
The project evaluation, conducted by the independent evaluator, consisted of
testing 12 hypotheses guided by the project’s main goals and objectives. The
analysis was based on before and after survey data for the completed three
waves, app activity and payment data, the project’s open data platform, and
insights from interviews with the Valley Metro MOD Sandbox project partners.
The evaluation of these 12 hypotheses was executed using the data from the
first three waves and is detailed in full within the independent evaluation report.
A fourth wave was subsequently completed, and selected results from the first
three waves and this final wave are presented in this section. Also presented in
this section are results of an extended user survey implemented at the end of the
study for Waves 1–3. Selected insights from these instruments detailing project
impacts are discussed below.
Selected Insights from Waves 1–3
The evaluation of the data collected in the first three waves showed a
statistically-valid number of responses. Of the 332 participants in Waves 1–3,
58% were male and 42% were female. There was a small number of people
with disabilities within the sample; 1% of respondents indicated that they used
a wheelchair and 2% indicated that they had other disabilities that required
specialized accommodations for transportation or Americans with Disabilities
Act (ADA) accessible vehicles and infrastructure. This translated to 11 of the 332
participants identified as people with disabilities. Figure 4-1 shows that 80% of
respondents lived in households of three or fewer individuals.
FEDERAL TRANSIT ADMINISTRATION 15SECTION 4: EVALUATION
Figure 4-1
Household size
distribution
(Waves 1–3)
Figure 4-2 shows the distribution of housing stock in which participants lived,
with 51% living in attached or detached single-family homes and 26% living in
apartment buildings containing 10–100 units.
Figure 4-2
Housing type
distribution
(Waves 1–3)
Participants had varied income and education levels as well as diverse racial
and ethnic backgrounds, as shown in Figures 4-3, 4-4, and 4-5. Participants
were generally of middle income, with the mode (the most frequently selected
category) of the distribution at $35,000–$50,000. The distribution showed
that the survey population had a median income falling within this category,
slightly lower than the median income of $61,606 in Maricopa County (US
Census, 2018).
FEDERAL TRANSIT ADMINISTRATION 16SECTION 4: EVALUATION
Figure 4-3
Household
income
distribution
(Waves 1–3)
The participant sample had an education level relatively similar to the
general population of Maricopa County. Figure 4-4 shows that 24% had a
bachelor’s degree compared to 20% of the population, 14% had a graduate
degree compared to 12% of the population, and 42% completed a high school
education or were currently pursuing a 2- or 4-year degree compared 47% of
the population (US Census, 2018).
Figure 4-4
Highest education
level distribution
(Waves 1–3)
Figure 4-5 shows the racial/ethnic distribution of the sample distribution of the
participants. The dominant racial and ethnic backgrounds of participants, for
which respondents could select all that apply, were White (66%), Hispanic/Latino
(17%), and African American (10%). This represents a slight overrepresentation of
FEDERAL TRANSIT ADMINISTRATION 17SECTION 4: EVALUATION
the White (56%) and African American (5%) populations, accurately represents
the Asian population (4%), and underrepresents the Hispanic/Latino population
(30%).
Figure 4-5
Race or ethnicity
distribution
(Waves 1–3)
As shown in Figure 4-6, participants reported different levels of car ownership,
with 35% of the 332 respondents indicating that they did not own or lease a car.
Figure 4-6
Vehicle ownership
distribution
(Waves 1–3)
Figure 4-7 shows the distribution of modes of transportation used by participants
during the 12 months preceding the time of the survey, in which respondents
were allowed to select all that apply. The responses show that participants were
generally heavy public transit users, and only 54% had driven alone in the last 12
months. The most common mode selected was the Valley Metro light rail service
(89%), followed by Valley Metro bus service (76%), walking (75%), carpooling
(73%), and Uber and Lyft (71%).
FEDERAL TRANSIT ADMINISTRATION 18SECTION 4: EVALUATION
Figure 4-7
Transportation
mode use
distribution
(Waves 1–3)
The post-survey asked participants about their mode use during the past three
months (the duration of their participation in the pilot). Figure 4-8 shows the
percentage changes between before and after distributions of mode use. An
across-the-board decline in mode use is evident and may be due to a variety of
factors, including the shorter period of three months assessed in the post-study
survey. However, the magnitude of decline varies across the modes, and thus,
it can be inferred that in addition to the consistent partial decline due to the
shorter study period, a marginal decline is present for certain modes due to an
actual decrease in their use. A decrease in mode use was evident and significant
for car rental within Phoenix, the ASU student shuttle, taxi, Valley Metro
neighborhood circulator service, personally-owned bicycle, bike share, Uber
and Lyft, and walk. The relative declines in Valley Metro bus and rail usage were
negligible compared to the declines of other modes, and only the carpool mode
showed a negligible increase in use.
FEDERAL TRANSIT ADMINISTRATION 19SECTION 4: EVALUATION
Figure 4-8
Before/after
change in
transportation
mode use
(Waves 1–3)
A primary goal of the Pass2Go® app was to provide a convenient trip planning
platform for users to plan multimodal trips and save time. Paired observations of
self-reported travel, wait, and trip planning times of 332 users in the before and after
surveys showed that the app decreased planning and wait times of users but did not
significantly affect their total travel times. This finding aligned with the functionality of
the app as a planning tool aimed to enhance a user’s planning experience and optimize
their arrival to bus or rail stations. Figures 4-9 and 4-10 show user perceptions
of their planning and wait times as a result of using the Pass2Go® app, with 37%
perceiving shorter planning times and 28% reporting shorter wait times.
Figure 4-9
Change in
planning times
as a result of
Pass2Go® pilot
(Waves 1–3)
FEDERAL TRANSIT ADMINISTRATION 20SECTION 4: EVALUATION
Figure 4-10
Change in wait times as
a result of Pass2Go®
pilot (Waves 1–3)
Another goal achieved by the project was to provide an integrated platform with
different transportation options and encourage travelers to adopt mobile-based
technology to connect with public transit. A time series analysis of app downloads
and activity data showed an increasing trend in app activity following implementation
of each of the three waves. Statistical analysis showed that the app significantly
increased user abilities to get to/from the Valley Metro bus services, the Valley Metro
rail line, and public transit in the Phoenix area in general. Figure 4-11 shows that
74% of the 332 participants felt that they had experienced improved access to public
transit due to the Pass2Go® app.
Figure 4-11
Change in access to
public transit as a
result of Pass2Go®
pilot (Waves 1–3)
FEDERAL TRANSIT ADMINISTRATION 21SECTION 4: EVALUATION
In addition to directly connecting travelers with public transit, the Pass2Go®
app also increased traveler use of on-demand transportation such as Uber, Lyft,
and GR:D Bikeshare to get to and from transit, as shown in Figure 4-12. The app
provided a link to Uber, Lyft, and GR:D Bikeshare even though it did not directly
integrate with these transportation providers (i.e., the link opened another app
external to the application).
Figure 4-12
Change in use of on-
demand transportation
as a result of
Pass2Go® pilot
(Waves 1–3)
From an accessibility point of view, the project successfully enhanced trip planning
methods for travelers with disabilities and improved their access to real-time
traveler information for public transit. However, this result was based on only
11 people with disabilities out of 332 survey participants. Of the 11 participants,
6 experienced improved planning methods and access to real-time traveler
information due to the Pass2Go® pilot.
A key objective of the project was to provide an integrated payment system for
multiple transportation options and reduce the amount of paper-based tickets and
onboard cash pay. Travelers were able to purchase one-day ride passes using the
app at a flat fare of $4. A pass could be purchased anytime in advance and needed
to be activated before the rider used it or on the day the rider planned to use it.
Once activated, a pass would expire after 24 hours. The analysis of app payment
data included 12,239 transactions for 626 users from March 2018 to November
2019. Results showed that the average user purchased 20 passes, of which 19 were
activated. On average, passes were purchased about four days in advance. The
analysis showed relatively robust payment activity and use of the app for transit pass
purchases that continued after the waves were over; in other words, respondents
continued to use the app even though their trial use of it was complete.
FEDERAL TRANSIT ADMINISTRATION 22SECTION 4: EVALUATION
From a qualitative perspective, expert interviews with those close to project
implementation revealed several lessons learned from the project in addition to
recommendations for future research and deployment. At the beginning of the
project, one challenge was assembling a project management team of suitable size
to be effective while keeping a larger advisory group that could still be involved
and provide feedback in the Pass2Go® development. However, the main challenge
was going through the app development cycle and all its institutional requirements,
which were more complicated and time-consuming than anticipated. Establishing
contracting terms and relationships with ridesourcing service providers was difficult
because of data concerns in addition to the challenge of programming ridesourcing
services into the mobile app environment itself.
Selected Insights from Wave 4
Wave 4 was the final participant wave of the project. It finished with 77
completed respondents, bringing the total participants with completed surveys
to 409. Select insights from Wave 4 are presented in this section, including new
survey questions in addition to questions previously asked in the first three
waves. Similar to participants in the first three waves, participants in the fourth
wave had diverse socio-demographic characteristics. Of the 77 participants, 64%
were male and 36% were female. From a mobility and accessibility perspective,
1% (1 of 77) indicated using a wheelchair and 3% (2 of 77) indicated having other
disabilities that required specialized accommodations for transportation. This
translated to 2 of 77 participants identified as people with disabilities.
Figure 4-13 shows that 87% of respondents lived in households of three or fewer
individuals.
Figure 4-13
Household size
distribution
(Wave 4)
Participants had varied income and education levels in addition to diverse
race and ethnic backgrounds, as shown in Figures 4-14, 4-15, and 4-16.
The demographic distributions of Wave 4 were similar to Waves 1–3, with
participants generally of middle income; the mode (the most frequently selected
FEDERAL TRANSIT ADMINISTRATION 23SECTION 4: EVALUATION
category) of the distribution at $25,000–$35,000, which was lower than the
first three waves. The distribution showed that the survey sample had a median
income falling within $35,000–$50,000—again, lower than the median income of
$61,606 in Maricopa County (US Census, 2018).
Figure 4-14
Household income
distribution
(Wave 4)
Also similar to Waves 1–3, the participant sample had an education level
relatively similar to the general population of Maricopa County. Figure 4-15
shows that 21% of respondents had a bachelor’s degree compared to 20% of the
population; 12% had a graduate degree, equal to 12% of the population; and 53%
had completed a high school education and were currently pursuing a 2- or a
4-year degree compared 47% of the population (US Census, 2018).
Figure 4-15
Highest
education level
distribution
(Wave 4)
FEDERAL TRANSIT ADMINISTRATION 24SECTION 4: EVALUATION
Figure 4-16 shows the racial/ethnic distribution of the sample distribution of
participants. The dominant racial and ethnic backgrounds of participants, where
respondents could select all that apply, were White (55%), Hispanic/Latino
(27%), and African American (10%). This represents a slight overrepresentation
of the African American population (5%), closely represents the White
(56%) and Hispanic/Latino (30%) populations, and underrepresents the Asian
population (4%).
Figure 4-16
Race or ethnicity
distribution
(Wave 4)
As shown in Figure 4-17, participants reported different levels of car ownership,
with 46% of the 77 respondents indicating that they did not own or lease a car.
Figure 4-17
Vehicle ownership
distribution
(Wave 4)
Figure 4-18 shows the distribution of modes of transportation used by
participants during the last 12 months, in which respondents were allowed to
select all that apply. The responses show that participants were generally heavy
public transit users, and only 44% had driven alone in the last 12 months. The
FEDERAL TRANSIT ADMINISTRATION 25SECTION 4: EVALUATION
most common mode selected was the Valley Metro light rail service (87%),
followed by Valley Metro bus service (84%), walking (75%), Uber and Lyft (74%),
and carpooling (69%).
Figure 4-18
Transportation mode
use distribution
(Wave 4)
A primary goal of the Pass2Go® app was to provide a convenient trip planning
platform for users to plan multimodal trips and save time. Figures 4-19 and 4-20
show user perceptions of their planning and wait times as a result of using the
Pass2Go® app, with 31% perceiving shorter planning times and 32% reporting
shorter wait times.
Figure 4-19
Change in planning
times as a result of
Pass2Go® pilot
(Wave 4)
FEDERAL TRANSIT ADMINISTRATION 26SECTION 4: EVALUATION
Figure 4-20
Change in wait
times as a result of
Pass2Go® pilot
(Wave 4)
Within the Wave 4 responses, 89% felt that having access to transit passes on
their mobile phone encouraged them to ride bus and/or rail more often than they
would without it, with 64% reporting “definitely” and 25% reporting “probably”
to this question, as shown in Figure 4-21.
Figure 4-21
Effect of access to
transit passes on
public transit use
(Wave 4)
FEDERAL TRANSIT ADMINISTRATION 27SECTION 4: EVALUATION
Respondents were also asked if they would use the Pass2Go® app in another city
if it was offered there. As shown in Figure 4-22, 68% reported “definitely” and
26% reported “probably” (94% in total) to this question.
Figure 4-22
Use of Pass2Go® in a
different city
(Wave 4)
Figure 4-23 shows that 1% (1 of 77) reported that they could not ride transit
without the app, and 30% (23 of 77) reported that they would ride it less often
without the app.
Figure 4-23
Impact of Pass2Go®
pilot availability
(Wave 4)
These selected insights from the Wave 4 deployment suggest that that the
services provided by the app were useful to the testing population and positively
impacted their experience using Valley Metro public transit.
FEDERAL TRANSIT ADMINISTRATION 28SECTION 4: EVALUATION
Selected Insights from Extended
Tester Survey from Waves 1–3
An extended tester survey was implemented for select users from Waves 1–3
who continued to use the app after their study period had ended, withy 69
responses obtained. Figure 4-24 shows that the most-used app features included
ticket purchasing/ticket activation (used by 93% of 69 users), trip planning (41%),
viewing trip schedules (39%), and viewing nearby stops (35%). Also, users were
asked if they would continue using the Pass2Go® app as long as it was available,
with 88% (61 of 69) answering “yes.”
Figure 4-24
Pass2Go® pilot
used features
(extended
tester survey)
Figure 4-25 shows that 1% (1 of 69) reported that they could ride transit without
the app, and 39% (27 of 69) reported that they would ride it less often without
the app.
Figure 4-25
Impact of Pass2Go®
pilot availability
(extended
tester survey)
FEDERAL TRANSIT ADMINISTRATION 29You can also read