Modeling and Characterization of Cohesion in Fine Metal Powders with a Focus on Additive Manufacturing Process Simulations
←
→
Page content transcription
If your browser does not render page correctly, please read the page content below
Modeling and Characterization of Cohesion in Fine Metal Powders with a Focus
                                                       on Additive Manufacturing Process Simulations

                                                  Christoph Meiera,b,∗, Reimar Weissbacha,b , Johannes Weinberga,c , Wolfgang A. Wallb , A. John Harta,∗
                                         a Mechanosynthesis    Group, Department of Mechanical Engineering, Massachusetts Institute of Technology, 77 Massachusetts Avenue, Cambridge,
                                                                                                          02139, MA, USA
                                              b Institute for Computational Mechanics, Technical University of Munich, Boltzmannstrasse 15, 85748 Garching b. München, Germany
                                                                             c M.I.T. Lincoln Laboratory, 244 Wood Street, Lexington, 02420, MA, USA
arXiv:1804.06816v3 [cs.CE] 25 May 2018

                                         Abstract
                                         The cohesive interactions between fine metal powder particles crucially influence their flow behavior, which is in
                                         turn important to many powder-based manufacturing processes including emerging methods for powder-based metal
                                         additive manufacturing (AM). The present work proposes a novel modeling and characterization approach for micron-
                                         scale metal powders, with a special focus on characteristics of importance to powder-bed AM. The model is based on
                                         the discrete element method (DEM), and the considered particle-to-particle and particle-to-wall interactions involve
                                         frictional contact, rolling resistance and cohesive forces. Special emphasis lies on the modeling of cohesion. The
                                         proposed adhesion force law is defined by the pull-off force resulting from the surface energy of powder particles
                                         in combination with a van-der-Waals force curve regularization. The model is applied to predict the angle of repose
                                         (AOR) of exemplary spherical Ti-6Al-4V powders, and the surface energy value underlying the adhesion force law
                                         is calibrated by fitting the corresponding angle of repose values from numerical and experimental funnel tests. To
                                         the best of the authors’ knowledge, this is the first work providing an experimental estimate for the effective surface
                                         energy of the considered class of metal powders. By this approach, an effective surface energy of 0.1mJ/m2 is
                                         found for the investigated Ti-6Al-4V powder. This value is considerably lower than typical experimental values for
                                         flat metal contact surfaces in the range of 30 − 50mJ/m2 , indicating the crucial influence of factors such as surface
                                         roughness and potential chemical surface contamination / oxidation on fine metal powders. More importantly, the
                                         present study demonstrates that a neglect of the related cohesive forces leads to a drastical underestimation of the
                                         AOR and, consequently, to an insufficient representation of the bulk powder behavior.
                                         Keywords: Cohesion, Surface Energy, Fine Metal Powders, Additive Manufacturing, Discrete Element Method,
                                         Modeling and Characterization

                                         1. Introduction

                                         There is a variety of technical processes relying on metal powder as raw material, with powder-bed fusion additive
                                         manufacturing certainly representing the most prominent class of these processes. Among the manifold of existing
                                         additive manufacturing (AM) processes, selective laser melting (SLM) of metals has attracted much scientific atten-
                                         tion in recent years since it offers near-net-shape production of virtually limitless geometries, and eventual potential
                                         for pointwise control of microstructure and mechanical properties [21, 69, 72]. On the other hand, the overall SLM
                                         process is complex and governed by a variety of (competing) physical mechanisms. A sub-optimal choice of process
                                         parameters might lead to deteriorated material properties or even to failure of the part already during the manufac-
                                         turing process [11, 22, 42, 43, 65]. The complexity and sensitivity of the process leads to an inevitable demand for
                                         experimental and numerical studies in order to gain an in-depth understanding of the underlying physical mechanisms

                                            ∗ Correspondingauthors
                                             Email addresses: meier@lnm.mw.tum.de (Christoph Meier), ajhart@mit.edu (A. John Hart)

                                         Preprint submitted to Powder Technology                                                                                        May 28, 2018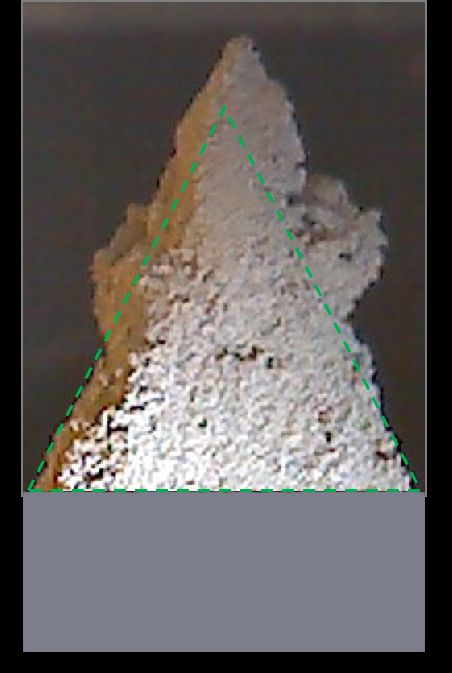
and ultimately to optimize the process and the properties of the final part.

Depending on the lengths scales under consideration, existing experimental and numerical studies can typically be
classified (see e.g. [51]) in macroscopic approaches analyzing thermo-mechanical effects such as residual stresses
or dimensional warping on part level [12, 28, 36, 56, 63, 83], mesoscopic approaches commonly investigating melt
pool fluid dynamics within single laser beam tracks by resolving length scales in the range of the powder particle
size [1, 38, 40, 45, 50, 60] as well as microscopic approaches studying the evolution of the metallurgical microstruc-
ture during the process [16, 23, 62, 84]. Most of these studies intend to optimize the SLM process by relating the
observed process outcomes with input parameters such as laser beam power and velocity, powder layer thickness,
hatch spacing or scanning strategy. There are also some - but considerably less - contributions that have studied the
influence of the powder feedstock on the process outcome [3, 4, 26, 27, 32, 71, 78]. However, only very few of
these works have studied the actual interplay of powder particle properties (mechanical, thermal, optical and chemical
properties on particle surfaces), bulk powder properties (morphology, granulometry and resulting flowability) as well
as resulting powder layer characteristics (packing density, surface uniformity as well as effective thermal and mechan-
ical properties) during the powder recoating process applied between two subsequent material layers in metal additive
manufacturing. Among others, this deficit has been reflected by a recent priority meeting on metal powder modeling
of political, scientific and industrial leaders in the field of AM technologies [39].

The few existing studies of powder recoating processes in metal AM comprise the pioneering works of Herbold et
al. [33], Mindt et al. [54], Haeri et al. [29] and Gunasegaram et al. [25]. All of these approaches employed a model
based on the discrete element method (DEM) typically accounting for (visco-) elastic normal contact, sliding friction
as well as rolling friction interaction between spherical particles. The mentioned works demonstrated the general
applicability of DEM-based models and already gained valuable insights into physical mechanism underlying the
powder re-coating process. However, none of these pioneering modeling approaches have considered powder cohe-
siveness so far, allthough its importance has already been argued in [33].

It is well-known that bulk powder cohesiveness increases with decreasing particle size, which is a direct consequence
of the cubic and linear scaling with particle size typically observed for volume forces (e.g. gravity forces) and adhesive
forces (e.g. van-der-Waals forces associated with the particle’s surface energy), respectively [71, 76]. When consid-
ering typical surface energy values measured for metals, it can be concluded that cohesive forces might crucially
influence the bulk powder behavior of micron-scale metal powders typically applied in AM processes [33]. While
there are some existing approaches incorporating cohesion in DEM-based powder coating / packing models, to the
best of the authors’ knowledge, none of these contributions has considered metallic powder materials [58, 59, 81]. It
is questionable if the results derived by these studies can directly be transferred to metal additive manufacturing, since
the underlying physical mechanism as well as the typical magnitudes of cohesive forces are crucially different for
(conductive) metallic and non-metallic powders. Moreover, to the best of the authors’ knowledge, there is currently
no experimental data available in the literature that would enable a quantification of the effective surface energy, and
thus of the cohesive forces, prevalent in these powders. However, an experimental characterization of the powders at
hand is important since surface energy values for a given material combination can easily vary by several orders of
magnitude as consequence of surface roughness and potential surface contamination / oxidation.

The present work closes this gap by proposing a powder model based on the discrete element method (DEM) with
particle-to-particle and particle-to-wall interactions involving frictional contact, rolling resistance and cohesive forces.
Special emphasis lies on the modeling of cohesive effects. The proposed adhesion force law is defined by the pull-
off force associated with the surface energy of powder particles in combination with a van-der-Waals force curve
regularization. For the first time, the magnitude of the effective surface energy and of the resulting cohesive forces
will be quantified for the considered class of metal powders by fitting angle of repose (AOR) values resulting from
experimental and numerical funnel tests. As a result, it will be found that the effective surface energy determined
for the investigated micron-scale metal powder is lower than typical values measured for sheet metal [33, 66]. More
importantly, it is shown that a neglect of the resulting cohesive forces leads to a drastical underestimation of the AOR
and, consequently, to an insufficient description of the bulk powder behavior in potential powder recoating simula-
tions based on such a simplified model. Eventually, the present study demonstrates that the resulting angle of repose
                                                             2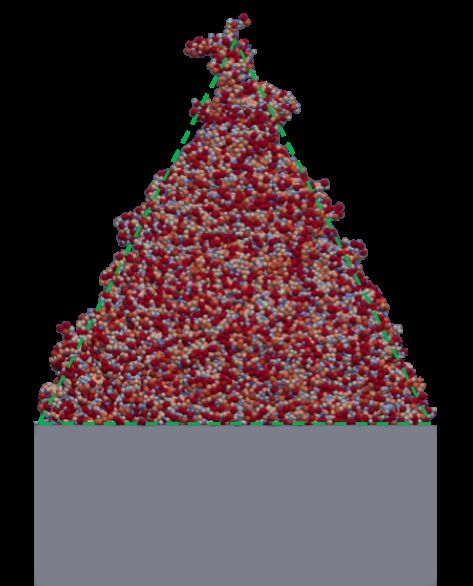
is more sensitive concerning the magnitude of surface energy as compared to the magnitude of other powder material
parameters such as powder particle stiffness, friction coefficient or coefficient of restitution. The proposed modeling
and characterization approach is carried on with having powder-bed fusion additive manufacturing processes in mind,
but is generally valid for a broad range of applications involving micron-scale metal powders such as (cold/hot) iso-
static pressing, solid state sintering, chemically induced binding or liquid phase sintering of metal powders [43].

The remainder of this article is structured as follows: Section 2 presents the main constituents of the proposed model,
both, from a physical but also from a numerical point of view, with a special focus on cohesive effects. In Section 3,
the proposed model is calibrated, i.e. the effective surface energy underlying the model is determined for the consid-
ered powder material by fitting numerical and experimental AOR values. In this section, also the sensitivity of the
resulting AOR values, and the fitted surface energy, with respect to other powder material parameters and the spatial
problem scaling is analyzed. Finally, a summary of the main results and a brief outlook on potential future research
work is given in Section 4.

2. Physical and computational model

The experimental and numerical studies presented throughout this work employ plasma-atomized Ti-6Al-4V powder
with different size distributions. Exemplary SEM images at different resolutions are given in Figure 1. Accordingly,
the shape of individual powder particles can be described as spherical in good approximation, an observation that
could be confirmed by optical profilometer measurements conducted prior to this study. In the following, the discrete
element method (DEM, originally developed by Cundall and Strack [10], see also [2, 5, 73]), more precisely the
so-called ”soft sphere” model, will be applied in order to model the bulk powder on the level of individual powder
particles in a Lagrangian manner. This model describes powder particles as rigid spheres whose kinematics in 3D
space are uniquely defined by six degrees of freedom, i.e. the position vector rG as well as the rotation vector ψ
representing the centroid position and orientation of the sphere, respectively. Accordingly, the equations of motion of
an individual particle i are given by the balance of linear and angular momentum:
                                                             X
                                                                 ij    ij    ij
                                          (m r̈G )i = mi g +   (fCN + fCT + fAN ),                                 (1a)
                                                                j
                                                               X
                                                   (IG ω̇) =
                                                          i
                                                                    (miRj + rCG
                                                                             ij    ij
                                                                                × fCT ).                                      (1b)
                                                                j

Here, m = 4/3πr3 ρ is the particle mass, IG = 0.4mr2 is the moment of inertia of mass with respect to the parti-
cle centroid G, r is the particle radius, ρ is the mass density, g is the gravitational acceleration, and (...)     ˙ represents
the first time derivative. For later use, also the effective mass and radius of two colliding particles i and j shall
                          mi m j                  ri r j
be defined as me f f := mi +m    j
                                   and re f f := ri +r   j
                                                           , respectively. All results derived in the following for the interac-
tion of two spheres with masses mi , m j and radii ri , r j can be particularized for the interaction of two equal spheres
(mi = m j = m, ri = r j = r) leading to me f f = m/2, re f f = r/2 as well as for the interaction of a sphere with a
rigid wall (mi = m, ri = r, m j → ∞, r j → ∞) leading to me f f = m, re f f = r. As consequence of the non-additivity
of large rotations, the angular velocity ω is in general different from the time derivative of the rotation vector ψ, i.e.
ω , ψ̇ [8, 52, 68]. However, due to the spherical shape of the particles and the type of interaction forces on the
right-hand side of (1), the knowledge of the evolution of ψ(t) (which would require a special class of time integration
schemes, so-called Lie-Group time integrators [7, 64]) is not needed throughout the simulation. Instead, it is sufficient
to solve for rG and ω as well as their time derivatives. In the present work, a velocity verlet time integration scheme
is applied for this purpose. The right-hand side of (1) summarizes the forces and torques resulting from an interaction
                                                                                         ij      ij                    ij
with neighboring particles j considering normal and tangential contact forces fCN           and fCT , adhesive forces fAN , rolling
resistance torques mR as well as the torques resulting from the tangential contact forces. In this context, rCG := rCi j −rGi
                      ij                                                                                            ij

represents the vector from the centroid of particle i to the point of contact with particle j. The specific force laws of
these interactions will be discussed in the following section.

                                                                    3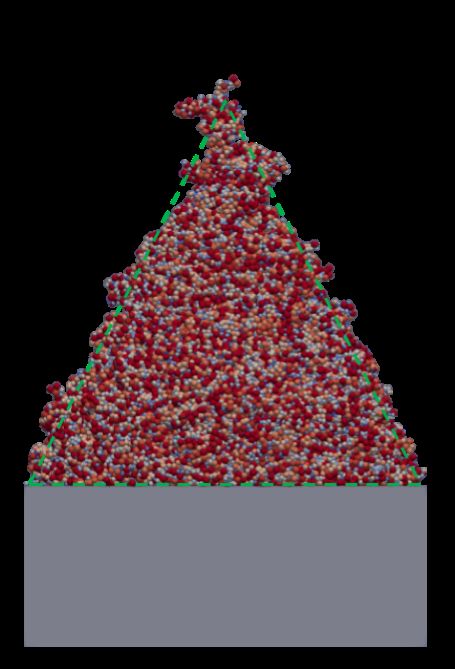
Figure 1: SEM Images of employed plasma-atomized Ti-6Al-4V powder as typical for metal additive manufacturing processes.
Besides powder modeling in a discrete sense as discussed so far, i.e. individual powder particles and their mechanical
behavior are explicitly resolved, it would also be possible to describe the powder as a homogenized continuum based
on a proper bulk powder material model (see e.g. [17]). However, for the intended class of applications, namely the
powder re-coating process in metal AM, the size of individual powder particles is not sufficiently small compared
to the length scales of the problem domain (e.g. the ratio of powder particle diameter to powder layer thickness is
typically in the range of 0.2 − 1), i.e. a separation of length scales as required for a continuum approach is not given.
Moreover, the analysis of certain effects of interest, e.g. groove-type defects in the powder layer caused by jammed
powder particles, requires the resolution of individual particles as incorporated by the present DEM-based approach.
2.1. Contact forces
Since the employed DEM scheme considers rigid spheres, the compliance of particles during collision has to be
accounted for by means of a proper contact force law reflecting the underlying material properties. Here, the normal
contact force law is based on a typical spring-dashpot model of the form
min (0, kN gN + dN ġN )n, gN ≤ 0
(
ij
fCN = (2)
0, gN > 0
where gN := ||rGj − rGi || − (ri + r j ) is the normal gap between the contact points and n = (rGj − rGi )/||rGj − rGi || is the unit
normal vector [47, 48]. The elastic / penalty constant kN as well as the damping constant dN are given by:
s
2
k N me f f 8πρVmax rmax 4πγ
dN = 2| ln (cCOR )| , kN ≥ max , . (3)
ln (cCOR )2 + π2 c2g cg
The case distinction as well as the min() function in (2) ensure that mechanical contact forces act only for negative
normal gaps (penetration) and are always negative (tension cut-off), i.e. only pressure forces appear. The first equation
in (3) represents an analytic relation between the damping constant dN of the linear spring-dashpot (LSD) model and
the coefficient of restitution cCOR (which holds exactly as long as no tension cut-off is considered) [34]. The second
equation states the minimal value of the elastic constant kN in order to guarantee for maximal relative penetrations
cg := maxi,t (|gN |/R) below a prescribed threshold value, considering dynamic collisions of particles with maximal
radius rmax and maximal velocity Vmax := maxi,t (ṙGi ) (first term) as well as the maximal static adhesive forces resulting
from the surface energy γ (second term, see also Section 2.3). Here, maxi,t (...) represents the maximum across all
particles and the considered time span.
There exists a variety of more elaborate normal contact force models (see e.g. [34, 41, 77]), where the elastic part
follows e.g. a g(3/2)
N law based on Hertzian contact theory [35], allowing for a relation of the elastic constant kN with
4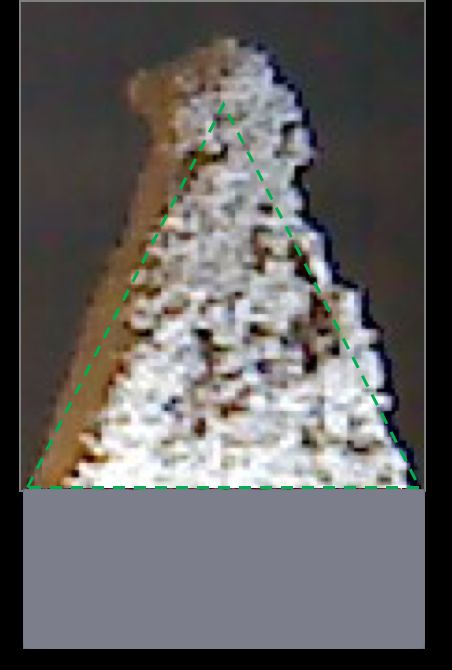
the Young’s modulus E and the Poisson’s ratio ν of the particle material. However, in DEM simulations, it is standard
practice to choose the elastic constant by orders of magnitude lower as predicted by the Young’s modulus in order
to end up with larger critical time step sizes (see below) and, in turn, with shorter computation times. Since lower
elastic constants lead to higher contact times and lower peak forces during dynamic collisions, this strategy does not
allow for an exact representation of contact force evolutions in highly dynamic scenarios. On the other hand, it does
allow to represent macroscopic / integrated quantities such as momentum exchange between particles as well as bulk
powder kinematics / flow in an accurate manner as long as the relative penetration cg is reasonably small [33, 47].
For quasi-static problems (which applies to the majority of examples in this work), where inertia effects are negligible
compared to gravity and adhesive forces, even the prediction of contact forces is possible in good approximation.
These considerations also justify the application of the simple linear force law (2) instead of more elaborate models.

In a similar manner, the tangential / frictional contact interactions are given by a Coulomb force law of the form
                                                      ij
                                                         ||, ||kT gT + dT ġT ||)tT , gN ≤ 0
                                          (
                                  ij         min (µ||fCN
                                 fCT   =                                                                           (4)
                                             0,                                       gN > 0
                                              ij
with a maximal force amplitude of µ||fCN         | limited by the friction coefficient µ in the slip case and a regularization
based on a linear spring-dashpot combination in the stick case [47, 48]. Here, the unit tangent vector is defined as
tT := −(kT gT + dT ġT )/||kT gT + dT ġT || and the rate of tangential gap vector is given by ġT := (I − n ⊗ nT )(vGi − vGj ) +
       ij           ji          ij
ωi × rCG  − ω j × rCG  , with rCG  := rCi j − rGi = (ri + gN /2)n, rCG
                                                                     ji
                                                                        := rCji − rGj = −(r j + gN /2)n, and with I representing
                         3
an identity tensor in < . In contrast to the normal gap gN , the tangential gap vector gT is not uniquely defined by the
current geometric configuration but has to be determined numerically via integration of ġT . Here, a Backward Euler
scheme is employed for time integration of gT , and a typical return mapping algorithm is applied in order to check
the stick/slip condition in every discrete time step [20, 44, 79]. Furthermore, the constants of the tangential contact
interaction are chosen as
                                                                          1−ν
                                             dT = d N ,          kT =            kN ,                                        (5)
                                                                        1 − 0.5ν
where ν is Poisson’s ratio of the particle material. As shown in [13], normal and tangential force laws should not be
chosen independently. Instead, the ratio of normal to tangential stiffness is a material property of the contacting bodies.
It has been shown for the linear spring dash-pot model that a choice according to (5) leads to optimal results with
respect to macroscopic characteristics of the particle collision such as the change of linear and angular momentum [13,
14, 15], which are comparable to the results gained by more elaborate (and complex) approaches. Again, since the
advantages of these more elaborate models in terms of more accurate contact force evolutions would only come into
play for a choice of stiffness parameters consistent with the actual material properties and since such a choice would
lead to undesirably small time step sizes, the simple force laws (2) and (4) seem to be a reasonable choice.

2.2. Rolling resistance
The Coulomb friction law in combination with perfectly spherical particles as considered so far does not account for
any kind of energy dissipation related to rolling motion. For the considered Ti-6Al-4V powder particles, possible
sources of rolling resistance might include viscous dissipation or elastic hysteresis losses in the contact zone, plastic
deformation or deviations from the ideal spherical shape (at least on the scale of surface roughness asperities) [6,
33, 85]. According to [76], the particle radius below which plastic deformation would be expected solely due to
adhesive interaction of two particles can be approximated by the relation rcY ≈ 107 γ/E. Taking the Young’s modulus
of Titanium and the maximal surface energy value of γ = 0.4mJ/m2 considered in this work (see Section 3) leads
to a critical particle diameter in the range of 0.1µm, which is far below the considered range of particle sizes. Thus,
plastic deformation, at least of particle bulk material, seems to be negligible in good approximation. Based on the
SEM images in Figure 1, it has been decided that also the deviations from the ideal spherical shape do not have to be
considered in what follows. Due to the absence of these two sources of ”static” / ”constant” rolling resistance (see
e.g. [47]), only a velocity-proportional, viscous contribution to rolling resistance of the form

                         miRj = −mRji = dR ||fCN
                                              ij
                                                 ||re f f ∆ω⊥   with ∆ω⊥ = (I − n ⊗ nT )(ωi − ω j )                          (6)

                                                                5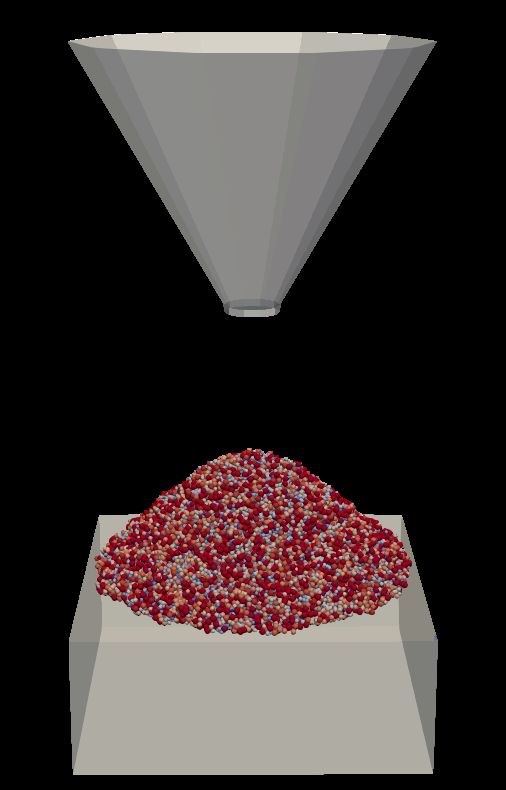
will be considered. This form of a rolling resistance torque proportional to re f f ∆ω⊥ follows from a reformulation
of the objective and momentum-conserving rolling resistance formulation proposed in [47]. One very appealing
approach of determining the coefficient dR has been proposed by Brilliantov et al. [6], who investigated the rolling
motion of a deformable sphere on a rigid surface and derived a first-principle analytical model relating the rolling
resistance coefficient to particle material properties according to
−1/5
(1 − cCOR ) E re f f /2
p
dR ≈ with C1 = 1.15344 (7)
C1 V 1/5 (1 − ν2 )
I
instead of taking it as an additional unknown parameter. Among others, this approximation is based on a Taylor series
expansion of the coefficient of restitution cCOR as a function of impact velocity VI [67]. While the velocity-dependence
of cCOR is well-documented in the literature [33, 49, 80], it is a common approach to employ normal contact models
such as the LSD force law (2) that lead to a constant coefficient of restitution, which can in turn be prescribed as model
input parameter based on a properly chosen reference velocity Vre f [13, 14]. To stay consistent with the derivations
in [67], the same reference velocity will be chosen as impact velocity VI = Vre f in (7) (see Section 2.4). This procedure
seems to be reasonable to get a first-order approximation for the otherwise unknown parameter dR .
2.3. Adhesive forces
There are several physical sources of adhesive inter-particle forces, the most important being capillary effects, elec-
trostatic potentials, and van der Waals (vdW) interactions. The latter term commonly refers to the accumulated effects
resulting from so-called Keesom forces (interaction of two permanent dipoles), Debeye forces (interaction of a per-
manent and an induced dipole) as well as London dispersion forces (interaction of polarizable but initially non-polar
molecules). Since metal powder fusion processes such as SLM require the powder humidity level to be as low as
possible [11, 51], and sometimes the powder is even vacuum-dried before application [46], perfectly dry powder will
be considered here without explicitly accounting for any capillary effects. Furthermore, it can be assumed that van
der Waals forces dominate electrostatic forces by orders of magnitude for conductive powders with particle sizes be-
low 100µm as considered here [9, 37, 74, 76, 82]. The following paragraphs summarize the most important basics
required for the subsequent modeling of vdW interactions, and are in strong analogy to the review article by Wal-
ton [76]. A more detailed treatment of this topic can e.g. be found in the works by Isrealachvili [37], Castellanos [9]
and Parsegian [57].
Let’s assume that the attractive potential between two atoms or small molecules due to van der Waals interaction is
given by ΨA ( s̃) = −C f / s̃6 , where s̃ is the distance between the atoms and C f is a constant. For elementary geometries,
the resulting overall potential can be derived by summation / integration of ΨA ( s̃) over all atoms within the considered
volume. For the resulting interaction potential per unit area between two planar surfaces / half spaces (one surface
area is limited to unity to keep the integral bounded) of distance s̃, this procedure yields:
πC f ρ2a A
wP (s) = − 2
=− [J/m2 ], (8)
12s 12πs2
with ρa being the atom / molecule density and A = π2C f ρ2a the Hamaker constant of the material [30]. In order to
estimate the theoretical value of wP (s) for two (ideally smooth) planes in contact, the distance s between the planes is
typically set to the theoretical molecule diameter s0 ≈ 4Å = 0.4nm, resulting in:
A
wP (s0 ) = − =: 2γ [J/m2 ]. (9)
12πs20
Equation (9) states the theoretical definition of the surface energy per unit area γ of the material. Here, the factor of
2 reflects the convention that γ represents the surface energy per newly created surface area 2F when two contacting
bodies with contact area size F are separated. In a similar manner, the total interaction potential (this time not per unit
area) between two spheres with radii ri and r j and closest distance / gap s can be determined via integration of ΨA ( s̃)
6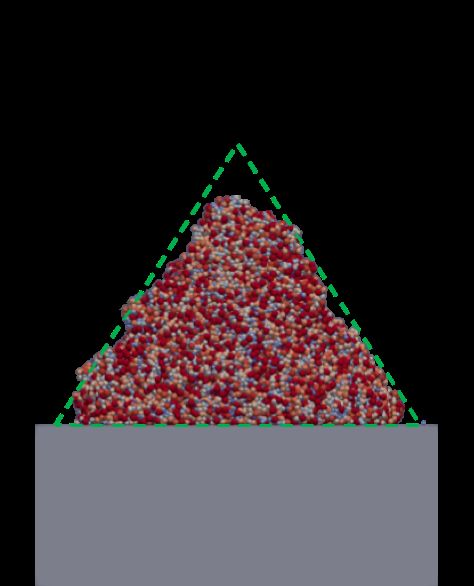
over the volume of both spheres, which yields wS (s) = −Are f f /(6s) [J] with re f f = ri r j /(ri + r j ) (see above). Based
on this result, the associated interaction force between the two spheres reads
d Are f f
FS (s) = wS (s) = [N]. (10)
ds 6s2
Evaluating the interaction force (10) at the (theoretical) contact distance s0 yields the so-called pull-off force FS 0 :
Are f f
FS 0 = , (11a)
6s20
= − 4πγre f f , (11b)
where from (11a) to (11b), the quotient A/s20 has been expressed by means of the surface energy γ according to (9).
Several existing modeling approaches for adhesive interactions between spheres apply the force law (10) limited by
the constant cut-off value (11a) for small distances s < s0 . On the one hand, the implementation of this strategy is
rather straightforward since the two required constants A and s0 are tabulated for many materials. On the other hand,
this approach has also a range of drawbacks, especially when considering fine metal powders. First, and most impor-
tant, real surfaces are not ideally smooth. Surface asperities on rough surfaces keep the effective distance between
closest molecule pairs at a much higher level than predicted by the theoretical molecule diameter s0 . As discussed by
Walton [76], van der Waals forces are of extreme short range nature, decreasing by two (four) orders of magnitude
when increasing the (effective) particle distance from the theoretical value of 0.4nm to 4nm (40nm), giving rise not
only to drastically reduced magnitudes but also to considerably increased uncertainty of experimental pull-off forces
and surface energies compared to the theoretical values (11a) and (9). Second, real surfaces are typically contami-
nated e.g. by oxidation layers resulting in lower effective Hamaker constants and due to (11a) also in lower pull-off
force values. Third, the attractive forces between metallic particles cannot only be accounted for by the vdW potential
but also by extremely short-range non-additive electron exchange interactions, also denoted as metallic bonds, rele-
vant at separations below 0.5nm. These additional forces might lead to higher theoretical surface energy values for
metals as predicted by (9). The short-range nature is even more pronounced than for vdW forces and makes this type
of interactions extremely dependent on surface quality / roughness and even mutual metal lattice orientation [19, 37].
It can be concluded that experimentally measured values of pull-off forces and surface energies show strong variations
and are typically by orders of magnitudes lower than the theoretical values (11a) and (9).
For the reasons mentioned above, it is more practicable to either experimentally measure γ or FS 0 (related by (11b)) in
a direct manner, e.g. via an atomic force microscope (AFM), or to determine these parameters by fitting experimental
and numerical results based on properly chosen bulk powder experiments and metrics (see Section 3). Within this
ij
work, an adhesive force of the form fAN = FS (s)n based on the following force law will be applied:
FS 0 = −4πγre f f , gN ≤ g0
s s
Ar 1 Are f f g0
Are f f e f f
FS (s) = , g0 < gN < g∗ , g :=
∗
= √ .
6s2
with g0 := (12)
∗ 6F S 0 c FS 0 6F S 0 c FS 0
0,
gN ≥ g
The model is uniquely defined by the surface energy γ (measured experimentally) as well as the Hamaker constant (a
typical tabulated value from the literature of A = 40 · 10−20 J [37] is taken here). Here, g0 represents the distance at
which the vdW force curve (10) equals the pull-off force FS 0 , and g∗ represents a cut-off radius at which the vdW has
a relative decline of cFS 0 := FS (g∗ )/FS 0 with respect to FS 0 (taken as cFS 0 = 1% within this work). From a compar-
ison of experimental and numerical angle of repose measurements (see Section 3), we deduce typical surface energy
values in the range of γ = 0.1mJ/m2 . From these exemplary parameter values and a typical mean particle diameter
of d = 2r = 34µm as considered in the following, the remaining parameters in (12) take on values of FS 0 ≈ 10−8 N,
g0 ≈ 0.2µm and g∗ ≈ 2µm. For comparison, the gravity force acting on a 34 micron Ti-6Al-4V particle is FG ≈ 10−9 N,
which means already one order of magnitude lower than the corresponding pull-off force.
As discussed in [76], due to the short-range nature of vdW forces, these are expected to mainly affect existing con-
tacts (FS 0 as resistance to contact break-up), but to have only small influence on the question if close particles will
7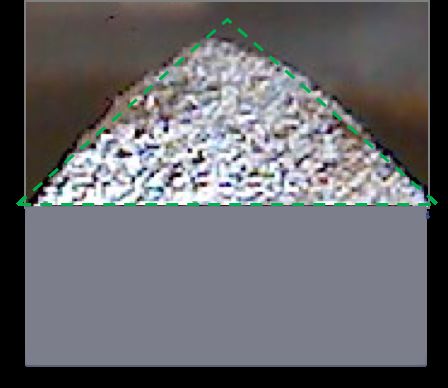
eventually come into contact or not. This statement underlines again the importance of reliable pull-off force values
determined for the specific powder at hand, while deviations in the value taken for the Hamaker constant are rather
negligible. In fact, based on additional simulations conducted in the context of this work, it has been concluded that
the existence of a steady force transition interval g0 < gN < g∗ leads to a numerically better posed problem instead
of having a force jump from 0 to FS 0 , but that the specific functional representation of this transition (e.g. linear
transition instead of vdW law) has only a minor effect on the resulting bulk powder behavior. On the other hand,
it turned out that changing the magnitude of the surface energy γ, and thus of FS 0 , say by a factor of two can lead
to considerably different bulk powder behavior (see Section 3). This argumentation leads to a further advantage of
directly measuring / calibrating FS 0 instead of taking theoretical values of γ in (11b) or of A and s0 in (11a): Even
though the force-distance law of neglected effects such as humidity or electrostatic interaction (which might possibly
be of a more long-range nature than vdW forces) is not considered in the present model, the influence of these effects
on the pull-off force is implicitly taken into account by performing the experimental model calibration at the same
environmental conditions as prevalent in the considered application, e.g. the powder recoating process in AM.
    Remark: The relation between pull-off force and surface energy in (11b) results from the so-called DMT
    (Derjaguin-Muller-Toporov) model considering the integrated interaction potential over two ideal, unde-
    formed spheres. An alternative approach, the so-called JKR (Johnson-Kendall-Roberts) model derives the
    pull-off force under consideration of elastic deformation due to contact interaction and adhesive forces on
    the basis of the Hertzian theory and results in FS 0 = −3πγre f f , which is only by 25% lower than (11b) [76].
    Again, as long as FS 0 is determined experimentally via direct measurement / calibration, the two approaches
    solely differ in the deduced surface energy, which is only of theoretical value but does not change the final
    force laws of the model (more precisely, the higher surface energy value deduced by the JKR model from a
    measured pull-off force, would again cancel out when inserting this surface energy into FS 0 = −3πγre f f to
    calculate the pull-off force for a specific particle size combination during the simulation).

2.4. Simulation strategy and choice of parameters
All simulation results presented in this work rely on an implementation of the proposed DEM formulation in the
in-house code BACI, a parallel multiphysics research code with finite element, particle and mesh-free functionalities,
developed at the Institute for Computational Mechanics of the Technical University of Munich [75]. The set of
ordinary differential equations (1) is discretized in time by an explicit velocity verlet scheme. The time step size ∆t
has been chosen according to the following critical step size estimate (see e.g. [55]):
                                                                  r
                                                                    mmin
                                                ∆t ≤ ∆tcrit = 0.2        ,                                         (13)
                                                                     kN
with mmin := mini (m) representing the minimal mass across all particles. While a finite element discretization has
been chosen to represent rigid walls, the modelled particle size distribution is considered to be of log-normal type
with parameters fitted to the material certificate of the powder employed in the experiments. Specifically, the particle
diameter distribution of the reference powder considered throughout this work is specified by 10%, 50% and 90% per-
centiles according to D10 = 20µm, D50 = 34µm and D90 = 44µm, representing a typical medium-sized powder for
AM applications. After fitting the employed log-normal distribution to these specifications, the range of particle sizes
considered in the model has been limited to lie within D10 and D90, i.e. very small particles below dmin = 20µm as
well as very large particles above dmax = 44µm have not been considered for reasons of computational efficiency. The
density of the Ti-6Al-4V particles is ρ = 4430kg/m2 , and the Hamaker constant has been taken as A = 40·10−20 J [37].

The friction coefficient and the coefficient of restitution for particle-to-particle and particle-to-wall interaction have
been chosen as µ = 0.4 and cCOR = 0.4 in the present study. Further, the reference velocity in (7) has been chosen in
the range of the maximal impact velocities between powder particles expected for the funnel simulations in Section 3.
Eventually, the penalty parameter kN has been chosen according to (3). For the range of parameters considered in this
work, the adhesion-related term in (3) based on a surface energy of γ = 0.1mJ/m2 and the choice cg = 2.5% resulted
in a worst-case estimate of kN = 0.05N/m. Since only the surface energy value will be calibrated on the basis of
bulk powder experiments, additional verification simulations based on varied parameter values will be conducted in
Section 3 in order to assess the sensitivity of the resulting AOR values and the fitted surface energy with respect to the
                                                            8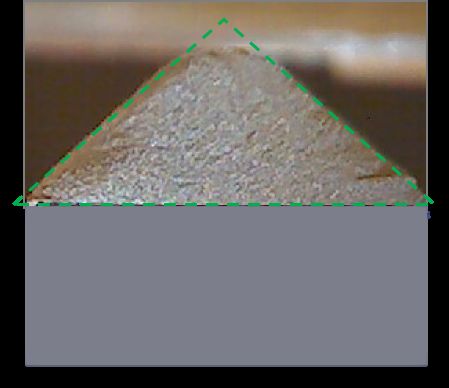
aforementioned parameter choice. It will turn out that the variation of these parameters (within a reasonable range)
will typically have considerably lower influence on the bulk powder behavior than variations of the surface energy.
In the next section, the effective surface energy γ0 required to calculate the pull-off force according to (11b) will be de-
termined for the considered Ti-6Al-4V powder by fitting experimental and numerical AOR values. In order to analyse
the influence of cohesion on the bulk powder behavior and the resulting AOR values, additional funnel simulations
will be carried out for the parameter choices γ = 4γ0 and γ = 0.25γ0 . As shown in [82], the characteristics (e.g. pack-
ing fraction, coordination number, surface uniformity) a layer of cohesive powder takes on in static equilibrium, can
in good approximation be formulated as function of the dimensionless ratio of adhesive (pull-off) and gravity force,
which scales quadratically with particle size according to Fγ /FG = (2πre f f γ)/(mg) ∼ γ/(ρgr2 ). Thus, the increase /
decrease of surface energy γ by a factor of 4 is equivalent to the decrease / increase of particle size r by a factor of 2,
which allows to evaluate the influence of powder particle size on the mechanical / kinematic bulk powder behavior.
3. Model calibration
In order to calibrate the surface energy of the proposed DEM model, the angle of repose (AOR) has been determined
for powder piles resulting from experimental and numerical funnel tests. To measure the AOR experimentally, powder
was dispensed through a funnel with a discharge opening of 1mm diameter and a cone angle of 60◦ onto the center of a
cube with side length a = a0 = 10mm placed below the opening of the funnel. The (fixed) distance between the center of
the cube and the opening of the funnel has been chosen as small as possible for each powder type to limit the powder
impact velocity. The test was concluded when the powder pile covered the entire surface of the cube such that further
addition of powder would result in no additional accumulation of powder. While the angle of repose is a well-defined
metric of noncohesive granular materials, the angle of repose measured for highly cohesive powders might depend on
the deformation history as well as on the problem size, which influences e.g. its avalanching behavior [9]. To address
the problem of history dependence, it has been ensured in experiments and simulations that the powder is initially
in a ”loose” state, i.e. that it is not pre-compressed. In order to study the sensitivity with respect to problem size,
additional experiments with down-scaled variants of the problem setup (cube with side lengths a = a0 /2 = 5mm and
a = a0 /4 = 2.5mm at unchanged discharge opening) have been conducted. Moreover, three powders with different par-
ticle size distributions (PSD) have been employed in the experimental funnel studies discussed in the following. These
are a medium-sized powder typical for SLM applications (D10 = 20µm, D50 = 34µm, D90 = 44µm, mean diameter
d̄ = 34µm), a rather coarse-grained powder (D10 = 46µm, D50 = 72µm, D90 = 106µm, mean diameter d̄ = 72µm) as
well as a rather fine-grained powder (D10 = 8µm, D50 = 14µm, D90 = 23µm, mean diameter d̄ = 14µm).
In the numerical tests, the problem scaling a = a0 /4 has been considered to limit the computational costs. Furthermore,
all numerical simulations within this work are based on a powder particle size distribution fitting the medium-sized
powder (d̄ = 34µm). In order to enable accurate AOR measurements also for the down-scaled numerical variant, it
is desirable to keep the curved region at the particle impact zone on the top of the powder pile as small as possible,
which can be achieved by reducing the powder mass flow and impact velocity, and thus the resulting impact momen-
tum. In the numerical simulations, this is realized by driving down the cube during the flow experiments to limit the
drop height of the particles. Furthermore, the diameter of the discharge opening has been decreased to 0.4mm, and
the adhesion between powder particles and the funnel walls has been switched off (while adhesion between particles
and the cube is an important system property and has been kept) in order to ensure continuous powder flow even for
this smaller opening. For the experimental and numerical analysis of very fine / cohesive powders, an additional small
vibration amplitude has been applied to the funnel in order to increase flowability. It has been verified that all these
modifications mainly influence the shape and relative size of the curved impact zone on the top of the powder pile
without having noticeable influence on the angle of repose measured on the flanks of the pile. The initial and final
configuration of the numerical problem setup is illustrated in Figure 2.
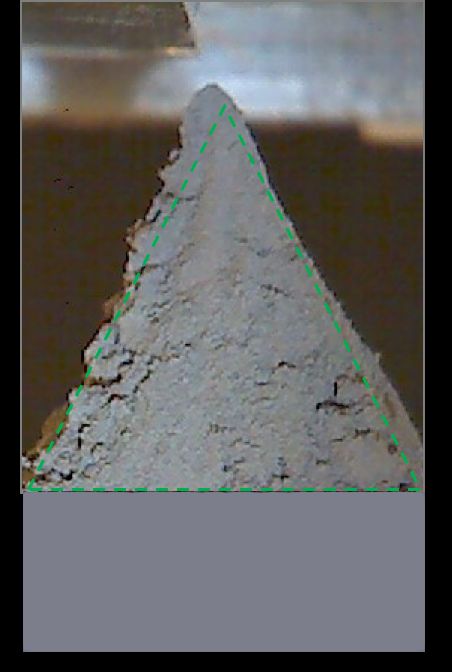
Figure 3 illustrates the 2D projections of the powder piles resulting from these numerical simulations for different
choices of the surface energy γ. Based on these 2D images, the AOR values have been measured by fitting an equi-
lateral triangle (green dashed lines) for each powder pile. As expected, the angle of repose increases with increasing
9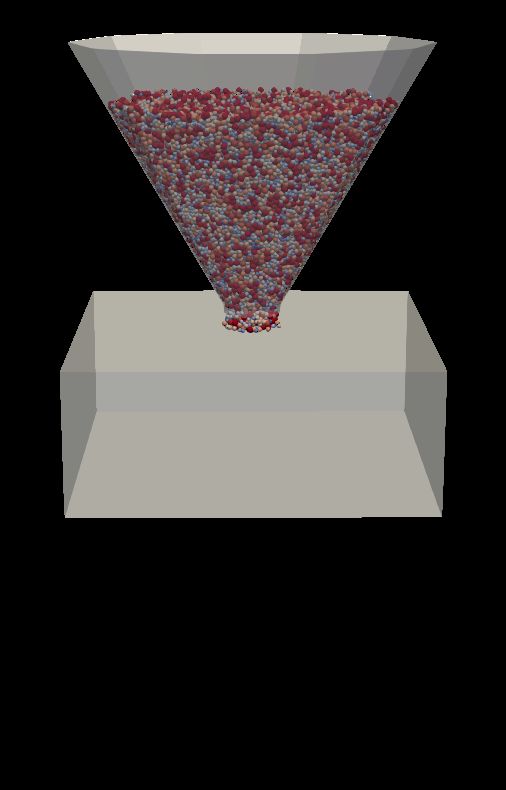
Figure 2: Problem set up for numerical funnel tests in initial (left) and final (right) configuration.

surface energy, i.e. with increasing cohesiveness of the powder. Next, these numerical AOR values will be compared
to the experimental counterparts measured for the medium-sized powder (d̄ = 34µm) considered in the simulations.

For each of the three powder size classes (d̄ = 14µm, d̄ = 34µm, d̄ = 72µm) as well as for each of the three problem
scalings (a = a0 , a = a0 /2, a = a0 /4), several funnel experiments with different powder samples have been conducted.
The measurement of the experimental AOR values is also based on 2D powder pile images and equivalent to the nu-
merical strategy. A statistical evaluation of the measured AOR values is presented in Figure 4. As expected, adhesion
forces increasingly dominate gravity when decreasing the mean powder particle size, which results in higher AOR
values. Additionally, it can be observed that the variation of the results for a given particle size distribution are in a
reasonable range when comparing the different problem scalings or when comparing different powder samples for one
problem scaling. For the medium and coarsed-grained powder, the variation of the mean AOR values lie wihin a range
of approximately 3◦ among the three different problem scalings. As expected, the most cohesive, fine-grained powder
shows a stronger problem size-dependence leading to a variation of mean AOR values in the range of 7◦ among the
three problem scalings. However, since the medium-sized powder (d̄ = 34µm), and not the fine-grained powder, will
be employed for model calibration in the following, this observation has no negative effect on the accuracy of the
fitted surface energy values. Eventually, it can be seen that also the variations among different powder samples of
one problem and powder size are typically in a range below 3◦ . Only, the fine-grained as well as the coarse-grained
powder in combination with the smallest problem scaling a = a0 /4 lead to larger variations in the range of 6◦ . This
observation might be explained by the fact that the average particle size in the coarse-grained powder is rather large
compared to the representative problem volume associated with the problem scaling a = a0 /4 (i.e. comparatively high
Knudsen number d̄/a ≈ 0.03), which leads to stronger variations of results when analyzing effective, bulk powder
properties on the continuum level. The same argumentation also holds for the fine-grained powder, but in this case
not the size of individual particles but rather the size of particle agglomerates present in highly cohesive powders is
relevant. Moreover, the high uncertainty and strong variation of effective adhesive forces in real powders (e.g. due to
variations of surface roughness, contamination, mutual particle orientation) also contribute to the higher variation of

                                                                     10
(a) γ = 0.0 mJ/m2 , AOR = 11◦ . (b) γ = 0.01 mJ/m2 , AOR = 24◦ . (c) γ = 0.02 mJ/m2 , AOR = 29◦ .
(d) γ = 0.04 mJ/m2 , AOR = 33◦ . (e) γ = 0.06 mJ/m2 , AOR = 34◦ . (f) γ = 0.08 mJ/m2 , AOR = 37◦ .
(g) γ = 0.1 mJ/m2 , AOR = 41◦ . (h) γ = 0.2 mJ/m2 , AOR = 57◦ . (i) γ = 0.4 mJ/m2 , AOR = 63◦ .
Figure 3: 2D projections of the powder piles and derived AOR values resulting from numerical funnel simulations based on the medium-sized
powder (d̄ = 34µm) and different surface energies γ .
AOR values observed for highly cohesive, small-grained powders. Again, the medium-sized powder, which is used
for model calibration in the following, shows a variation below 3◦ even for the smallest problem scaling a = a0 /4.
Finally, for verification of the presented experimental procedure, it shall be stated that experimental AOR values pre-
sented by Sun et al. [70] for a comparable Ti-6Al-4V powder with highly spherical particles and a size range that is
identical to the investigated coarse-grained powder (D10 = 46µm, D90 = 106µm) led to average AOR values of 32◦ ,
which is in very good agreement with Figure 4. Interestingly, Sun et al. [70] showed also that a Ti-6Al-4V powder
with identical size range, but considerably reduced sphericallity (i.e. higher effective rolling resistance) led to an
AOR value that is only by four degrees higher than for the aforementioned highly spherical Ti-6Al-4V particles. This
observation suggests that cohesion is the dominating factor and has a higher influence on the resulting AOR values,
and the bulk behavior of the considered Ti-6Al-4V powder in general, than the magnitude of and specific model for
rolling resistance.
11(a) Side length cube: a = a0 (16 samples). (b) Side length cube: a = a0 /2 (3 samples). (c) Side length cube: a = a0 /4 (3 samples).
Figure 4: Experimental AOR values for the three different powder size classes d̄ and the three different problem scalings (cube side lengths a).
According to Figure 4, the experimental results of the variant d̄ = 34µm and a = a0 /4, i.e. the variant that has also
been considered in the numerical simulations, lead to a mean AOR of ≈ 41◦ . According to Figure 3, this results fits
very well to the simulation results based on a surface energy of γ = 0.1 mJ/m2 , which thus will be considered as
(experimentally fitted) estimate for the effective surface energy γ0 = 0.1 mJ/m2 of the powder from now on. While
in the present study the mean experimental AOR value was already reasonably close to the AOR value of one of the
numerical parameter variants (i.e. the case γ = 0.1 mJ/m2 ), an interpolation of the AOR values associated with the
different numerical parameter variants will be required for this fitting strategy in general.
As already discussed in the last section, the ratio of adhesion to gravity force increases quadratically with decreasing
particle size. Thus, the effect of increasing / decreasing the mean particle diameter by a factor of two can be modeled
by decreasing / increasing the surface energy by a factor of four at otherwise unchanged parameters. To verify this
hypothesis, the parameter variants γ = γ0 , γ = γ0 /4, γ = 4γ0 will be considered in the following (see first column of
Figure 5). Experimentally, the equivalent cases of increasing / decreasing the mean particle diameter by a factor of
two is approximately captured by comparing the coarse-grained (increasing by a factor 2.1, third row of Figure 5) and
fine-grained (decreasing by a factor 2.4, first row of Figure 5) powder described above with the medium-sized powder
(factor 1.0, second row of Figure 5), which has been taken as reference for model calibration. The adhesion-to-gravity
force ratios for the cases γ = γ0 , γ = 4γ0 , γ = γ0 /4, γ = 0 as well as for the corresponding equivalent mean particle
diameters d̄ = d0 , d̄ = d0 /2, d̄ = 2d0 , d̄ → ∞, with d0 = 34µm, are illustrated in Table 1. From Table 1, it becomes
obvious that the cases γ = γ0 and γ = 4γ0 are characterized by adhesion forces that are one to two orders of magnitude
higher than the gravity forces. In this regime, the cohesiveness of the powder is already expected to have considerable
influence on the bulk powder characteristics [82].
d̄ = d0 , γ/γ0 : 0 0.25 1 4
γ = γ0 , d̄/d0 : ∞ 2 1 0.5
Fγ /FG : 0 3.25 13 52
Table 1: Surface energies and equivalent mean particle diameter and adhesion-to-gravity force ratios.
Besides these different experimental and numerical parameter cases, Figure 5 also visualizes the effect of the differ-
ent experimental problem scalings a = a0 /4, a = a0 /2, a = a0 (second to fourth column). For better comparison,
the triangles fitted to the numerical results for AOR measurement are indicated in the experimental images as well.
Experimental and numerical results show good qualitative agreement. Specifically, it can be observed that increasing
adhesion / decreasing particle size leads to: increasing angle of repose and powder pile height; increasing surface
roughness as well as tendency and size of cluster formation; decreasing size of curved impact zone at the top of the
powder pile. The latter observation might be explained by the higher mass / momentum of larger particles when im-
pacting on the powder pile and the lower adhesion forces (relative to gravity) attracting incident particles and impeding
their recoil. From a quantitative point of view, the experimental AOR values of the fine-grained and coarse-grained
powder can be compared with the equivalent numerical cases for verification purposes, while the case of the medium-
12(a) Sim.: γ = 4γ0 , a = a0 /4. (b) Exp.: d̄ = 14µm, a = a0 /4. (c) Exp.: d̄ = 14µm, a = a0 /2. (d) Exp.: d̄ = 14µm, a = a0 .
(e) Sim.: γ = γ0 , a = a0 /4. (f) Exp.: d̄ = 34µm, a = a0 /4. (g) Exp.: d̄ = 34µm, a = a0 /2. (h) Exp.: d̄ = 34µm, a = a0 .
(i) Sim.: γ = γ0 /4, a = a0 /4. (j) Exp.: d̄ = 72µm, a = a0 /4. (k) Exp.: d̄ = 72µm, a = a0 /2. (l) Exp.: d̄ = 72µm, a = a0 .
Figure 5: Numerical funnel results for powders with different surface energy γ (γ0 = 0.1mJ/m2 ) as well as experimental funnel results for powders
of different mean particle diameter d̄ and different problem scalings (base cubes of different edge length a with a0 = 10mm).
sized powder has already been taken for model calibration. The numerical and experimental AOR values associated
with the coarse-grained powder (third line in Figure 5) are in good agreement. This observation confirms the initial
proposition that the effect of increasing the mean powder particle size by a certain factor is equivalent to decreasing
the surface energy by the square of this factor. The experimental AOR values measured for the fine-grained powder,
however, are slightly higher than their numerical counterparts. This observation can be explained by the fact that the
mean particle diameter of the fine-grained powder is not exactly by a factor of 2, but rather by a factor of 2.4 smaller
than the mean particle diameter of the medium-sized reference powder, which is equivalent to an increased surface
energy by a factor of 2.42 ≈ 5.8. Furthermore, it becomes obvious again that due to the arguments stated above (strong
variation of surface energies / adhesive forces, cohesive particle clusters large compared to size of powder pile) the
AOR values as well as the powder pile morphology show stronger variations for the fine-grained powder.
It is also interesting to realize how drastically the AOR is underestimated in case no cohesion is considered at all
(see Figure 3(a)), even in comparison with the coarse-grained powder variant (see third line in Figure 5). On the one
hand, this might be explained by the employed velocity-proportional, viscous rolling resistance model (6), which has
13no contribution in static equilibrium configurations. There exist alternative, velocity-independent rolling resistance
models (similar to sliding friction, see e.g. [47]), which can certainly have influence on the static AOR values of
powder piles [85, 86]. On the other hand, considering the highly spherical particle shapes of the plasma-atomized
Ti-6Al-4V powder (see Figure 1) and the amount of plastic surface deformation predicted for this powder (see also
Section 2.2), it is expected that a physically reasonable choice of the rolling resistance coefficient underlying such a
model still leads to a rather limited mechanical contribution. Thus, it can be concluded that the consideration / neglect
of cohesion indeed makes the essential difference between realistic bulk powder behavior as observed in Figure 5(i)
and rather unphysical behavior as observed in Figure 3(a).
Apart from rolling resistance, also the sensitivity concerning the choice of other model parameters has been investi-
gated in the present study. According to Figure 6, the influence of increasing the penalty parameter by a factor of two,
the friction coefficient by a factor of 1.5 or the coefficient of restitution by a factor of 1.5 is rather small compared
to the influence of varied surface energy (see Figure 3). The high sensitivity of the bulk powder behavior concerning
the magnitude of surface energy as well as the strong variation of effective surface energy values for a given material
pairing suggest to calibrate this model parameter on the basis of bulk powder experiments and simulations, while
typical literature values can be taken for the remaining (less sensitive) material parameters in good approximation.
(a) Standard parameter set. (b) Modified.: kN = 2kN0 . (c) Modified.: µ = 1.5µ0 . (d) Modified.: cCOR = 1.5cCOR,0 .
Figure 6: Influence of varying penalty parameter, friction coefficient and coefficient of restitution on resulting AOR (γ0 = 0.1mJ/m2 ).
Finally, it shall be emphasized that the fitted value γ0 = 0.1mJ/m2 for the effective surface energy is considerably
lower than typical values that can be found for metal surfaces in the literature. While the theoretical value for metals
is in the range of 1000mJ/m2 , available experimental results measured for flat metallic contact surfaces are rather in
the range of 30 − 50mJ/m2 [18, 24, 31, 33, 66], which is still two orders of magnitude higher than the fitted value
γ0 = 0.1mJ/m2 found in the present study. The authors’ ongoing research work focuses on verification of this result
on the particle level via atomic force microscope (AFM) experiments. First AFM results suggest surface energies
slightly above the fitted value γ0 = 0.1mJ/m2 , but still in the same order of magnitude, i.e. below 1mJ/m2 .
Two conclusions can be drawn from this result: First, in order to improve the matching of single-particle (AFM ex-
periments) and bulk powder (AOR measurements) predictions for the surface energy, the proposed adhesion force
model might be further improved e.g. by accounting for the variation of the effective surface energy across differ-
ent particle pairings or for a potential contact pressure-dependence of pull-off forces. However, already the present
model (without these potential extensions) can be expected as sufficiently accurate for many applications since the
model parameter ”surface energy” has been fitted such that the experimentally observed bulk powder behavior could
be matched. The fact that the parameter choice γ0 = 0.1mJ/m2 leading to an optimal representation of the experimen-
tally observed bulk powder behavior depends on the specific adhesion force model (and, thus, might slightly deviate
from corresponding AFM results), has been reflected in the present work by denoting γ0 as estimate for the effective
surface energy. Second, in agreement with the AFM measurements performed by the authors so far, there is still strong
evidence that the surface energy values prevalent for the considered class of metal powders are considerably lower
than experimental values that can be found for flat metal contacts so far. As discussed in Section 2.3, adhesive forces
can easily vary by orders of magnitude depending on the geometrical and chemical properties of the contact surfaces
14(see also [61]). The present results suggest that factors of influence such as surface roughness and potential chemical
surface contamination / oxidation of the considered Ti-6Al-4V powder - which is known for its sensitivity concerning
moisture / oxidation - reduce the surface energy to values that are rather in the range of 0.1 − 1mJ/m2 . These findings
are expected to have considerable implications in applications based on fine metal powders e.g. concerning the powder
layer uniformity in metal AM processes such as selective laser melting, electron beam melting or binder jetting [53].
Based on the proposed calibration procedure, the powder model can easily be tailored to alternative powder materials.
4. Conclusion
The present work proposed a novel modeling and characterization approach for micron-scale metal powders relevant
for a broad range of applications, with a special focus on powder-bed fusion additive manufacturing processes. The
model is based on the discrete element method (DEM) and considers particle-to-particle and particle-to-wall interac-
tions involving frictional contact, rolling resistance and adhesive forces. A special emphasis was on the modeling of
cohesive effects, with an adhesion force law defined through the adhesive pull-off force in combination with a van-
der-Waals force curve regularization. While most model parameters are not particularly sensitive and hence have been
taken from the literature, the pull-off force defined by the effective surface energy between particles can easily vary by
several orders of magnitude and has, to the best of the authors’ knowledge, not been measured for the considered class
of metal powder so far. In order to close this crucial gap, we have performed respective experiments and fitted angle
of repose (AOR) values from numerical and experimental funnel tests for the considered, medium-sized Ti-6Al-4V
powder (mean particle diameter d̄0 = 34µm), which allowed to estimate the associated effective surface energy in good
approximation. Interestingly, the fitted surface energy value of γ0 = 0.1mJ/m2 is by four orders of magnitude lower
than theoretical values and by two orders of magnitude lower than typical experimental values measured for flat metal
contacts. Potential surface contamination / oxidation as well as increased surface roughness might be responsible for
the decay of this extreme short-range interaction.
Besides the fitted surface energy value γ = γ0 , also the cases of decreased / increased surface energies γ = γ0 /4
and γ = 4γ0 have been considered in the funnel simulations. The resulting powders piles showed a good agreement
in terms of AOR values and powder surface morphology with funnel experiments considering more coarse-grained
/ fine-grained powders with increased / decreased mean particle diameters d̄ = 2d̄0 and d̄ = d̄0 /2. This observation
confirmed the initial hypothesis that increasing / decreasing the mean powder particle size by a certain factor has an
equivalent effect on the (quasi-static) bulk powder behavior as decreasing / increasing the surface energy by the square
of this factor. Specifically, the choice γ = 4γ0 , representing the case of very fine-grained powders with mean diameter
d̄ = 14µm, led to adhesive forces that dominate gravity forces by almost two orders of magnitude. In this regime,
strongly increased AOR values as well as the presence of large cohesive particle agglomerates could be observed for
the resulting powder piles.
A comparison with the (theoretical) case γ = 0 revealed that a neglect of cohesive forces in the powder model leads
to a drastic underestimation of the AOR and, consequently, to an insufficient description of the bulk powder behavior
when employing the model in potential applications such as AM powder recoating simulations [53]. Eventually, the
present study demonstrated that the resulting angle of repose is more sensitive concerning the magnitude of surface
energy as compared to the magnitude of other powder material parameters such as particle stiffness, friction coefficient
or coefficient of restitution. The high sensitivity of the bulk powder behavior concerning the magnitude of surface
energy as well as the strong variation of effective surface energy values for a given material pairing suggest to calibrate
this model parameter on the basis of bulk powder experiments and simulations, while typical literature values can be
taken for the remaining (less sensitive) material parameters in good approximation.
Research work going on in parallel focuses on the verification of the fitted surface energy values on particle level
based on atomic force microscope (AFM) experiments, and on the application of the proposed powder model for
analyzing the powder recoating process in metal additive manufacturing processes [53].
15You can also read