Modernization of the North Pacific Fishing Fleet - Economic Opportunity Analysis November 2016
←
→
Page content transcription
If your browser does not render page correctly, please read the page content below

November 2016

Modernization of the
North Pacific Fishing Fleet
Economic Opportunity Analysis

    Prepared for                Prepared by
November 2016

          Modernization of the
          North Pacific Fishing Fleet
          Economic Opportunity Analysis

                                 Prepared for:

                                 Prepared by:

Cover photo sources: Vigor, Port of Seattle, Blue North, Fishermen’s Finest.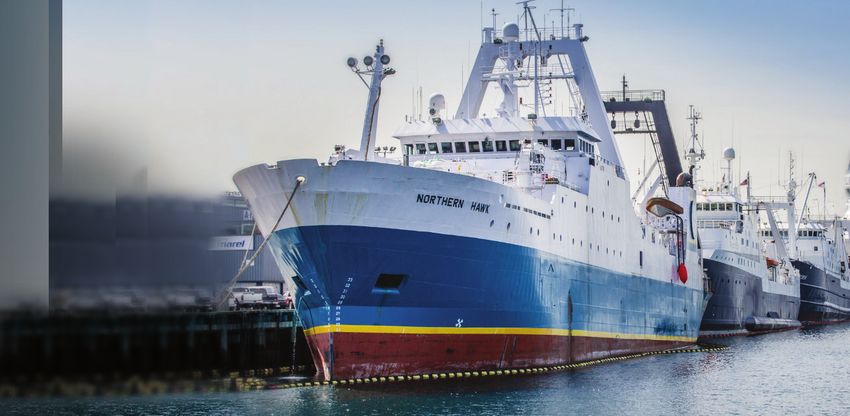
Table of Contents

Executive Summary ....................................................................................................................... 1
Introduction and Methodology ................................................................................................... 7
  Introduction ................................................................................................................................................................... 7
  Methodology................................................................................................................................................................. 7
  Abbreviations and Acronyms .................................................................................................................................. 9
  Glossary of Terms ........................................................................................................................................................ 9
North Pacific Fleet Profiles ......................................................................................................... 11
  Overview ....................................................................................................................................................................... 11
  American Fisheries Act Fleet.................................................................................................................................. 13
  Amendment 80 Fleet ................................................................................................................................................ 17
  Bering Sea/Aleutian Islands Crab Fleet ............................................................................................................. 19
  Freezer Longline Fleet .............................................................................................................................................. 20
  Other Trawl Vessels................................................................................................................................................... 22
  Other Fishing and Support Vessels..................................................................................................................... 23
Factors Affecting Fleet Modernization ..................................................................................... 25
  Vessel Replacement Costs...................................................................................................................................... 25
  Fishery Revenue Potential ...................................................................................................................................... 27
  Fisheries Rationalization.......................................................................................................................................... 28
  Community Development Quota Program...................................................................................................... 29
  Vessel Operating Costs ........................................................................................................................................... 30
  Seafood Market Conditions ................................................................................................................................... 32
  Financing Options ..................................................................................................................................................... 39
  Federal Regulations .................................................................................................................................................. 44
Timeline and Cost of Fleet Modernization ............................................................................... 46
  Fishing Vessel Construction Since 2000 ............................................................................................................ 47
  Timeline of Fleet Modernization .......................................................................................................................... 48
  Climate Change and Investments........................................................................................................................ 50
Economic Impact of Fleet Modernization................................................................................. 51
  Washington’s Maritime Industry.......................................................................................................................... 51
  Sources of Economic Impact ................................................................................................................................. 52
  Puget Sound Competitiveness ............................................................................................................................. 52
  Summary of Economic Impacts in Washington ............................................................................................. 55
  Conclusions and Recommendations .................................................................................................................. 56
Appendix ...................................................................................................................................... 58
  Interview Contacts ..................................................................................................................................................... 58
  Community Development Quota (CDQ) Group Key Assets ...................................................................... 59
Executive Summary
Modernizing the North Pacific commercial fishing fleet has become an increasingly important issue for
Washington’s maritime industry in recent years. With more than 400 federally permitted vessels over 58 feet,
and an average age of 40 years, the need to replace (or refurbish) older vessels represents significant economic
opportunity for the region – however, the specific nature and size of this opportunity has been uncertain. The
Port of Seattle contracted with McDowell Group, a research and consulting firm based in Alaska and
Washington, to conduct the following analyses:
Profile the North Pacific fishing fleet over 58
feet.
Identify and describe the factors that
influence modernization decisions.
Estimate the number and type of vessels likely
to be replaced or substantially modified over
the next decade.
Estimate the total value of these major
modernization projects and the resulting
Source: Aleutian Spray Fisheries.
economic impact on Washington State.
An important source of information for the study was a series of 45 interviews with a wide variety of
stakeholders, including vessel owners, seafood companies, shipyards, marine architects, regulatory agencies,
and lending institutions. Other data sources included the National Marine Fisheries Service, North Pacific
Fisheries Management Council, and the Commercial Fisheries Entry Commission, among others. Following are
key findings from the study.
Fleet Composition
The North Pacific fishing fleet consists of 414 federally permitted vessels of over 58 feet in length.
These are among more than 5,000 vessels over 30 feet engaged in commercial fishing activity off the coast
of Alaska. Vessels in the North Pacific fleet average 40 years old, but ages range widely.
Chart ES-1. North Pacific Fishing Fleet >58’, Number of Active Vessels by Decade Built, 2016
175
101
39 40
27
6 3 13 2 6 6
Source: Commercial Fisheries Entry Commission. Excludes five vessels due to unknown age.
Modernization of the North Pacific Fishing Fleet: Economic Opportunity Analysis McDowell Group Page 1
The North Pacific fleet represents a wide range of size (both number of vessels and vessel length)
and revenue generation. Average vessel length ranges from 96 feet for smaller trawlers, to over 400 feet
for floating processors. Average 2014 gross revenues ranged from $2 million for Bering Sea/Aleutian Island
(BSAI) trawl vessels to $16 million for American Fisheries Act (AFA) catcher/processors.
Current average vessel replacement costs likewise vary widely by fishery, ranging between $15 and
$130 million.
Chart ES-2. North Pacific Fishing Fleet >58’, Average Gross Revenue per Vessel, 2014 ($millions)
$16
$14
$6
$3 $3 $2
AFA CP Amendment 80 Freezer Longline AFA CV BSAI Crab BSAI/GOA Trawl
Chart ES-3. North Pacific Fishing Fleet >58’, Average Cost of a New Vessel ($millions)
$130
$78
$34
$19 $18 $15
AFA CP Amendment 80 Freezer Longline AFA CV BSAI Crab BSAI/GOA Trawl
Notes: AFA: American Fisheries Act; CP: Catcher/processors; CV: Catcher Vessels; BSAI: Bering Sea Aleutian Islands; GOA: Gulf of Alaska.
The AFA mothership category was excluded because of a lack of revenue data.
Source: NMFS SAFE Economic Status Report 2014, CFEC, McDowell Group estimates.
Fleet modernization is already underway. Since 2000, 19 North Pacific fishing vessels over 58 feet have
been built or significantly modified. Nine of these were either Amendment 80 or freezer longline vessels.
About one-third of these vessel projects occurred in Washington shipyards.
Source: O’Hara Corporation. Source: Dakota Creek Industries.
Modernization of the North Pacific Fishing Fleet: Economic Opportunity Analysis McDowell Group Page 2
Key Factors Affecting Fleet Modernization
A key impetus for modernization is the opportunity to add
new, more sophisticated processing capacity, as well as
increase fuel efficiency. Reducing fish waste and better utilizing
harvested volume is one of the most effective ways to increase
vessel earnings. Modern hull designs and propulsion equipment
offer the opportunity to save more than 30 percent on fuel cost.
The ability for individual fisheries to produce revenues
needed to support the cost of a new vessel is a constraint to
modernization. Significant differences exist among the various
North Pacific fisheries, with some more profitable than others.
Owners of catcher vessels with no on-board processing and
limited opportunity to add value to their harvest are less
motivated to modernize. In these situations, well-maintained
vessels that are 50 years old or older may continue to be
financially viable to operate. Source: Vigor.
Fisheries rationalization — conversion from open access
fisheries to quota allocation — has made modernization more attractive to both fishermen and
commercial lenders. Vessel owners are motivated because they have a more certain stake in the fishery,
and lenders are more interested because harvesting rights (typically in the form of transferable quota) make
future earnings more predictable and can also be used as collateral in many instances.
A variety of other factors influence the modernization decision. For example, costs associated with
safety regulations and general maintenance are typically lower for newer vessels. The added safety and
amenities of new or modified vessels make it easier to attract and retain high quality crew, especially with
an aging workforce.
Community Development Quota groups have
become an increasingly important player in
North Pacific fisheries. These non-profit groups,
which represent 65 Alaska communities, have an
ownership stake in 20 percent of active North
Pacific commercial fishing vessels.
Financing Vessel Construction
Fishing vessels represent a challenging lending
environment for commercial lenders. They
must assess a variety of risks associated with the
borrower, the fisheries the borrower participates
Source: Dakota Creek Industries.
in, the shipyard that will build the vessel, and
finally the attractiveness of alternative loans they could make with the same capital.
Modernization of the North Pacific Fishing Fleet: Economic Opportunity Analysis McDowell Group Page 3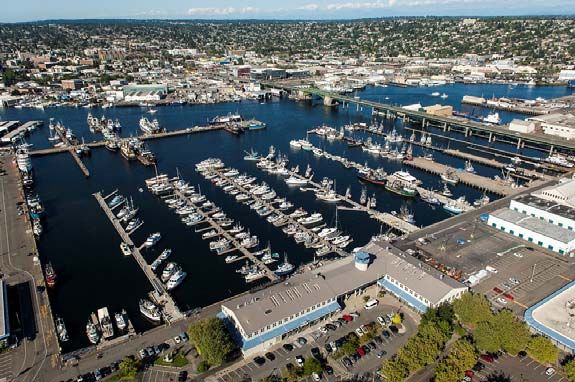
The terms of commercially available financing are an impediment for many vessel owners,
particularly those for which annual vessel earnings are a relatively small proportion of the cost of a
new vessel. This is particularly true of crab vessels and smaller trawlers, both of which have generated little
interest in modernization projects, given the costs involved. Companies that are not able to offer other
assets as collateral, in addition to the vessel, are also at a disadvantage.
The most common terms extended to a borrower interested in building a new vessel is a loan less
than 12 years and an interest rate of between 5 to 7 percent as of October 2016. Some government
programs or lending cooperatives can offer longer terms and lower interest rates, with some limitations.
Timeline of Fleet Modernization
The estimated replacement value of the entire North Pacific commercial fishing fleet of vessels over
58 feet in length, including recent builds, totals approximately $11.3 billion. The cost to replace vessels
in the fleet exceeding 30 years old is about $9.0 billion. Of these vessels, the replacement costs of those built
over 40 years ago is $4.4 billion.
Results of this analysis indicate $1.6 billion in modernization projects will be completed within the
next ten years, assuming no significant changes in financing options. Consolidation is anticipated in
every fleet. In some cases, vessels will be retired without replacement, and in others two or more vessels
will be replaced with a single larger or more efficient vessel.
For modernization of the fleet to occur at a pace greater than seen in recent years (and in addition
to other factors), an approach to vessel construction other than the typical “one-off” approach may
be required. For example, multiple purchasers might agree on a single hull configuration so that builders
can take advantage of efficiencies of scale. One-off construction is risky for owners, shipyards and lenders,
and most recent projects have experienced delays and cost overruns.
An average of three new vessels are expected (including major refurb/retrofit) each year between
2017 and 2021. By 2022 the annual number of projects is anticipated to increase to five per year, continuing
at a similar rate into the foreseeable future. This compares with roughly one vessel per year over the last 15
years.
Chart ES-4. Total Number of Vessel Projects by Five-Year Period,
Recent Past Vs. Future Projection
Number of Vessels Constructed 2002-2016: 19 ~22
Number of Vessels Projected to be Constructed 2017-2026: 37
~15
13
5
1
2002 to 2006 2007 to 2011 2012 to 2016 2017 to 2021 2022 to 2026
Source: McDowell Group estimates.
Modernization of the North Pacific Fishing Fleet: Economic Opportunity Analysis McDowell Group Page 4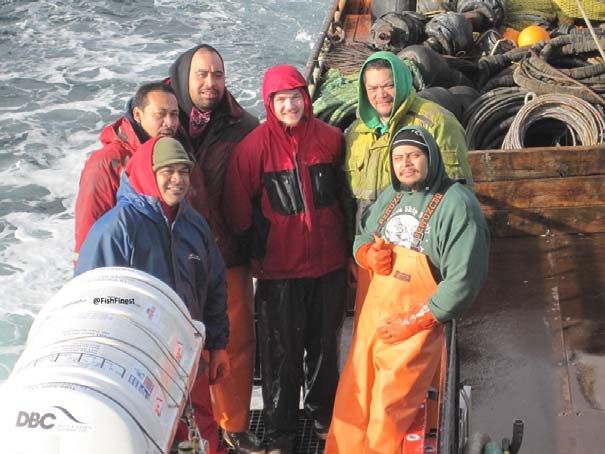
Economic Impact of Fleet Modernization on Washington
Approximately 50 percent of all
fleet modernization projects are
anticipated to take place in Puget
Sound. This somewhat higher rate of
market capture (compared to roughly
one-third for recent projects) reflects
current engagement of the region’s
maritime industry in identifying and
establishing cooperative opportunities
to maximize local benefit.
An estimated annual average of
between $60 and $90 million will be
spent on fleet modernization in Source: Vigor.
Washington between 2017 and
2026. A total of approximately $785 million will be spent over this ten-year period.
The total Washington State economic impact resulting from this spending is a projected 510 to 750
annual average jobs with approximately $40 to $60 million in wages, including all multiplier effects.
Annual output will average between $108 million and $160 million in over the next decade, totaling $1.3
billion.
Chart ES-5. Projected Economic Impacts in Washington State from North Pacific Fleet Modernization,
2017-2026
Average Annual Jobs Average Annual Wages Average Annual Output
750 $160
million
510 $108
million
$60
$40 million
million
2017-21 2022-26 2017-21 2022-26 2017-21 2022-26
Source: McDowell Group estimates.
Modernization of the North Pacific Fishing Fleet: Economic Opportunity Analysis McDowell Group Page 5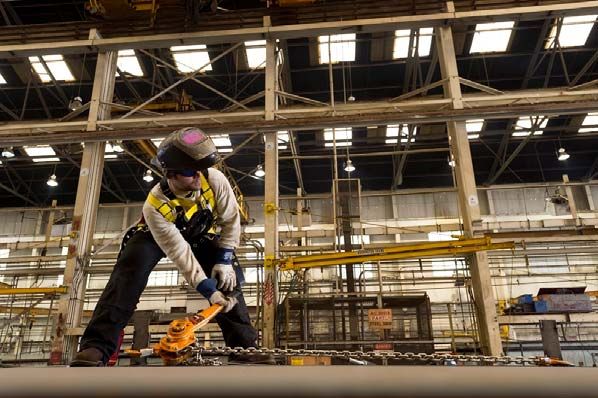
Conclusion and Recommendations
Puget Sound is the economic hub of the
North Pacific commercial fishing fleet,
which produces billions of pounds of
sustainably harvested seafood each year.
However, to maintain safety, economic
viability, and a competitive edge in a
global market, modernization of the fleet
must occur. While this clearly represents a
significant economic opportunity for the
Puget Sound region, some factors could
increase – or decrease – the potential size
of the opportunity.
Source: Port of Seattle.
Some factors are difficult to control, such
as global seafood prices, harvest volumes, and interest rates. Other factors, however, can be influenced with
concerted efforts, including:
Advocacy and support for:
o preservation of Puget Sound’s working waterfront
o improvement in transportation infrastructure
o workforce development and affordable housing
o collaboration among vessel owners, shipyards, and lenders
o maritime industry in Seattle, Olympia, and Washington, D.C.
Financing assistance:
o loan guarantees and reduced mooring rates for vessels constructed/modified in Washington
o education of the banking community on the fishing fleet
Facility improvements:
o increased dock space for the North Pacific fleet
o upgrades to Fishermen’s Terminal and Pier 91
o improve services and facilities on Harbor Island
It is incumbent upon Puget Sound stakeholders to encourage leadership and participation in the fleet
modernization effort, generating economic activity in the region for many years into the future.
Modernization of the North Pacific Fishing Fleet: Economic Opportunity Analysis McDowell Group Page 6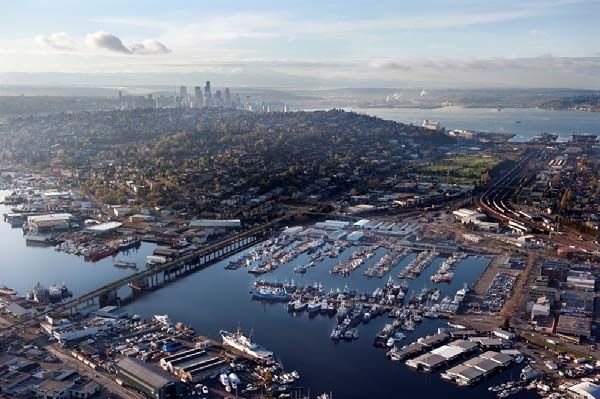
Introduction and Methodology Introduction The need to modernize the North Pacific fishing fleet that prosecutes federally managed fisheries has become a pressing topic for Washington’s maritime industry in recent years. In 2016, the fleet of vessels over 58 feet numbers 414 and averages 40 years in age – the economic opportunity suggested by these numbers is inarguable. Several new developments have put momentum behind the growing need to “recapitalize” including: the rationalization of federally managed fisheries to sustainably manage the resource into the future; the removal of legislation prohibiting new builds in certain fisheries; changing Coast Guard regulations; introduction of new onboard technologies increasing product utilization and efficiencies; and the successful completion of several new vessels and major modifications, to name a few.1 On the other side, however, are significant barriers: a challenging lending environment; fluctuations in seafood markets; the high cost of new vessels; and potential environmental changes, for example. These opportunities and challenges all contribute to the underlying questions facing the Pacific Northwest’s maritime industry: How many of these vessels are likely to be replaced or significantly modified in the coming years? What are the associated economic impacts of this activity? How can the Pacific Northwest retain these opportunities, rather than lose them to competing maritime economies elsewhere in the U.S.? To examine these questions, the Port of Seattle contracted with McDowell Group, a research and consulting company with a long history in North Pacific seafood and maritime sectors. An overview of project methodology and definitions for acronyms and key terms is provided below. Methodology Scope This report examines commercial fishing vessels over 58 feet engaged primarily in federally managed fisheries, including catcher vessels, catcher/processors, support vessels, and motherships.2 This length (the maximum length allowable for Alaska salmon seining vessels) was selected in order to focus the scope of the study on larger vessels, which are facing more constraints in terms of modernization. These larger vessels tend to be older, more expensive to replace, and require greater shipyard capacity and sophistication – and, modernization of these larger vessels promise a larger economic impact per vessel. Additionally, larger vessels have stronger ties to Washington: while most vessels 58 feet and under are homeported in Alaska, most vessels over 58 feet are homeported in Puget Sound. 1 The term “rationalized” refers to economic theory which has informed the design of management systems to align the short-term interests of market participants with “rational,” long-term efficiency of a market. 2 https://alaskafisheries.noaa.gov/permits-licenses?field_fishery_pm_value=Federal+Fisheries+Permits+%28FFP%29%2FFedera l+Processor+Permits+%28FPP%29 Modernization of the North Pacific Fishing Fleet: Economic Opportunity Analysis McDowell Group Page 7
These vessels were categorized per fishery, as follows:
Amendment 80
AFA CV (American Fisheries Act Catcher Vessels)
AFA CP (American Fisheries Act Catcher/Processors)
AFA Motherships
BSAI Crab (Bering Sea and Aleutian Islands)
Freezer Longline
Other Trawlers
Other (pot, jig, scallop, longline, support)
Interviews
An important source of information for this study was a series of interviews with 45 key informants in the
maritime industry. These contacts represented seafood companies, fishermen, shipyards, processing companies,
lending institutions, naval architects, fisheries associations, the Coast Guard, and the North Pacific Fisheries
Management Council. The interviews gathered information on drivers and barriers associated with
modernization; specific plans for new builds and upgrades; costs of new construction; the lending environment;
and the regulatory environment, among other subjects. Results of the interviews were used throughout the
analysis. A full list of interview contacts is included in the Appendix.
Data Sources
The North Pacific fleet inventory created for this study was based on several sources. Data on groundfish vessels
was largely compiled from the National Marine Fisheries Service (NMFS) Federal Fisheries Permit and NMFS
Groundfish LLP database, and divided into individual fisheries by program designations or listed endorsements
by gear type. This data was combined with the Commercial Fisheries Entry Commission (CFEC) vessel database,
which covers any vessel entering Alaska ports for deliveries, supplies, or fuel. Crab vessel information is based
on NMFS Federal Crab Vessel Permits, adjusted based on industry input, catch share program reviews, and the
North Pacific Fishery Management Council (NPFMC) Fishing Fleet Profiles. Data on revenue and harvest volumes
for select programs came from the NMFS Stock Assessment and Fishery Evaluation Report for the Groundfish
Fisheries of the Gulf of Alaska and Bering Sea/Aleutian Islands Area: Economic Status of the Groundfish Fisheries.
To avoid duplication of vessels (where one vessel participates in multiple fisheries), the study team attributed
each vessel to its primary fishery. The following protocol was followed.
Vessels active in the AFA sector are defined as AFA vessels.
Vessels active in both the Amendment 80 and AFA sector are defined as AFA vessels.
Freezer longline vessels that also harvest crab are defined as BSAI Crab vessels.
Vessels active in the BSAI crab fishery and other fixed gear fisheries are defined as BSAI Crab vessels.
Trawl vessels active in the GOA/BSAI region, and not in other previously mentioned categories, are
defined as Other Trawl vessels.
Fixed gear (longline, jig, pot) catcher vessels not included in any previous category were placed in the
Other Fixed Gear category.
All vessels falling outside the previous protocol were placed in an unduplicated Other Vessels category.
Modernization of the North Pacific Fishing Fleet: Economic Opportunity Analysis McDowell Group Page 8Information was also gathered from trade publications and websites including Fishermen’s News, IntraFish, and
SeafoodNews. Some data was inflation-adjusted using national CPI figures. For example, some NMFS data is
presented in 2010 values and was adjusted to 2014 values when appropriate.
Modeling
A model was developed to quantify the pace and magnitude of investment in modernization over the next ten
years. Model inputs include assumptions about the likelihood of investment in new-builds in each of the fleets,
the cost of replacing vessels in each fleet, and other factors pertinent to determining the intensity of
reinvestment in each of the fleets. A model was also used to predict the direct, indirect, and induced economic
impacts in Puget Sound associated with vessel construction at local shipyards.
All estimated vessel costs are derived from interviews with vessel owners, naval architects, and trade
publications. Estimated costs were averaged (by fishery) to arrive at the values presented in this report.
Abbreviations and Acronyms
ADF&G Alaska Department of Fish and Game
AKFIN Alaska Fisheries Information Network
AFA American Fisheries Act
BSAI Bering Sea/Aleutian Islands
CDQ Community Development Quota
EEZ Exclusive Economic Zone
GOA Gulf of Alaska
H&G Headed and gutted
IFQ Individual Fishing Quota
MSC Marine Stewardship Council
NMFS National Marine Fisheries Service
NPFMC North Pacific Fishery Management Council
TAC Total Allowable Catch
Glossary of Terms
Ex-Vessel Value The amount paid to fishermen by a processor for harvested seafood, typically
per round pound.
Ex-Vessel Volume The weight of seafood before any processing.
First Wholesale Value The value of a processed product when sold by a processor to an entity outside
of their affiliate network. Typically refers to the value of product as it leaves
Alaska.
Modernization of the North Pacific Fishing Fleet: Economic Opportunity Analysis McDowell Group Page 9First Wholesale Volume The weight of processed or packaged product, in net weight terms, produced
for sale to another buyer outside of the primary processor’s affiliate network.
Typically refers to the volume of processed product leaving Alaska.
Fixed Gear Refers to pot, longline, and jig commercial fishing gear.
Total Allowable Catch The total amount of a target species that can be harvested in a given time
period.
North Pacific Fleet Refers to the domestic fleet engaged primarily in federal fisheries off the coast
of Alaska.
Modernization of the North Pacific Fishing Fleet: Economic Opportunity Analysis McDowell Group Page 10North Pacific Fleet Profiles
Overview
Vessels operating in federally managed North Pacific fisheries are the largest commercial fishing vessels in the
nation. Many operate year-round, in the Bering Sea/Aleutians Islands (BSAI) or in the Gulf of Alaska (GOA),
fishing in multiple fisheries or tendering for salmon. Some vessels also spend time harvesting and processing
seafood in near-shore Alaska fisheries, while others participate in commercial fisheries off the West Coast.
Vessel Inventory
In 2016, more than 5,000 vessels over 30 feet in length engaged in commercial fishing activity off the coast of
Alaska.3 Of those vessels, 414 (8.2 percent) were over 58 feet and federally permitted.4 This report examines
commercial fishing vessels over 58 feet engaged primarily in federally managed fisheries, including catcher
vessels, catcher/processors, support vessels, and motherships.5
The table below provides the number of vessels, average age, length, and revenue by vessel category, with a
small amount of duplication. To avoid duplication later in modeling efforts and to create an accurate picture,
vessels operating in multiple fisheries were allocated to their primary fishery.6 For this reason, the number of
current vessels by fishery are slightly different in subsequent chapters of this report.
Table 1. Current North Pacific Fleet Over 58 Feet, by Vessel Category
Number of Average Year Average Length Average Revenue per
Category
Current Vessels Built (feet) Vessel ($millions)
AFA CV 86 1978 119 $2.82
AFA CP 16 1974 285 $15.92
AFA Motherships 3 1970 435 n/a
Amendment 80 18 1980 178 $13.52
BSAI Crab 103 1979 125 $2.7
Freezer Longline 29 1978 144 $5.82
Other Trawl 37 1978 97 $1.5
Other1 ~105 1966 79 n/a
1
Other vessel types include pot, jig, scallop, and longline catcher vessels as well as support vessels.
2
Revenue is CPI-adjusted from 2010 values.
Notes: This table includes a small number of duplicate vessels and primarily includes vessels that made deliveries in the specific
fishery. Depending on the data source, year built usually refers to when the keel was laid, not when the vessel was completed.
Source: CFEC vessel database, NMFS SAFE Economic Status Report 2014, AKFIN.
Seafood Value and Volume
In 2015, nearly 3 billion pounds of seafood worth $4.3 billion in first wholesale volume and value (volume and
value after primary processing) was harvested in waters off the coast of Alaska. Pollock is the largest component,
3
Note: This total includes support vessels such as tenders and freighters.
4
CFEC Database.
5
https://alaskafisheries.noaa.gov/permits-licenses?field_fishery_pm_value=Federal+Fisheries+Permits+%28FFP%29%2FFedera
l+Processor+Permits+%28FPP%29
6
Details on how a vessel’s primary fishery was determined can be found in the Introduction and Methodology chapter.
Modernization of the North Pacific Fishing Fleet: Economic Opportunity Analysis McDowell Group Page 11accounting for 32 percent of total value ($1.4 billion) and 43 percent of overall volume (1.3 billion pounds).
Other groundfish, including flatfish, Pacific cod, Atka mackerel, and rockfish, accounted for 18 percent of total
value ($781 million) and 26 percent of volume (777 million pounds). Crab, sablefish, and halibut – three of the
highest-value species – accounted for only 3.3 percent of volume (98.9 million pounds), but 14 percent of total
value ($601 million). Salmon, herring, and all other species totaled 35 percent of value ($1.5 billion) and 28
percent of volume (816 million pounds).7
Chart 1. First Wholesale Value and Volume for Alaska Seafood, 2015
Halibut & Halibut &
Sablefish, Sablefish,
$223 Pacific Crab, 65 34
Crab, $378 Cod, 336
Pacific Cod,
$468 Pollock, Flatfish,
$1,378 Rockfish,
& Atka Pollock,
Flatfish, Mackerel, 1,280
Rockfish, & 441
Atka
Mackerel, Salmon &
Salmon &
$313 Other
Other
Species, Species, 816
$1,503
Wholesale Value ($millions) Volume (millions of lbs.)
Source: NFMS SAFE Economic Status Report 2015.
Management of Sustainable Fisheries
Fisheries in the North Pacific Ocean are considered among the most sustainably managed in the world. North
Pacific fishery managers rely on stock assessments and other biological considerations to effectively manage
the fishery. Supported with science-based management practices, many of the large-scale commercial fisheries
in the North Pacific have undergone significant management changes to ensure long-term sustainability.
Most fisheries have been “rationalized,” meaning fishermen have access to a portion of the annual total
allowable catch (TAC), instead of racing to harvest the maximum amount of fish in the shortest amount of time.
Rationalized fisheries have been shown to increase both fishermen safety and product value while reducing
overfishing and bycatch.8
The North Pacific Fisheries Management Council (NPFMC) oversees fishery management for the Exclusive
Economic Zone (EEZ, 3 to 200 miles offshore). Members of the Council represent both public and private sector
interests from Alaska, Oregon, and Washington. NPFMC develops fishery management plans which guide the
sustainable harvest of species in the EEZ.9 Key individual programs are detailed in the following sections.
7
NFMS SAFE Economic Status Report, 2015.
8
https://www.st.nmfs.noaa.gov/Assets/economics/catch-shares/documents/Catch_Shares_Report_ExecSumm.pdf
9
http://www.adfg.alaska.gov/index.cfm?adfg=wildlifenews.view_article&articles_id=228
Modernization of the North Pacific Fishing Fleet: Economic Opportunity Analysis McDowell Group Page 12American Fisheries Act Fleet Fleet Composition and Activity The American Fisheries Act (AFA) fleet consists of catcher/processors, catcher vessels, and motherships, which harvest and process Alaska pollock in the BSAI region, one of the largest single species fisheries in the world. In 2014, the AFA fleet landed 2.4 billion pounds of pollock products worth $502 million.10 Pollock is a versatile fish that yields a variety of products, including fillets, surimi, roe, minced fish, and fish meal.11 Catcher vessels deliver whole fish to shoreside facilities in Dutch Harbor, Akutan, and other sites, or to nearby motherships which are floating processing vessels with no harvesting capability. Catcher/processors harvest and process pollock into a variety of products based on available on-board technology. Congress signed the AFA into law in 1998 to increase American ownership of fisheries Source: Port of Seattle. assets engaged in U.S. fisheries, rationalize the pollock fleet, and increase safety and utilization rates.12 Cooperatives were formed with catcher vessels and processing plants, catcher/processors, and motherships. The annual quota is split into four primary sectors. Following a 10 percent allocation to the Community Development Quota (CDQ) program, 50 percent of the remaining quota is allocated to the inshore sector (catcher vessels delivering to shoreside processors), 40 percent to the offshore sector (catcher/processors), and 10 percent to motherships. No processing or harvesting entity in the AFA program is permitted to own more than 17.5 percent of the annual pollock quota, although there is grandfathered quota ownership that is in excess of this cap. Fleet modernization was constrained until 2014 when Amendment 106 was passed by the NPFMC permitting vessel replacement. This regulatory change has already led to the replacement of some older vessels and is anticipated to result in additional replacements in the near future. The following section details each component of the AFA fleet. AFA Catcher Vessels AFA catcher vessels harvest pollock in the BSAI region using midwater trawl gear and deliver it to shoreside facilities primarily in Dutch Harbor and Akutan, and to at-sea processors. Some vessels in this fleet are active in 10 NMFS SAFE Economic Status Report, 2014. Note: This value includes both ex-vessel value for catcher vessels and first wholesale value for catcher/processors. 11 Surimi is a seafood product made from mild whitefish which is reformed and flavored to create many products, including imitation crab meat. 12 http://www.npfmc.org/american-fisheries-act-afa-pollock-cooperatives/ Modernization of the North Pacific Fishing Fleet: Economic Opportunity Analysis McDowell Group Page 13
other fisheries, including other groundfish and crab. In 2014, 86 vessels in this fleet harvested 1.5 billion pounds
worth $247 million in ex-vessel value, for an average of 17 million pounds worth $2.8 million per vessel.13
Surimi and fillets are the highest volume products processed from pollock harvested by the catcher vessel fleet.
In 2015, about 36 percent of the harvest was turned into surimi, and 29 percent was turned into fillets, worth
approximately $1 per pound and between
$1.20-$1.47 per pound, respectively. The
remainder goes into H&G, roe, minced,
fishmeal, whole fish, and other products.14
STATUS OF MODERNIZATION
The most recent addition to the AFA catcher
vessel fleet is the Defender, originally an East
Coast commercial fishing vessel.15 The 170-
foot vessel owned by Global Seas was
completed in 2016 following a significant
conversion at the Patti Marine shipyards in
Source: Global Seas.
Florida, which included the addition of 230
tons of steel.16
In comparison to the catcher/processor sector, the catcher vessel Table 2. AFA Catcher Vessel Descriptive
sector has experienced less recapitalization, likely due to its Statistics, 2014
inability to add value through onboard processing. However, it is
Number of Vessels 86
anticipated that vessels with large amounts of quota are most
Est. Replacement
likely to be upgraded. $19 million
Cost
Average Harvest
17.1 million lbs.
VESSEL INFORMATION Volume by Vessel
Average Revenue by
$2.8 million
Vessel
The average vessel in this fleet was built in the late 1970s and is
Average Length 119 feet
119 feet. Vessels set their trawl nets on schooled pollock and tow
Minimum Length 73 feet
from 20 minutes to 10 hours at a speed of 3.5-4.5 knots. Once the Maximum Length 180 feet
net is brought on-board, the fish are placed in refrigerated Average Year Built 1978
seawater for preservation until offloaded to a shoreside facility or Earliest Year Built 1949
mothership. Replacing a vessel in this fleet with a new, purpose- Most Recent Year
2006
Built
built trawler would cost an estimated $19 million.
Note: Revenue is CPI adjusted from 2010 numbers.
Source: NMFS SAFE Economic Status Report 2014,
CFEC Vessel Database.
AFA Catcher/Processors
In 2014, the AFA catcher/processor fleet was composed of 16 active vessels that harvest and process pollock
on-board. In 2014, this fleet harvested an estimated 981 million pounds worth $255 million dollars at the first
13
NMFS SAFE Economic Status Report, 2014.
14
NFMS SAFE Economic Status Report, 2015.
15
https://www.undercurrentnews.com/2016/02/04/global-seas-refits-pelagic-vessel-for-pollock-with-quality-focus/
16
http://www.fishermensnews.com/story/2016/08/01/features/new-170-foot-trawler-conversion-fv-defender-brings-modern-ideas-to-
the-bering-sea/408.html
Modernization of the North Pacific Fishing Fleet: Economic Opportunity Analysis McDowell Group Page 14wholesale level.17 One vessel is also in the Amendment 80 fleet, which allows it to engage in additional BSAI
groundfish trawl fisheries. Some of the catcher/processors in this fleet can harvest 880,000 pounds daily, and
stay on the fishing grounds for weeks at a time.
Surimi and fillet production are the
primary (by volume) products
processed by this fleet. However,
most vessels in this fleet also have the
capacity to produce fish meal and fish
oil. In 2015, surimi accounted for 34
percent of production (by volume)
with prices averaging $1.26 per
pound at the first wholesale level.
Fillets accounted for 30 percent of
production (by volume) with prices
between $1.39 and $1.58 per pound.18
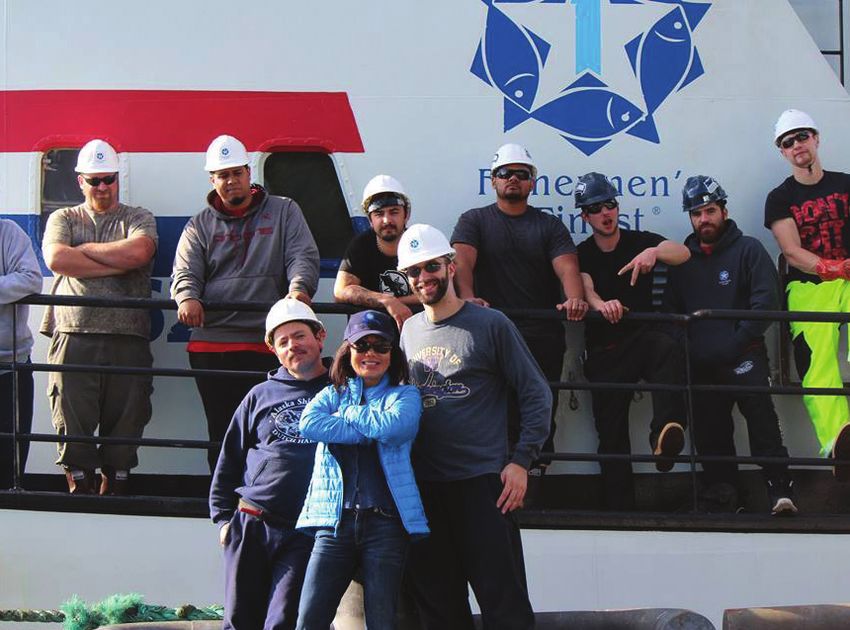
Source: Fishermen’s Finest.
The remaining products processed by
catcher/processors in this fleet include roe, mince, and fish meal, depending on the vessel’s unique processing
capabilities. Pollock processed by this fleet typically generates a market premium because of the reduced time
between harvesting and processing encountered by other fleets.19
Table 3. AFA Catcher/Processor
The catcher/processor fleet is represented by the Pollock Descriptive Statistics, 2014
Conservation Cooperative (PCC) where selling and leasing of
quota is widely practiced. In 2015, the two largest PCC quota Number of Vessels 16
shareholders were American Seafoods (47.4 percent) and Est. Replacement Cost $130 million
20 Average Harvest Volume
Trident Seafoods (18.6 percent). The remaining quota is held by Vessel
61.3 million lbs.
by Glacier Fish Company (17.0 percent), Arctic Storm (5.0 Average Revenue by
$15.9 million
Vessel
percent), Arctic Fjord (4.9 percent), Starbound (4.3 percent) and
Average Length 285 feet
Northern Hawk (2.7 percent). 199 feet
Minimum Length
STATUS OF MODERNIZATION Maximum Length 376 feet
Average Year Built 1974
Until Amendment 106 was passed in 2014, there was not a Earliest Year Built 1941
mechanism for permanent permit or vessel transfer within the Most Recent Year Built 1989
fleet. Most of the recent upgrades include factory upgrades, Note: Revenue is CPI-adjusted from 2010 numbers.
Source: NMFS SAFE Economic Status Report 2014,
such as a fish oil plant. CFEC Vessel Database.
Glacier Fish Company has three vessels (Pacific Glacier, Alaska Ocean, and Northern Glacier). They have
expressed interest in replacing the Pacific Glacier and upgrading the Alaska Ocean.21
The Starbound, owned by Aleutian Spray Fisheries, was upgraded with a 60-foot midsection for a
fishmeal and fish oil plant.
17
NMFS SAFE Economic Status Report, 2014.
18
Ibid.
19
NFMS SAFE Economic Status Report, 2015.
20
http://www.npfmc.org/wp-content/PDFdocuments/catch_shares/CoopRpts2014/PCC_HSCC_AFA14.pdf
21
https://www.undercurrentnews.com/2016/02/22/sources-glacier-building-iquique-us-trawler-plans-pollock-vessel/
Modernization of the North Pacific Fishing Fleet: Economic Opportunity Analysis McDowell Group Page 15 Confidential interviews with companies in this sector indicate at least two new replacement vessels
should be anticipated in the next few years.
VESSEL INFORMATION
Vessels in this fleet average 285 feet, and most were built in the early 1970s. However, many vessels in this fleet
were substantially rebuilt in the mid-1980s in foreign shipyards, including Norway, Germany, and South Korea.
The Anti-Reflagging Act of 1987 ended this practice.22 Following a buy-out of nine vessels and additional vessels
retiring, the fleet has consolidated to its existing size of 16 vessels. A purpose-built, new vessel in this fleet
would cost approximately $130 million.
AFA Motherships
The AFA identified three specific ships (Ocean Phoenix, Excellence, and Golden Alaska) which are allowed to
operate in the mothership sector. Motherships are large vessels with on-board processing capabilities but are
not configured to harvest fish. Instead, they rely on deliveries from approximately 20 catcher vessels. In 2015,
these motherships processed 252 million pounds of pollock.23 The motherships operate in the Bering Sea for
pollock and off the coasts of Washington and Oregon for Pacific whiting (hake).
The ability for motherships to follow a fleet of catcher vessels and reduce the time between harvest and
processing often increases the quality of products, resulting in a market premium over shoreside processed
seafood. In 2015, roe processed at-sea was worth $2.64 per pound compared with inshore sector roe worth
$1.55 per pound.24,25 Product lines differ vessel to vessel, but all produce surimi, roe, H&G, fillet, fishmeal, and
fish oil.
STATUS OF MODERNIZATION
The three vessels have multiple owners, including foreign ownership, but still have met the AFA requirements
for 75 percent U.S. vessel ownership. Maruha Nichiro, a large Japanese seafood company, owns shares in all
three motherships. Premier Pacific Seafoods owns shares in both the Ocean Phoenix and the Excellence. The
CDQ group, Yukon Delta Fisheries Development Association, owns 30 percent of the Golden Alaska, and has
their catcher vessels deliver directly to the mothership. Recent upgrades to these three vessels include:
$10 million was spent on Ocean Phoenix to install H&G pollock processing capabilities in 2004.26
Golden Alaska was modified for H&G, mince, and fish oil for $8 million in 2008 and can produce up to
770,000 pounds a day.27
The owners of the Excellence are considering upgrades to diversify its product lines to include pollock
fillet blocks.28
A mothership replacement would cost between $160 million and $200 million.29
22
J. Strong and K.R. Criddle. 2013. Fishing for Pollock in a Sea of Change: A Historical Analysis of the Bering Sea Pollock Fishery. Alaska Sea
Grant, University of Alaska Fairbanks.
23
http://www.npfmc.org/wp-content/PDFdocuments/catch_shares/CoopRpts2015/MothershipFleet_AFA15.pdf
24
NMFS SAFE Economic Status Report, 2015
25
This value includes roe processed by the AFA catcher/processor fleet.
26
Ibid.
27
Ibid.
28
https://www.undercurrentnews.com/2016/01/06/premier-pacific-moves-to-diversify-with-aims-to-produce-pollock-block/
29
Ibid.
Modernization of the North Pacific Fishing Fleet: Economic Opportunity Analysis McDowell Group Page 16VESSEL INFORMATION
Table 4. Mothership Sector Descriptive Statistics
Ocean Golden
Motherships operate for 120 to 130 days a Excellence
Phoenix Alaska
year, employ a crew of 100 to 220. They Length 635 305 367
were built between 1964 and 1973 and are Year Built 1964 1972 1973
between 305 and 635 feet long. The Source: NMFS SAFE Economic Status Report 2014, Cooperative Reports
2015, NMFS FAKR Groundfish LLP 2016, CFEC Vessel Database.
estimated cost to replace a mothership is
$170 million, with significant variation
depending on the size and complexity of the vessel.
Amendment 80 Fleet
Fleet Composition and Activity
The Amendment 80 fleet consists of
catcher/processors primarily harvesting, Atka
mackerel, Pacific Ocean perch, Pacific cod, and
three flatfish species (yellowfin sole, rock sole,
and flathead sole) in the BSAI region. In 2014,
18 vessels from this fleet were active, landing
511 million pounds worth $244 million at the
first wholesale revenue, for an average of
Source: O’Hara Corporation.
$13.5 million per vessel.30
The Amendment 80 catch share program refers to its namesake regulation that was passed in 2008, granting
fishing access privileges to a group of 28 catcher/processors operating in the BSAI that were non-American
Fisheries Act. The program does not allow an individual or company to own more than 30 percent of the total
available quota, with one exception grandfathered in (Fishing Company of Alaska). No single vessel can harvest
more than 20 percent of the quota.
The fleet is divided between two quota cooperatives (Alaska Groundfish Cooperative and Alaska Seafood
Cooperative). Quota can be moved among the fleet to most efficiently harvest the different species included in
this fishery.
Fish harvested by this fleet are processed either as frozen H&G products or as frozen whole fish. H&G Pacific
cod commands the highest price at the first wholesale level, averaging $1.43 per pound in 2015.31 H&G Atka
mackerel and rockfish averaged $1.04, and flatfish H&G products averaged $0.82 per pound. Prices for whole
fish vary by species, averaging $0.62 per pound. The fleet’s products are often exported to China for
reprocessing into a wide variety of fillets, kirimi (slices of fish), and other value-added products, before being
reimported into Europe, Japan, South Korea, and the United States.32
30
NMFS SAFE Economic Status Report, 2014.
31
NFMS SAFE Economic Status Report, 2015.
32
https://www.afsc.noaa.gov/News/pdfs/Wholesale_Market_Profiles_for_Alaskan_Groundifsh_and_Crab_Fisheries.pdf
Modernization of the North Pacific Fishing Fleet: Economic Opportunity Analysis McDowell Group Page 17Retention — the amount of seafood processed versus discarded Table 5. Amendment 80 Descriptive
after harvest — of the fleet’s harvest increased from 65 percent Statistics, 2014
in 2008 to 93 percent in 2014.33 Groundfish Retention Standards
Number of Vessels 18
— regulations requiring higher retention of groundfish brought
Est. Replacement
$78 million
onboard — has been reported as a factor possibly increasing Cost
Average Harvest
the pace of modernization in this fleet. 34 Volume by Vessel
28.4 million lbs.
Average Revenue
$13.5 million
Status of Modernization by Vessel
Average Length 178 feet
A prior barrier to modernization of this fleet was the limitation Minimum Length 110 feet
on replacing existing vessels, until the passage of Amendment Maximum Length 295 feet
97 by the NPFMC in 2012. Since the passage of Amendment 97 Average Year Built 1980
and Groundfish Retention Standards requirements, Earliest Year Built 1968
Most Recent Year
Amendment 80 fishing companies are building larger, more 1991
Built
modern vessels: Note: Revenue is CPI-adjusted from 2010 numbers.
Source: NMFS SAFE Economic Status Report 2014,
CFEC Vessel Database.
The O’Hara Corporation anticipates replacing both the
Defender and the Enterprise with the new 194-foot
Araho.35 Launched in 2016, the Araho was built in
Florida, where the O’Hara Corporation has a history of working with the Eastern Shipbuilding Group.36
Iquique U.S. is having a new 262-foot vessel built at the Eastern Shipbuilding Group shipyard, which will
replace two of their four existing vessels.37
Fishermen’s Finest has a 268-foot
Amendment 80 vessel under construction at
Dakota Creek Industries which will replace
one of their two Amendment 80 vessels.38
U.S. Seafoods completed repurposing of a
233-foot ex-Navy vessel to fish in the
Amendment 80 fishery in 2016. The cost of
this project was $30 million.39
Ocean Peace “sponsoned” (widened) the
Ocean Peace from 36 to 50 feet in Portland,
Oregon in 2012.40 Vigor Industrial conducted
this work. Source: O’Hara Corporation.
33
Amendment 80 5-Year Review, 2014.
34
https://www.undercurrentnews.com/2016/06/10/tighter-retention-rules-prompted-united-states-seafoods-vessel-refit/
35
http://www.freepressonline.com/Content/-bull-Special-Features/Special-Features/Article/The-O-Hara-Fishing-Dynasty/52/78/40589
36
http://www.easternshipbuilding.com/wp-content/sdaolpu/2015/09/ESG-H175-FV-ARAHO-OHara-Corporation-Launch-Press-Release-
Final-R-3.pdf
37
https://www.undercurrentnews.com/2016/02/22/sources-glacier-building-iquique-us-trawler-plans-pollock-vessel/
38
https://www.undercurrentnews.com/2015/03/09/alaska-groundfish-fleets-face-big-blow-from-halibut-bycatch-proposals/
39
https://www.undercurrentnews.com/2016/06/10/tighter-retention-rules-prompted-united-states-seafoods-vessel-refit/
40
http://www.oceanpeaceinc.com/ftoceanpeace.html
Modernization of the North Pacific Fishing Fleet: Economic Opportunity Analysis McDowell Group Page 18Vessel Information
The typical Amendment 80 vessel is nearly 180 feet in length and was built in the 1980s. Fish are harvested with
bottom trawl gear, where a net is towed between one and four hours at a speed of 3-4 knots.41 Seafood is
collected in a “cod-end,” which is then brought onboard for processing. A new, purpose-built vessel in this fleet
would cost an estimated $78 million.
Bering Sea/Aleutian Islands Crab Fleet
Fleet Activity and Composition
The BSAI crab fleet primarily harvests crab species,
with some vessels capable of harvesting other
groundfish. During the summer, it is common for
vessels in this fleet to tender salmon from small
harvesting vessels to processing facilities. In 2014,
108 vessels harvested 81 million pounds of crab
worth $246 million in ex-vessel value, an average of
750,000 pounds worth $2.7 million per vessel.42
Most crab is delivered to processing facilities in
Dutch Harbor, Akutan, King Cove, and St. Paul Island
and are cooked, frozen, and sorted by crab leg size.
Source: Alaska Bering Sea Crabbers.
In 2014, the most valuable species at the ex-vessel
level was king crab ($6.73 per pound), followed by snow crab ($2.51 per pound), and tanner crab ($2.45 per
pound).43,44 A small number of vessels can harvest and process crab on-board. The U.S. and Japan are the main
markets for king, tanner, and snow crab, which are sold in restaurants and grocery stores.
Harvest levels can fluctuate significantly in the crab fisheries, and the 2016/17 season will have a reduced harvest
across all species. The most significant is the closure of the tanner crab fishery, which could last until the biomass
rebounds to a threshold that allows for fishing. The king crab and snow crab TAC were cut 15 and 50 percent,
respectively, year-over-year for 2016/17.45
The BSAI crab fleet was rationalized in 2005, granting catch share allocations to catcher vessels that harvest
tanner, snow, and king crab using pot gear and processors.46 There are 10 distinct species under this program,
with quota allocations managed by cooperatives. CDQ groups are allocated 10 percent of each crab fishery,
with many owning additional shares.47 Depending on the species, vessels are limited to harvesting 2 to 20
41
NPFMC Fishing Fleet Profiles, 2012.
42
NMFS Crab Economic Status Report, 2014.
43
Ibid.
44
These are average prices for Bristol Bay red king crab, Bering Sea snow crab, and Bering Sea Tanner crab.
45
http://www.alaskajournal.com/2016-10-07/coming-season-going-hurt-alaska-crabbers#.V_1G7_krJhE
46
Refers to 10 different managed crab stocks in the BSAI region. Two are CDQ-harvest only. For more information, see the NMFS Crab
Economic Status Report 2014.
47
BSAI Crab 10 Year Review.
Modernization of the North Pacific Fishing Fleet: Economic Opportunity Analysis McDowell Group Page 19percent of the quota. These caps are waived in when a vessel is in a cooperative. The fishery is jointly managed
by the State of Alaska and NMFS.
Status of Modernization
Since 2000, just two new vessels have been added to this fleet, Table 6. BSAI Crab Sector Descriptive
the 90-foot Controller Bay (2002) and the 114-foot Victory Statistics, 2014
(2012). Fred Wahl Marine Construction built both vessels in
Number of Vessels 103
Reedsport, Oregon. Discussions with industry sources provide
Est. Replacement Cost $18 million
several theories to explain a lack of modernization. In contrast
Average Harvest Volume
to the freezer longline and Amendment 80 fleet, where there is 750,000 lbs.
by Vessel
opportunity to add value through modernizing onboard Average Revenue by
$2.7 million
Vessel
processing capacity, the vast majority of crab vessels have no Average Length 118 feet
opportunity to add value to their catch, resulting in reduced Minimum Length 81 feet
incentive or ability to reinvest. At the same time, harvest levels Maximum Length 180 feet
are significantly below historical levels, reducing earnings Average Year Built 1979
throughout the fleet along with the financial incentive to invest. Earliest Year Built 1942
Most Recent Year Built 2012
Vessel Information Source: NMFS Crab Economic Status Report 2014,
CFEC Vessel Database.
The typical crab vessel is around 118 feet in length and built in
the late 1970s. The vessels harvest with baited pot gear which sit on the seafloor for 24 to 60 hours at a time.
Depending on the species, vessels typically set more than 400 pots.48 Pots are retrieved, cleaned of crab, and
typically moved to another spot before being set again. Crab are stored alive in tanks with circulating water
until processed. The average replacement cost of a vessel in this fleet is $18 million.
Freezer Longline Fleet
Fleet Activity and Composition
The freezer longline fleet consists of catcher/processor vessels that harvest in both the BSAI and GOA regions.
In 2014, 29 vessels actively fished.49 Pacific cod is the primary target species (representing over 90 percent of
volume) with some vessels also targeting sablefish and Greenland turbot. In 2014, the freezer longline fleet
harvested 221 million pounds of cod worth $168 million, for an average of 7.6 million pounds worth $5.8 million
in first wholesale value.50 Since 2010, vessels in this fleet have participated in the Freezer Longline Conservation
Cooperative, a voluntary cooperative established by vessel owners to manage the harvest of the Pacific cod
quota allocated to the sector and minimize bycatch incurred by the fleet.
The fleet’s primary product is H&G cod.51 The remainder includes fillets and ancillary products such as livers,
stomachs, milt, and fish meal. The average utilization rate of this fleet was about 60 percent in 2015, with some
48
NPFMC Fishing Fleet Profiles, 2012.
49
NMFS SAFE Economic Status Report, 2014.
50
Ibid.
51
NFMS SAFE Economic Status Report, 2015.
Modernization of the North Pacific Fishing Fleet: Economic Opportunity Analysis McDowell Group Page 20newer vessels utilizing up to 90 percent of the product brought on board. Ancillary products have increased in
value as markets for the products have developed.
Status of Modernization
The freezer longline fleet has one of the widest vessel age ranges within the North Pacific fleet. In addition to
seven vessels built before or during WWII, four vessels have been built since 2000. About half of the freezer
longline fleet has some level of CDQ ownership, including five vessels that are 100 percent owned by CDQ
entities. Two of the three recent builds in this fleet have CDQ involvement.
There are two primary modernization approaches
used in this fishery: either build a larger, more
expensive vessel with additional harvesting and
processing capacity; or build a comparably
smaller, less expensive vessel which primarily
focuses on traditional H&G product. The Blue
North and Northern Leader fall into the first
category. They are larger vessels (more than 180
feet) with enough room to have additional on-
board capacity to process products typically Source: Blue North.
discarded or transshipped for reprocessing. (Blue
North is the first vessel in the fleet to have a fillet line.)52 In addition to the economies of scale realized by having
a larger vessel, the additional production capabilities maximize revenue by utilizing more of the harvest. The
latter approach is seen in the 136-foot Arctic Prowler, which focuses solely on traditional H&G products for both
sablefish and Pacific cod.
In 2014, Amendment 99 was implemented by the National Marine Fisheries Service (NMFS) to support the
replacement of aging vessels in the sector with safer, more efficient boats. Amendment 99 increased the
maximum vessel length limits of the LLP license
assigned to vessels in the fishery to 220 feet and
waived certain existing vessel length, weight, and
horsepower limits. NMFS described the action as
“necessary to promote safety-at-sea by encouraging
the replacement of older vessels with newer and
more efficient vessels that are able to meet modern
vessel safety standards.” The agency further noted
that the action “is intended to facilitate the increased
retention and utilization of groundfish by allowing
sector participants to use larger vessels with
increased processing and hold capabilities.”53
Source: Vigor.
52
http://www.fishermensnews.com/story/2016/10/01/features/welcome-blue-north/420.html
53
Final Rule for Amendment 99 to BSAI FMP; Federal Register Vol. 79 No. 3; Mon, Jan. 6, 2014.
Modernization of the North Pacific Fishing Fleet: Economic Opportunity Analysis McDowell Group Page 21You can also read