Molecular and Hormonal Aspects of Drought-Triggered Flower Shedding in Yellow Lupine
←
→
Page content transcription
If your browser does not render page correctly, please read the page content below
International Journal of
            Molecular Sciences

Article
Molecular and Hormonal Aspects of
Drought-Triggered Flower Shedding in
Yellow Lupine
Emilia Wilmowicz 1, *, Agata Kućko 2 , Sebastian Burchardt 1 and Tomasz Przywieczerski 1
 1    Chair of Plant Physiology and Biotechnology, Nicolaus Copernicus University, 1 Lwowska Street,
      87-100 Toruń, Poland
 2    Department of Plant Physiology Warsaw, University of Life Sciences-SGGW (WULS-SGGW),
      Nowoursynowska 159 Street, 02-776 Warsaw, Poland
 *    Correspondence: emwil@umk.pl; Fax: +48-566-114-440

 Received: 2 July 2019; Accepted: 30 July 2019; Published: 31 July 2019

 Abstract: The drought is a crucial environmental factor that determines yielding of many crop
 species, e.g., Fabaceae, which are a source of valuable proteins for food and feed. Herein, we
 focused on the events accompanying drought-induced activation of flower abscission zone (AZ)—the
 structure responsible for flower detachment and, consequently, determining seed production in
 Lupinus luteus. Therefore, detection of molecular markers regulating this process is an excellent tool
 in the development of improved drought-resistant cultivars to minimize yield loss. We applied
 physiological, molecular, biochemical, immunocytochemical, and chromatography methods for
 a comprehensive examination of changes evoked by drought in the AZ cells. This factor led to
 significant cellular changes and activated AZ, which consequently increased the flower abortion
 rate. Simultaneously, drought caused an accumulation of mRNA of genes inflorescence deficient in
 abscission-like (LlIDL), receptor-like protein kinase HSL (LlHSL), and mitogen-activated protein kinase6
 (LlMPK6), encoding succeeding elements of AZ activation pathway. The content of hydrogen peroxide
 (H2 O2 ), catalase activity, and localization significantly changed which confirmed the appearance
 of stressful conditions and indicated modifications in the redox balance. Loss of water enhanced
 transcriptional activity of the abscisic acid (ABA) and ethylene (ET) biosynthesis pathways, which
 was manifested by elevated expression of zeaxanthin epoxidase (LlZEP), aminocyclopropane-1-carboxylic
 acid synthase (LlACS), and aminocyclopropane-1-carboxylic acid oxidase (LlACO) genes. Accordingly,
 both ABA and ET precursors were highly abundant in AZ cells. Our study provides information
 about several new potential markers of early response on water loss, which can help to elucidate
 the mechanisms that control plant response to drought, and gives a useful basis for breeders and
 agronomists to enhance tolerance of crops against the stress.

 Keywords: abscisic acid; abscission zone; drought stress; ethylene; hormone homeostasis; yellow
 lupine; LlIDA; LlHSL; LlMPK6; catalase

1. Introduction
     Global climate changes have a significant effect on the temperatures on Earth, making the planet
increasingly warmer. Nowadays, the resulting soil drought is one of the most important factors limiting
plant growth and productivity of many crop species. It is estimated that in 25 years, this negative effect
of water loss will result in yield reduction by up to 30% [1]. The Fabaceae family species, among them
yellow lupine (Lupinus luteus L.), is affected by the strong correlation between weather conditions and
yielding. Since lupine seeds are characterized not only by high protein content, but also by having good

Int. J. Mol. Sci. 2019, 20, 3731; doi:10.3390/ijms20153731                          www.mdpi.com/journal/ijms
Int. J. Mol. Sci. 2019, 20, 3731                                                                      2 of 23

nutritional properties and a unique and desirable protein composition, this species is a sustainable food
and feed source. Additionally, studies performed in recent years have indicated that its consumption
provides numerous health benefits; for example, lupine ingredients have started to be used in probiotic
and nutraceutical production. The potential value of lupine in diabetes and obesity management may
be of relevance to public health. Furthermore, the plant’s ability to fix nitrogen, and the resulting
possibility of supplying that element to the following crops, are of interest to agronomists [2,3]. It is of
extreme importance to get the knowledge concerning the physiological aspects and mechanisms of
the plant’s response to drought stress, which includes identifying the molecules responsible for its
adaptation and survival under unfavorable conditions.
      Plant production is highly dependent on proper generative organ formation and detachment being
ensured until the seed formation and filling stages. Drought stress leads to excessive and premature
flower abscission, which blocks pod development and has a strong limiting effect on yielding. The place
of flower detachment is named the abscission zone (AZ). It is a specialized, spatially-limited structure
sensitive to unfavorable conditions [4]. Therefore, understanding how AZ activity is regulated is of
supreme importance to control yielding.
      According to our previous studies, the function of the AZ in yellow lupine depends on the
activity of phytohormones, such as ethylene (ET), abscisic acid (ABA) and auxin, which interact with
one another and are contributed in the subsequent AZ activation stages [5,6]. We have shown that
ABA influences the ET biosynthesis pathway, which is related to the aminocyclopropane-1-carboxylic
acid synthase (LlACS) gene, the ET precursor aminocyclopropane-1-carboxylic acid (ACC), and the
aminocyclopropane-1-carboxylic acid oxidase (LlACO) gene. The AZ exhibits specific features characteristic
for activation processes, which are also observed in the cellular ultrastructure [5]. We also revealed
that these modifications are accompanied by significant changes in the mRNA content and tissue
localization of the blade on petiole (LlBOP) transcript [7,8]. The studies performed in recent years on
Arabidopsis thaliana, Litchi chinensis, and Solanum lycopersicum indicated the presence of numerous
genetic components coordinating events that take place in the AZ cells, e.g., inflorescence deficient in
abscission (IDA), haesa/haesa-like2 (HAE/HSL2), nevershed (NEV), and mitogen-activated protein kinase
(MKK4/MKK5 and MPK6). IDA is a ligand for leucine-rich repeat receptor-like kinases HAE/HSL2.
The formation of the IDA–HAEHSL2 complex induces a MAP cascade within the cytoplasm of AZ
cells that activates transcriptional factors inducing organ abscission [9,10]. Our findings showed that a
homolog of the IDA gene in yellow lupine (LlIDA) is upregulated by ABA and ET, suggesting cross-talk
among phytohormonal and genetic pathways regulating flower separation, which is an intriguing
and unexplored area of research [11]. Recently, we have also presented specific localization of reactive
oxygen species in the AZ area following its activation, and paid attention to processes related to
oxidative stress [8].
      Despite considerable advancements in the research of abscission processes, still little is known
about the mechanism activated in AZ cells during environmentally-induced abscission, such as in
drought. Therefore, this study aims to analyze the contribution of various elements of hormonal and
genetic pathways of flower abscission in AZ-specific response to water deficit. In the presented paper,
the positive correlation between water deficit and cellular specific changes in AZ cells was explored.
We found that subsequent elements of the genetic pathways that activate abscission (LlIDA, LlHAE,
LlMPK6) were triggered in response to drought. Additionally, we observed disruption in the redox
balance. Our findings give a novel insight into the interplay between drought and abscission. Finally,
we propose a molecular model of AZ cells’ functioning under drought stress conditions.

2. Results

2.1. Lupine Biometric Parameters and Elements Composition Are Affected by Drought
    Lupines cultivated under drought developed fewer leaves when compared to plants subjected to
optimal moisture conditions (Supplementary Figure S8A). The average leaf area in the stress-treated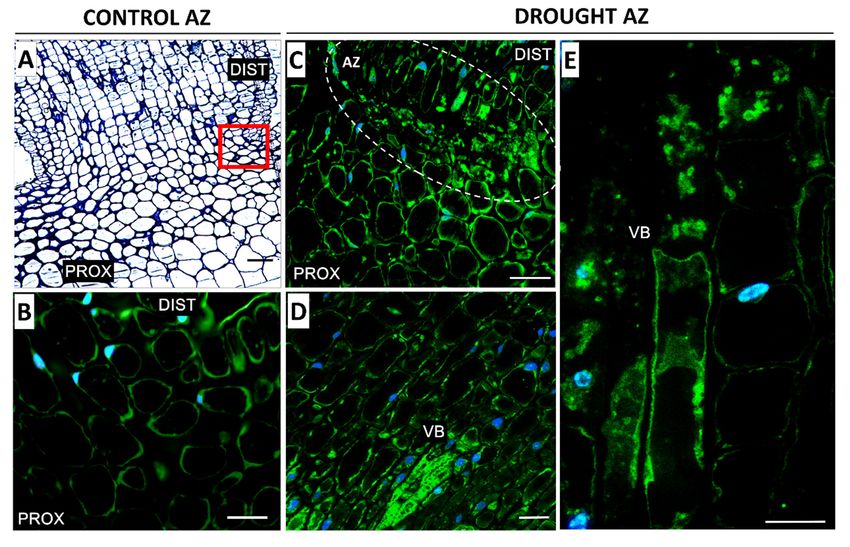
Int. J. Mol. Sci. 2019, 20, 3731                                                                                                                3 of 23

plants was lower (~33%) than in the control (Supplementary Figure S8B). Additionally, drought
decreased their photosynthetic activity. The Fv/Fm parameter reached lower values in the leaves
of drought-treated lupines (Supplementary Figure S8C). In the next step, we found that plant
cultivation under soil drought conditions decreased leaf water content (Supplementary Figure S9).
Drought-stressed plants exhibited a different element composition in the leaves. Fe content dropped,
both on the 48th and 51st days of cultivation (Supplementary Figure S10). It should be noted that
the content of this microelement, in the stressed plants and in the control, was significantly lower on
the 48th day when compared to 51st. The drought decreased the concentrations of K and P, as well,
and this effect was age-dependent (Supplementary Figure S10). The younger leaves of the control
                  Int. J. Mol. Sci. 2018, 19, x FOR PEER REVIEW                                                                   3 of 23
plants and the drought-stressed organs contained more K than the older ones (Supplementary Figure
S10). A similar tendency
                  both on the 48th    was  andobserved         for P (Supplementary
                                                 51st days of cultivation   (Supplementary FigureFigure
                                                                                                      S10). ItS10).
                                                                                                              should Soil   drought-stress
                                                                                                                      be noted that the       caused
                  content of this microelement, in the stressed plants and in the control, was significantly lower on the
significant differences        in    the    Na,      S, and   Zn   contents       in  the  leaves     of  51-day-old
                  48th day when compared to 51st. The drought decreased the concentrations of K and P, as well, and
                                                                                                                           plants     (Supplementary
Figure S11), whereas
                  this effectit had       no effect on
                                 was age-dependent             their levelFigure
                                                           (Supplementary      in 48-day-old        plants,
                                                                                      S10). The younger         except
                                                                                                           leaves          for Na
                                                                                                                  of the control      (Supplementary
                                                                                                                                 plants
                  and the drought-stressed organs contained more K than the older ones (Supplementary Figure S10).
Figure S11). The largest differences in the drought-treated plants when compared to the control were
                  A similar tendency was observed for P (Supplementary Figure S10). Soil drought-stress caused
observed for Na.significant differences in the Na, S, and Zn contents in the leaves of 51-day-old plants (Supplementary
                  Figurein
     Drought stress         S11),
                                the  whereas
                                        studied  it hadAZ
                                                        no effect on their level
                                                             fragments           in 48-day-old
                                                                               was             plants, except
                                                                                      manifested               for Na (Supplementary
                                                                                                        by lower       water content (Figure 1A)
                  Figure S11). The largest differences in the drought-treated plants when compared to the control were
and had a positive        effect
                  observed for Na.    on    the     aborted     flower       percentage      (Figure      1B).   The    control plants cultivated
under optimal soil moisture
                          Drought stress   conditions
                                               in the studieddeveloped
                                                                AZ fragmentsan  wasaverage
                                                                                     manifestedofby12lower
                                                                                                        flowers,    with (Figure
                                                                                                             water content  60% of  1A)them becoming
                  and had a positive effect on the aborted flower percentage (Figure 1B). The control plants cultivated
aborted. Soil drought            increased this parameter’s value, causing ~90% of the flowers to be aborted
                  under optimal soil moisture conditions developed an average of 12 flowers, with 60% of them
(Figure 1B).      becoming aborted. Soil drought increased this parameter’s value, causing ~90% of the flowers to be
                       aborted (Figure 1B).

       Figure 1. The influence      ofinfluence
                        Figure 1. The   soil drought        stress
                                                 of soil drought     ononthe
                                                                 stress     the water      content
                                                                                 water content         in flower
                                                                                                in flower abscissionabscission
                                                                                                                      zone (AZ) [%] zone (AZ) [%]
                        (A) and flower abortion rate (%) (B) in Lupinus luteus. Control plants were growing in soil of optimal
       (A) and flower abortion rate (%) (B) in Lupinus luteus. Control plants were growing in soil of optimal
                        moisture (70% holding capacity; WHC). In parallel, part of plants was subjected to drought conditions
       moisture (70% holding
                        for 2 weekscapacity;
                                     (25% WHC).  WHC).       In parallel,
                                                    Plant material for waterpartcontentofmeasurements
                                                                                           plants waswas   subjected     tothedrought
                                                                                                              collected on     48th    conditions
       for 2 weeks (25%and   51st daysPlant
                          WHC).        of cultivation
                                              material(A). The
                                                            fornumber
                                                                waterofcontent
                                                                            aborted flowers    per one lupine was
                                                                                        measurements          was counted   and the
                                                                                                                     collected    on the 48th and
                        data were presented as averages of 15 technical replicates ± SE. Significant differences to stress plants
       51st days of cultivation     (A).
                        in comparison      The number
                                       to control             ofasaborted
                                                   are indicated    * p < 0,05, flowers      per onet-test).
                                                                                ** p < 0.01 (Student’s   lupine was counted and the data
       were presented as averages of 15 technical replicates ± SE. Significant differences to stress plants in
       comparison to control are indicated as * p < 0,05, ** p < 0.01 (Student’s t-test).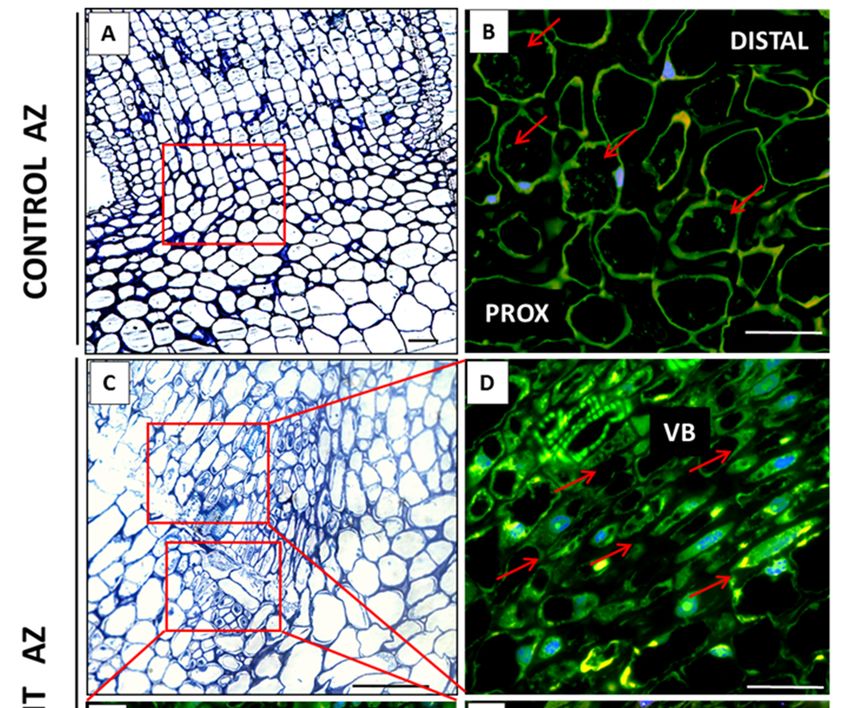
Int. J. Mol. Sci. 2019, 20, 3731                                                                                       4 of 23

Int. J. Mol. Sci. 2018, 19, x FOR PEER REVIEW                                                                          4 of 23
2.2. AZ Cells Exhibited Different Structure During Drought
2.2. AZ Cells Exhibited Different Structure During Drought
      Drought caused middle lamellae dissolution, which consequently led to cell-to-cell adhesion
      Drought
loss and   tissuecaused  middle
                   integrity       lamellaeindissolution,
                              disruption      the AZ area which  consequently
                                                            (Figure  2E,F). The led
                                                                                cellstocontained
                                                                                        cell-to-cellmany
                                                                                                    adhesion  loss
                                                                                                          cellular
and   tissue and
aggregates    integrity  disruption in thenuclei
                   large protein-enriched       AZ area   (Figure
                                                     (Figure       2E,F).
                                                              2G,H).      The cells
                                                                     Coomassie         contained
                                                                                  staining          many cellular
                                                                                             also revealed higher
protein contents in the cells after drought treatment (Figure 2G,H) than in the control (Figurehigher
aggregates    and  large protein-enriched     nuclei (Figure  2G,H). Coomassie    staining   also revealed 2C,D).
protein
Inactivecontents
          AZ cells in  the round
                     were   cells after
                                    anddrought   treatment(Figure
                                        loosely arranged     (Figure2A,B).
                                                                      2G,H) than in the control (Figure 2C,D).
Inactive AZ cells were round and loosely arranged (Figure 2A,B).

      Figure 2.
      Figure      The impact
              2. The    impact of
                                of soil
                                   soil drought
                                         drought stress
                                                    stress (25%
                                                           (25% WHC)
                                                                  WHC) on on the
                                                                              the structural
                                                                                   structural features
                                                                                               features in
                                                                                                         in the
                                                                                                            the flower
                                                                                                                 flower
      abscission  zone  (AZ) of Lupinus   luteus. For observations,  sections  of AZ  were  excised on
      abscission zone (AZ) of Lupinus luteus. For observations, sections of AZ were excised on the 48ththe  48th day  of
                                                                                                                    day
      cultivation.  Samples  of AZ  from    control and  drought-stressed   plants  were  stained  with
      of cultivation. Samples of AZ from control and drought-stressed plants were stained with toluidinetoluidine   blue
      (A,B,E,F) or Coomassie
      blue (A,B,E,F)            Brilliant
                       or Coomassie        Blue (C,D,G,H).
                                        Brilliant             ImagesImages
                                                  Blue (C,D,G,H).     B, D, F,B,
                                                                               andD,HF,are
                                                                                        andmagnifications   of different
                                                                                             H are magnifications     of
      areas presented    in A, C, E,  G,  respectively.   AZ   area was  marked    by  black  dotted circle
      different areas presented in A, C, E, G, respectively. AZ area was marked by black dotted circle       (A,C,E,G).
      Abbreviations:   PROX—stem
      (A,C,E,G). Abbreviations:        fragments below
                                    PROX—stem              the AZ,
                                                     fragments      DIST—flower
                                                                  below             pedicel fragments
                                                                         the AZ, DIST—flower            above
                                                                                                   pedicel      the AZ.
                                                                                                             fragments
      Scale bars:  40 µm.
      above the AZ. Scale bars: 40 µm.
2.3. Drought Induces Expression of Components of IDA/HAE/MPK6 Pathway in AZ
2.3. Drought Induces Expression of Components of IDA/HAE/MPK6 Pathway in AZ
     A complete cDNA sequence of the LlHSL gene was identified, and our analyses of the predicted
     A complete cDNA sequence of the LlHSL gene was identified, and our analyses of the predicted
LlHSL protein performed using ProtComp indicated its membrane localization (Supplementary Figure
LlHSL protein performed using ProtComp indicated its membrane localization (Supplementary
S6). By sequencing PCR products, a cDNA fragment of the LlMPK6 gene was obtained (Supplementary
Figure S6). By sequencing PCR products, a cDNA fragment of the LlMPK6 gene was obtained
Figure S7).
(Supplementary Figure S7).
     Drought significantly modulated the transcriptional activity of the gene encoding elements of
     Drought significantly modulated the transcriptional activity of the gene encoding elements of
the molecular abscission-associated pathway: LlIDL, LlHSL, and LlMPK6 (Figure 3). LlIDL expression
the molecular abscission-associated pathway: LlIDL, LlHSL, and LlMPK6 (Figure 3). LlIDL expression
was five times higher in the floral AZs of the stressed plants as compared with the control on the
was five times higher in the floral AZs of the stressed plants as compared with the control on the 48th
48th day of cultivation and maintained high in the subsequent stage (Figure 3A). LlHSL transcription
day of cultivation and maintained high in the subsequent stage (Figure 3A). LlHSL transcription was
was also significantly up-regulated in the subsequent time-variants of the plants subjected to drought
also significantly up-regulated in the subsequent time-variants of the plants subjected to drought
(Figure 3B). It should also be pointed out that the expression of LlHSL, similarly to LlMPK6, was
(Figure 3B). It should also be pointed out that the expression of LlHSL, similarly to LlMPK6, was
enhanced in the floral AZs of non-stressed plants during development (48th and 51st days, Figure 3B,C).
enhanced in the floral AZs of non-stressed plants during development (48th and 51st days, Figure
Nevertheless, the strong stimulation of the LlMPK6 gene was noticed in the floral AZs of the plants
3B,C). Nevertheless, the strong stimulation of the LlMPK6 gene was noticed in the floral AZs of the
subjected to drought, both on the 48th and 51st days of their development (Figure 3C).
plants subjected to drought, both on the 48th and 51st days of their development (Figure 3C).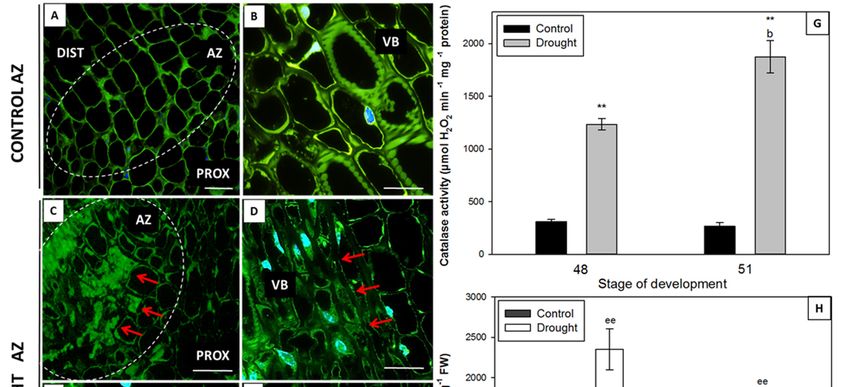
Int. J. Mol. Sci. 2019, 20, 3731                                                                                                         5 of 23
                Int. J. Mol. Sci. 2018, 19, x FOR PEER REVIEW                                                                         5 of 23

      Figure 3. Transcriptional       activity of
                   Figure 3. Transcriptional        LlIDL
                                                activity      LlIDLLlHSL
                                                          of (A),           (B), (B),
                                                                     (A), LlHSL    andandLlMPK6
                                                                                             LlMPK6(C) (C)(related      LlACT)
                                                                                                                    toLlACT)
                                                                                                           (related to           in in
                                                                                                                                     thethe
                   yellow   lupine  flower abscission   zone   (AZ)  subjected   to drought.   Control  plants
      yellow lupine flower abscission zone (AZ) subjected to drought. Control plants were growing in soil of    were  growing    in soil
                   of optimal moisture (70% WHC), while part of plants was subjected to drought conditions for 2 weeks
      optimal moisture     (70% WHC), while part of plants was subjected to drought conditions for 2 weeks
                   (25% WHC). For gene expression profiling, AZs were harvested on the 48th and 51st days of
      (25% WHC). For gene expression profiling, AZs were harvested on the 48th and 51st days of cultivation.
                   cultivation. Data are presented as averages ± SE. For LlIDL expression, significant differences in
      Data are presented     as averages
                   stressed plants           ± SE. For
                                     in comparison         LlIDLplants
                                                     to control     expression,      significant
                                                                          are indicated             differences
                                                                                          as ** p < 0.01,          in stressed
                                                                                                          and significant          plants
                                                                                                                           differences
      in comparison    to controlstressed
                   in 51-day-old     plantsplants
                                              are indicated
                                                    in comparison         < 0.01, and
                                                                 as **top48-day-old       significant
                                                                                       plants             differences
                                                                                              are indicated             inFor
                                                                                                              as p < 0.05.
                                                                                                                a           51-day-old
                                                                                                                                LlHSL,
      stressed plants   in comparison
                   significant  differencestoin48-day-old
                                                stressed plants plants   are indicated
                                                                   in comparison     to control   p < 0.05.
                                                                                           as a plants        For LlHSL,
                                                                                                         are indicated  as hhsignificant
                                                                                                                              p < 0.01,
                   significant
      differences in stresseddifferences
                                 plants inin    51-day-old control
                                              comparison               plantsplants
                                                                to control     in comparison     to 48-day-old
                                                                                       are indicated             p < 0.01,
                                                                                                          as hh plants  are indicated
                                                                                                                             significant
      differences in 51-day-old control plants in comparison to 48-day-old plants are indicated as d p < 0.05,
      and significant differences in 51-day-old stressed plants in comparison to 48-day-old stressed plant are
      indicated as cc p < 0.01. For LlMPK6, significant differences in stressed plants in comparison to control
      plants are indicated as ˆˆ p < 0.01, significant differences in 51-day-old control plants in comparison to
      48-day-old plants are indicated as e p < 0.05, and significant differences in 51-day-old stressed plants in
      comparison to 48-day-old stressed plants are indicated as bb p < 0.01 (Student’s t-test).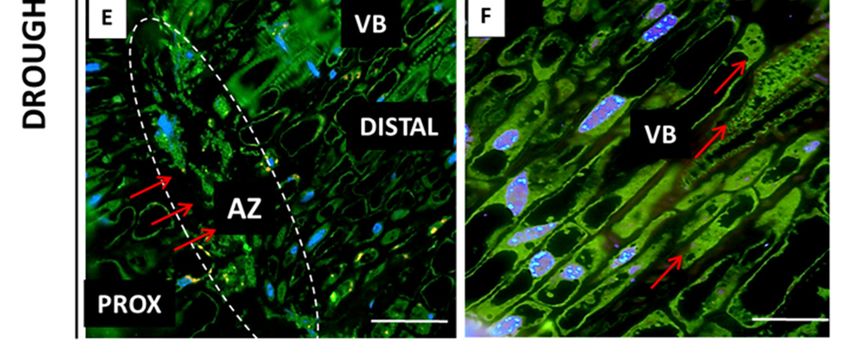
as d p < 0.05, and significant differences in 51-day-old stressed plants in comparison to 48-day-old
        stressed plant are indicated as cc p < 0.01. For LlMPK6, significant differences in stressed plants in
        comparison to control plants are indicated as ^^ p < 0.01, significant differences in 51-day-old control
        plants in comparison to 48-day-old plants are indicated as e p < 0.05, and significant differences in 51-
Int. J. Mol. Sci. 2019, 20, 3731                                                                                6 of 23
        day-old stressed plants in comparison to 48-day-old stressed plants are indicated as bb p < 0.01
        (Student’s t-test).
     In the floral AZ cells of the plants cultivated under soil drought conditions, a high level of
     In the floral
fluorescence,      AZ cells
              indicating       of the plants
                         the presence        cultivated
                                       of MPK6,          under soil
                                                  was observed      drought
                                                                (Figure       conditions,
                                                                        4C). What  is more,aa high
                                                                                              stronglevel of
                                                                                                      signal
fluorescence,
was            indicating
     noted in the  vascularthebundle
                                presence  of MPK6,
                                      (Figure 4D,E).was   observed (Figure
                                                      Fluorescence           4C). What
                                                                    was detected   withinis the
                                                                                            more,  a strong
                                                                                                cytoplasm,
signal  was  noted   in the  vascular   bundle  (Figure  4D,E).  Fluorescence   was   detected   within
which contained numerous aggregates emitting an intensive signal (Figure 4E). On the other hand, the     the
cytoplasm,  which   contained    numerous   aggregates  emitting
non-active AZ cells contained much less MPK6 (Figure 4B).        an intensive  signal  (Figure  4E). On  the
other hand, the non-active AZ cells contained much less MPK6 (Figure 4B).

     Figure 4. Immunofluorescence localization of MPK6 in the abscission zone (AZ) of yellow lupine
     Figure 4.
     flowers     Immunofluorescence
             grown                       localization
                     under drought conditions      (C–E)ofand
                                                           MPK6    in control
                                                               in the  the abscission zoneAZs
                                                                              AZ (B). The    (AZ)
                                                                                                wereof excised
                                                                                                       yellow lupine
                                                                                                               on the
     flowers  grown   under   drought   conditions   (C–E)  and  in the  control AZ  (B). The AZs
     48th day of development. Control plants were cultivated under optimal soil conditions (70%      were  excised
                                                                                                              WHC),on
     the  48th  day  of development.     Control   plants  were   cultivated  under  optimal   soil  conditions
     whereas stressed plants were subjected to drought for 2 weeks (25% WHC). The AZ region of stressed          (70%
     WHC),was
     plants  whereas    stressedbyplants
                  highlighted       whitewere
                                           linessubjected  to drought
                                                 (C). Images   D and Efor   2 weeks
                                                                         present the(25%   WHC).
                                                                                     vascular       The AZ
                                                                                               bundle       region
                                                                                                        area. Nucleiof
     stressed  plants was   highlighted   by  white lines (C). Images   D  and E present  the vascular
     were stained with DAPI. The examined region of control AZ used in the immunofluorescence studies    bundle  area.
     Nuclei
     os      were by
        indicated  stained
                      a red with  DAPI.
                             square  (A). The  examined region
                                          Abbreviations:           of control
                                                            PROX—stem         AZ usedbelow
                                                                           fragments   in thethe
                                                                                              immunofluorescence
                                                                                                  AZ, DIST—flower
     studies  os  indicated   by  a red  square   (A). Abbreviations:     PROX—stem      fragments
     pedicel fragments above the AZ, VB—vascular bundles. Scale bars: 100 µm (A, C), 40 µm            below  the AZ,
                                                                                                          (B,D,E).
     DIST—flower pedicel fragments above the AZ, VB—vascular bundles. Scale bars: 100 µm (A, C), 40
2.4. Water  Deficit Influences H2 O2 Level and Changes Localization and Activity of Catalase
     µm (B,D,E).
     Drought stress caused an increase in the level of hydrogen peroxide in the flower AZ (Figure 5H)
2.4. Water
and         Deficit
     enhanced     theInfluences
                        activity H
                                 of2O 2 Level and Changes Localization and Activity of Catalase
                                    catalase   (CAT) (Figure 5G). Additionally, a strong fluorescent signal,
indicating
     Droughtthe presence     of CAT,
                 stress caused    an was   found
                                      increase   inin
                                                    thethelevel
                                                            drought-stressed
                                                                of hydrogen AZ    cells (Figure
                                                                              peroxide           5C,E) and
                                                                                         in the flower   AZthe  cells
                                                                                                             (Figure
adjacent  to  the vascular    bundles   (Figure   5D).  Soil moisture   had a significant effect on the
5H) and enhanced the activity of catalase (CAT) (Figure 5G). Additionally, a strong fluorescent signal,  diversified
CAT   localization
indicating            in the vascular
             the presence     of CAT, wasbundles,
                                              found asinwell.
                                                           the The  inside of the vascular
                                                               drought-stressed              bundle cells
                                                                                  AZ cells (Figure   5C,E)from
                                                                                                            and the
                                                                                                                 the
drought-stressed
cells adjacent to floral     AZs wasbundles
                      the vascular      completely    filled5D).
                                                 (Figure     withSoil
                                                                   CAT   (Figure 5F),
                                                                       moisture   hadwhile   traces ofeffect
                                                                                       a significant   fluorescence
                                                                                                              on the
were  observed
diversified   CAT inlocalization
                      the control AZ    (Figure
                                   in the        5A) bundles,
                                           vascular   and the nearby
                                                                 as well.vascular bundles
                                                                           The inside of the(Figure 5B).bundle cells
                                                                                              vascular
from the drought-stressed floral AZs was completely filled with CAT (Figure 5F), while traces of
fluorescence were observed in the control AZ (Figure 5A) and the nearby vascular bundles (Figure
5B).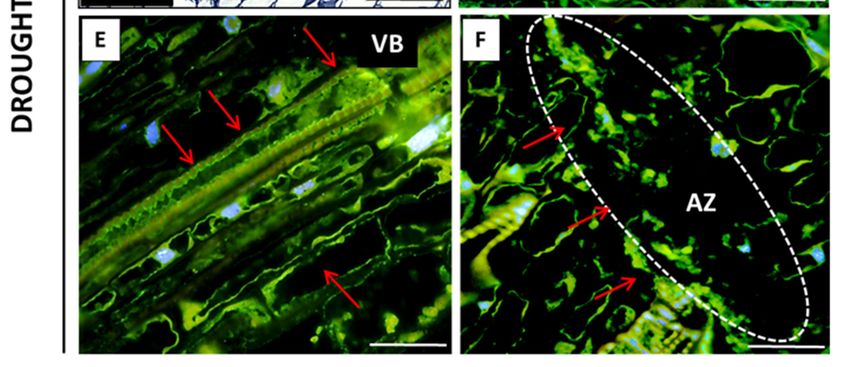
Int. J. Mol. Sci. 2019, 20, 3731 7 of 23
Int. J. Mol. Sci. 2018, 19, x FOR PEER REVIEW 7 of 23
Figure
Figure 5.5. Immunolocalization
Immunolocalization of catalase (CAT) in the floral floral abscission
abscission zone (AZ)
(AZ) ofof yellow
yellow lupine
lupine
grown
grown in in drought
drought conditions
conditions (C–F)
(C–F) and
and in
in the
the AZ
AZ ofof control
control plants
plants (A,B).
(A,B). The
The AZs
AZs were
were excised
excised on on
the 48th day of development. Control plants were cultivated under optimal
the 48th day of development. Control plants were cultivated under optimal soil conditions (70% soil conditions (70%
WHC).
WHC). Stressed
Stressed plants
plants were
were subjected
subjectedto to drought
drought forfor 22 weeks
weeks (25%
(25% WHC).
WHC). TheThe AZ
AZ region
region is is indicated
indicated
by white curves (A,C). The presence of CAT is highlighted by red arrows. Image
by white curves (A,C). The presence of CAT is highlighted by red arrows. Image E is magnified C. E is magnified C.
Nearby
Nearby cells
cells to
to vascular
vascular bundles
bundles (D).(D). Magnified
Magnified vascular
vascular bundles
bundles (B,F).
(B,F). Nuclei
Nuclei were
were stained
stained with
with
DAPI. Abbreviations: PROX—stem fragments below the AZ, DIST—flower
DAPI. Abbreviations: PROX—stem fragments below the AZ, DIST—flower pedicel fragments above pedicel fragments above
the
the AZ,
AZ, VB—vascular
VB—vascular bundles. Scale bars:
bundles. Scale bars: 100
100 µm (A,C), 60
µm (A,C), 60 µm (D,F), 40
µm (D,F), 40 µm (B,E). CAT
µm (B,E). CAT activity
activity (G)(G)
and
and hydrogen peroxide (H22O22) concentration (H) in the floral AZ of yellow lupine grown in
hydrogen peroxide (H O ) concentration (H) in the floral AZ of yellow lupine grown in drought
drought
conditions
conditions andand inin the
the AZ
AZ ofof control
control plants. Data are
plants. Data are presented
presented as averages ±± SE.
as averages SE. For
For CAT
CAT activity,
activity,
significant
significantdifferences
differencesininstressed
stressed plants
plantsin in
comparison
comparison to control plants
to control are indicated
plants as **as
are indicated p
Int. J. Mol.
        Int. J.Sci.
                Mol.  Sci. 20,
                    2019,      3731
                           2018, 19, x FOR PEER REVIEW                                                            8 of 238 of 23

      Figure 6. LlZEP expression (related to LlACT) (A) and endogenous content of abscisic acid (ABA) in
             Figure 6. LlZEP expression (related to LlACT) (A) and endogenous content of abscisic acid (ABA) in
      floral abscission zone (AZ) of Lupinus luteus grown under drought conditions. Control plants were
             floral abscission zone (AZ) of Lupinus luteus grown under drought conditions. Control plants were
      growing in soil of optimal moisture (70% WHC). In parallel, part of plants was subjected to drought
             growing in soil of optimal moisture (70% WHC). In parallel, part of plants was subjected to drought
      for 2 weeks (25% WHC). For analysis, AZs were harvested on the 48th and 51st days of cultivation.
             for 2 weeks (25% WHC). For analysis, AZs were harvested on the 48th and 51st days of cultivation.
      Data are presented as averages ± SE. For LlZEP expression, significant differences in stressed plants in
             Data are presented as averages ± SE. For LlZEP expression, significant differences in stressed plants
      comparison to control plants are indicated as ** p < 0.01, significant differences in 51-day-old control
             in comparison to control plants are indicated as ** p < 0.01, significant differences in 51-day-old control
      plants in comparison to 48-day-old plants are indicated as aa p < 0.01, and significant differences in
             plants in comparison to 48-day-old plants are indicated as aa p < 0.01, and significant   differences in 51-
      51-day-old stressed plants in comparison to 48-day-old stressed plant are indicated as b p < 0.05. For
             day-old stressed plants in comparison to 48-day-old stressed plant are indicated as b p < 0.05. For ABA
      ABA content, significant differences in the stressed plants in comparison to control plants are indicated
             content, significant differences in the stressed plants in comparison to control plants are indicated as
      as ** p < 0.01, significant differences in 51-day-old control plants in comparison to 48-day-old plants
             ** p < 0.01, significant differences in 51-day-old control plants in comparison to 48-day-old plants are
      are indicated as aa p < 0.01, and significant differences in 51-day-old stressed plants in comparison to
             indicated as aa p < 0.01, and significantb differences in 51-day-old stressed plants in comparison to 48-
      48-day-old stressed plants are indicated as p < 0.05 (Student’s t-test).
             day-old stressed plants are indicated as b p < 0.05 (Student’s t-test).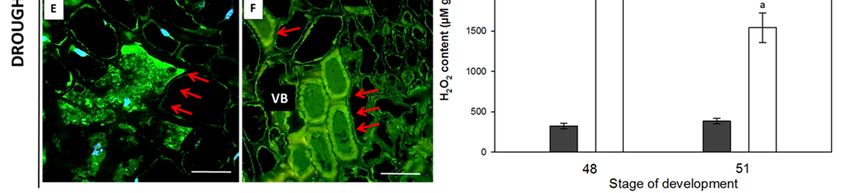
Int. J. Mol. Sci. 2018, 19, x FOR PEER REVIEW                                                                              9 of 23
Int. J. Mol. Sci. 2019, 20, 3731                                                                                           9 of 23

      Figure 7. Tissue and subcellular localization of abscisic acid (ABA) in the abscission zone (AZ) of
       Figure luteus
      Lupinus  7. Tissue    and subcellular
                      flowers                  localization
                                  grown in drought           of abscisic
                                                       conditions  (D–F)acid
                                                                          and(ABA)
                                                                                in the in
                                                                                       AZtheof abscission
                                                                                               control plantszone(B).
                                                                                                                    (AZ)
                                                                                                                      Theof
       Lupinus  luteus  flowers    grown   in drought   conditions  (D–F)  and   in the  AZ  of control
      AZs were excised on the 48th day of development. Control plants were cultivated under optimal soil   plants  (B).  The
       AZs   were excised    on  the 48th day   of development.   Control  plants  were  cultivated
      conditions (70% WHC). Part of plants was subjected to drought conditions for 2 weeks (25% WHC).   under  optimal   soil
       conditions
      The          (70%
           AZ regions   areWHC).    Partby
                              indicated  of white
                                             plantscurves
                                                    was subjected   to presence
                                                           (D,F). The  drought ofconditions
                                                                                    ABA (D–F) for is2 highlighted
                                                                                                       weeks (25% by WHC).
                                                                                                                        red
       The   AZ regions   are  indicated  by  white  curves (D,F). The  presence   of ABA  (D–F)     is
      arrows. Image F is magnified D region. Image E corresponds to the vascular bundles’ area. DAPI washighlighted  by  red
       arrows.  Image   F  is magnified   D  region.  Image  E corresponds   to the vascular  bundles’
      used for nuclei staining. The examined regions of AZs used for the immunofluorescence studies are    area. DAPI    was
       used for by
      indicated  nuclei
                    red staining.    The examined
                         squares (A,C).               regionsPROX—stem
                                           Abbreviations:      of AZs usedfragments
                                                                            for the immunofluorescence          studies are
                                                                                        below the AZ, DIST—flower
       indicated
      pedicel     by red above
              fragments     squares  (A,C).
                                   the       Abbreviations:
                                       AZ, VB—vascular        PROX—stem
                                                            bundles.         fragments
                                                                      Scale bars:  100 µm below  the AZ,
                                                                                           (A,C,D),     60 µmDIST—flower
                                                                                                               (B), 40 µm
       pedicel fragments above the AZ, VB—vascular bundles. Scale bars: 100 µm (A,C,D), 60 µm (B), 40 µm
      (E,F).
       (E,F).
    A similar tendency was observed for the expression of LlACS and LlACO, and the level of
ACC. A  similar
      The valuestendency   was observed
                  of the examined        for theincreased
                                   parameters     expression
                                                           in of
                                                              AZLlACS
                                                                  duringand  LlACO,
                                                                           lupine     and the level
                                                                                   development       of ACC.
                                                                                                  (Figure  8).
 The values
Drought      of the
         caused      examined
                 strong,        parameters
                         16-times            increased inactivity
                                  higher transcriptional    AZ during     lupine
                                                                   of LlACS        development
                                                                               in the             (Figure 8).
                                                                                      flower AZ harvested
 Drought
from      caused plants
     48-day-old   strong,(Figure
                          16-times  higher
                                 8A).  The transcriptional
                                           expression wasactivity    of LlACS
                                                             maintained         in the flower
                                                                           at a similarly  highAZ  harvested
                                                                                                level in the
 from 48-day-old   plants (Figure 8A).  The expression   was  maintained    at a similarly  high
subsequent stage, as well. The ACC content in the AZ of the stressed plants was almost two-times level  in the
 subsequent
higher       stage,
       than in      as well.(Figure
               the control   The ACC8B).content  in the AZ
                                         ET precursor   wasofstrongly
                                                               the stressed   plants was
                                                                       accumulated         almost
                                                                                        on day 51. two-times
                                                                                                    An over
Int. J. Mol. Sci. 2019, 20, 3731                                                                                                               10 of 23

five-time increase in the LlACO mRNA content as compared to the control plants was observed in
the floral AZs of the 48-day-old plants cultivated under soil drought conditions (Figure 8C). Slightly
larger transcript accumulation                 was found in the subsequent time-variant, while
                      Int. J. Mol. Sci. 2018, 19, x FOR PEER REVIEW                                                          10 of 23
                                                                                                                                      in the control AZs
of 48-day-old plants the LlACO mRNA content was almost 50% lower than in the 51-day-old ones.
                      higher than in the control (Figure 8B). ET precursor was strongly accumulated on day 51. An over
Interestingly, the mRNA
                      five-timecontent
                                    increase in   oftheLlACO
                                                         LlACO mRNAwascontent
                                                                         lower       than that
                                                                                as compared        of LlACO
                                                                                            to the control plants wasinobserved
                                                                                                                         all ofinthe studied variants
                      the floral AZs of the 48-day-old plants cultivated under soil drought conditions (Figure 8C). Slightly
(Figure 9A,C). Soil drought
                      larger transcript  stress        caused
                                              accumulation         ACC
                                                              was found      accumulation
                                                                        in the                      inwhile
                                                                               subsequent time-variant,  theinAZ       cells
                                                                                                                 the control AZs(Figure
                                                                                                                                   of       9E), vascular
bundles (Figure 9D–F),        andplants
                      48-day-old         the the   neighboring         cells
                                                      LlACO mRNA content     was(Figure
                                                                                   almost 50%9F).
                                                                                              lower On
                                                                                                     than inthe   cellularones.
                                                                                                              the 51-day-old     level, the signal was
                      Interestingly, the mRNA content of LlACO was lower than that of LlACO in all of the studied variants
observed within the cytoplasm.
                      (Figure 9A,C). SoilTraces              of fluorescence
                                                   drought stress                     in theinAZ
                                                                  caused ACC accumulation            cells,
                                                                                                the AZ         indicating
                                                                                                        cells (Figure             the presence of ACC,
                                                                                                                      9E), vascular
                      bundles (Figure 9D–F), and the neighboring cells (Figure 9F). On the cellular level, the signal was
were also found in the    inactive             AZs      (Figure     9B).
                      observed within the cytoplasm. Traces of fluorescence in the AZ cells, indicating the presence of ACC,
                                were also found in the inactive AZs (Figure 9B).

       Figure 8. Expression analysis        of ethylene
                              Figure 8. Expression              (ET) (ET)
                                                   analysis of ethylene biosynthesis       genes,
                                                                           biosynthesis genes,         LlACS
                                                                                               LlACS (A),         (A),
                                                                                                          and LlACO       and LlACO (C), (related
                                                                                                                     (C), (related
                              to LlACT) and endogenous level of ET precursor-ACC in floral abscission zone (AZ) of Lupinus luteus
       to LlACT) and endogenous level of ET precursor-ACC in floral abscission zone (AZ) of Lupinus luteus
       grown under drought conditions. Control plants were cultivated in soil of optimal moisture (70%
       WHC). Part of plants was subjected to drought conditions for 2 weeks (25% WHC). AZs were harvested
       on the 48th and 51st days of cultivation. Data are presented as averages ± SE. For LlACS expression,
       significant differences in stressed plants in comparison to control plants are indicated as ** p < 0.01, and
       significant differences in 51-day-old control plants in comparison to 48-day-old plants are indicated as
       a p < 0.05. For LlACO expression, significant differences in stressed plants in comparison to control

       plants are indicated as ** p < 0.01, significant differences in 51-day-old control plants in comparison to
       48-day-old plants are indicated as aa p < 0.01, and significant differences in 51-day-old stressed plants
       in comparison to 48-day-old stressed plant are indicated as b p < 0.05. For ACC content, significant
       differences in stressed plants in comparison to control plants are indicated as ** p < 0.01, significant
       differences in 51-day-old control plants in comparison to 48-day-old plants are indicated as aa p < 0.01,
       and significant differences in 51-day-old stressed plants in comparison to 48-day-old stressed plant are
       indicated as b p < 0.05 (Student’s t-test).
plants in comparison to 48-day-old plants are indicated as aa p < 0.01, and significant differences in 51-
day-old stressed plants in comparison to 48-day-old stressed plant are indicated as b p < 0.05. For ACC
content, significant differences in stressed plants in comparison to control plants are indicated as ** p
< 0.01, significant differences in 51-day-old control plants in comparison to 48-day-old plants are
indicated as aa p < 0.01, and significant differences in 51-day-old stressed plants in comparison to 48-
Int. J. Mol. Sci. 2019, 20, 3731 11 of 23
day-old stressed plant are indicated as b p < 0.05 (Student’s t-test).
Figure 9. Immunolocalization of ethylene precursor, ACC, in the floral abscission zone (AZ) of yellow
Figuregrown
lupine 9. Immunolocalization of ethylene
in drought conditions precursor,
(D, E, F) ACC,
and in the in control
AZ of the floral abscission
plants (B). Thezone
AZs(AZ)
wereofexcised
yellow
lupine
on grown
the 48th dayinof
drought conditions
development. (D, E,plants
Control F) and were
in thecultivated
AZ of control plants
under (B). The
optimal soilAZs were excised
conditions (70%
on the part
WHC), 48th of
day of development.
plants was subjected Control plants
to drought were cultivated
conditions under(25%
for 2 weeks optimal
WHC).soilThe
conditions
AZ region(70%
is
highlighted by white curves (E). The presence of ACC is indicated by red arrows. D and F correspondis
WHC), part of plants was subjected to drought conditions for 2 weeks (25% WHC). The AZ region
highlighted
to by white
vascular bundle curves
areas. (E). The
Nuclei were presence
stainedofwith
ACCDAPI.
is indicated by redregions
The studied arrows.of D AZs
and Fused
correspond
for the
immunofluorescence studies are marked by red squares (A,C). Abbreviations: PROX—stem fragments
below the AZ, DIST—flower pedicel fragments above the AZ, VB—vascular bundles. Scale bars: 100
µm (A,C), 60 µm (D,E), 40 µm (B,F).
3. Discussion
Drought leads to marked changes in the systemic level. The reduction in the number of leaves
and their area limit transpiration and is one of the protective mechanisms adopted by plants. This
effect has not only been observed in L. luteus (Supplementary Figure S8A,B), but also in Abies alba,
Picea abies, Fagus sylvatica, and oak [12]. Soil drought leading to water deficit in the cells causes
the stomata closure, which—together with disturbed photosynthesis—generates oxidative stress.
H2 O2 accumulation triggered by this stressor has been shown to occur in Nicotiana tabacum, Citrus,
Oryza sativa, Pisum sativum, and Gossypium hirsutum [13,14]. Oxidative burst leads to damage onInt. J. Mol. Sci. 2019, 20, 3731 12 of 23
different organizational levels, e.g., chlorophyll degradation and disruption of the photosynthetic
apparatus [15]. In yellow lupine, drought stress causes a reduction in the value of the Fv/Fm parameter
(Supplementary Figure S8C) that describes the maximum quantum yield of photosystem II. A similar
tendency has been observed during drought-stimulated leaf abscission in Manihot esculenta [16].
Photo-oxidation in Portulaca oleracea, Phaseolus vulgaris, and Carthamus tinctorius leads to a reduction in
chlorophyll concentration and photosynthetic activity [17,18]. Analyses of Pinus banksiana seedlings
have shown that the value of these parameters can be increased by applying ABA [19]. Yellow lupine
cultivation under soil drought conditions leads to reduced leaf moisture (Supplementary Figure S9)
and significantly changes leaf contents of Fe, K, P, Zn, Na, and S (Supplementary Figures S10 and
S11). A decreasing level of iron, which is a component of cytochromes and ferredoxin, may lead to
the disturbance of electron transport during photophosphorylation and in the respiratory chain. The
deficiency of iron, an element of CAT and peroxidase, weakens the activity of antioxidant enzymes,
limits plant growth, and, consequently, reduces yielding [20–24]. Iron deficiency may evoke a similar
effect in lupine, which belongs to the same group as Glycine max for which high iron concentrations
have been proven to increase yielding [25–27]. The disturbed water management observed in yellow
lupine may be associated with its decreased amounts of potassium (Supplementary Figure S10),
which regulates stomata closure and affects plasmalemma and tonoplast permeability. Reduction in
potassium content contributes to lower yielding [28], while the reduction in phosphorus concentration
(Supplementary Figure S10) may have a negative impact on photosynthesis, respiration, the function
of cytoplasmic membranes, and resistance to stress. This is confirmed by research on Phoebe zhennan,
which has shown phosphorus to stimulate a protective response to drought [29]. The zinc content
variations observed in the leaves of older lupines (Supplementary Figure S11) may be associated with
their reduced leaf area (Supplementary Figure S8). As for the reduction in sodium content in the leaves
(Supplementary Figure S11), it may worsen cellular colloid hydration, and thus have a negative impact
on water management. Similarly to zinc, sulfur content variations caused by drought stress have only
been observed in the leaves of 51-day-old plants (Supplementary Figure S11). The results of studies
performed by Abuelsoud et al. [30] have proven sulfur’s role in the protective response and have
pointed to increased sulfur demand during drought stress.
The Fabaceae family, among them yellow lupine, are particularly sensitive to water deficits during
flowering and pod setting. Yellow lupine flower separation occurs in the AZ located at the base of
their pedicels [31]. The formation of this structure does not guarantee that the organ will separate,
as it needs to be activated first, which is most often triggered by a combination of both endogenous
and biotic or abiotic exogenous factors [4,32–35]. We showed that soil drought stress decreases AZ
water content (Figure 1A), which may act as a signal for AZ activation. The results of our previous
analyses indicated that the cells of a naturally active yellow lupine floral AZ underwent intensive
divisions and were characterized by formation of new daughter cell walls, numerous plasmodesmata,
vesicles, tiny aggregates, and large nuclei; whereas the observed changes pointed to the occurrence
of the synthesis and transport of molecules that are responsible for ensuring cellular communication
within the AZ and involved in early organ separation stages [11]. In this paper, we show that on
the cellular level, soil drought stress causes changes (Figure 2E–H) that are similar to those found
in naturally active AZs [11]. Resulting from middle lamella dissolution, tissue integrity is lost and
continuity interrupted (Figure 2E,F), while the cells contain numerous grains, indicating high metabolic
activity and AZ activation (Figure 2H), which is also reflected in an enhanced flower abortion rate
after drought (Figure 1B). Following a reaction with Coomassie, an increased level of proteins was
observed (Figure 2G,H) which, as other authors have suggested, must be synthesized de novo if organ
abscission is to take place [35,36].
The anatomical and physiological symptoms occurring in the AZ are genetically controlled. It has
been shown for A. thaliana, Litchi chinensis, and Citrus that AZ activation is controlled by the IDA and/or
IDA-like genes [9,37–41]. IDA overexpression stimulates AZ cellular divisions, the excretion of large
amounts of arabinogalactan, and premature organ separation, whereas ida mutants do not abscise theirInt. J. Mol. Sci. 2019, 20, 3731 13 of 23
organs despite possessing well-developed AZs [37,42]. In L. luteus, progressive degradation processes
in naturally active AZs are accompanied by LlIDL mRNA accumulation [11]. In our current study, we
have shown that drought causes LlIDL transcript accumulation (Figure 3A). Additionally, this stress
factor leads to an increase in the mRNA content of the newly-characterized LlHSL gene (Figure 3B).
In A. thaliana, proline has been identified within the EPIP domain as undergoing post-translational
modification to hydroxyproline and forming a covalent bond with glutathione at position 266 of the
HAE/HSL2 receptor [43]. The ligand IDA binds with the extracellular part of the HAE/HSL2 receptor
and triggers the pathway leading to AZ activation [10,44]. The predicted amino acid sequence of LlHSL
(Supplementary Figure S6) indicates that LlHSL cDNA encodes a receptor serine/threonine kinase
located within the cell membrane. Within the LlHSL LEUCINE-RICH REPEAT RECEPTOR-LIKE
KINASE PROTEIN (LRR-RLK) is found that is responsible for protein-protein interactions. Moreover,
the central part of the domain contains an aspartic acid residue which is of significance to the enzyme’s
catalytic activity (Supplementary Figure S6). The LlIDL and LlHSL transcriptional activity patterns
in yellow lupine floral AZs suggest that flower abscission may be activated by LlIDL within the
LlHSL-triggering pathway. It confirms that the IDA–HAE/HSL mechanism is highly conserved in
plants [45–47]. Research on other plant species has shown that the HAE/HSL mRNA content may be
stimulated by ABA [48,49]. The positive feedback loop between HAE/HSL and AGAMOUS-like 15
(AGL15) has also been reported [9,44,49]. By inactivating the transcription of the AGL15 abscission
repressor, the IDA–HAE/HSL complex-triggered MAPK cascade in the AZ and stimulate HAE/HSL
expression [49,50]. In L. luteus, the elevated LlIDL and LlHSL transcriptional activity are accompanied
by a high LlMPK6 mRNA content (Figure 3C) and MPK6 accumulation in the pedicel vascular bundles
and the AZ cells (Figure 4C,D,E). This suggests that MPK6 participates in AZ activation. In A. thaliana,
the flowers of the ida or hae and hsl2 mutants demonstrate decreased MPK6 activity, suggesting that it
acts downstream [9]. Flower abscission correlated with increased expression of LeMPK2, a homolog of
AtMPK6, has been observed in Solanum lycopersicum [51]. In summary, the LlIDL, LlHSL, and LlMPK6
transcriptional activity patterns in the AZ show that the identified genes may encode succeeding
elements of the pathway, regulating the time of flower separation. These processes are accompanied by
oxidative stress conditions. Reactive oxygen species (ROS) have been shown multiple times to play an
important role in cell wall modification processes occurring within the AZ. ROS cause hydrolysis of the
polysaccharides of cell walls, and by generating local redox potential they affect the permeability and
remodeling of plasmodesmata [52]. We previously indicated that AZ cells accumulate ROS following
flower abscission in yellow lupine [6]. The appearance of ROS calls for a well-functioning antioxidative
system including, inter alia, CAT responsible for H2 O2 dismutation. In yellow lupine, drought changes
H2 O2 concentration (Figure 5H), increases CAT activity (Figure 5G), and affects the localization of
this enzyme within selected areas of the AZ (Figure 5C–F)—which confirms the existence of stressful
conditions and indicates modifications in the redox balance. Water deficit triggers a pathway in which
MKK1-MPK6 modulate ABA-dependent CAT1 expression in A. thaliana [53,54]. Furthermore, analyses
of transcriptomes in Manihot esculenta have shown differential expression of the genes participating in
ROS-induced pathways encoding superoxide dismutases and CAT [16].
One of the earliest metabolic responses of plants to the changing osmotic potential of the cells is
endogenous ABA content increase, which is usually accompanied by higher resistance to stress [55–60].
This correlation has been observed in Zea mays, Capsicum annum, Pinus banksiana, and Tradescantia
virginiana [19,61–69]. On the other hand, in Phaseolus vulgaris, drought stress does not increase the
ABA content, but affects its transport from the symplast to the apoplast [70]. The ABA accumulation
may be the result of elevated transcriptional activity of the gene encoding enzymes involved in its
biosynthesis, e.g., ZEP. It has been shown many times that the expression of this gene is stimulated
by stress factors, including drought [71,72]. In yellow lupine, soil water deficit increases the LlZEP
mRNA content in the AZ (Figure 6A). Our analyses are the first to determine the changes of the
gene’s transcriptional activity in this small fragment of tissue under drought stress, suggesting local
control of ABA biosynthesis and confirming the specificity of small AZ fragments. Most of the formerInt. J. Mol. Sci. 2019, 20, 3731 14 of 23
analyses concentrated on determining the expression of ZEP in particular organs affected by stress,
e.g., the root, the shoot, or the leaves. In N. plumbaginifolia and Solanum lycopersicum, drought has
been shown to increase ZEP transcriptional activity in the roots, while ABA to accumulate not only
in the roots, but also the leaves [71,73]. In Vigna unguiculata, the same stressor has failed to affect the
mRNA content of VuABA1, a gene that encodes zeaxanthin epoxidase; in A. thaliana it causes ZEP
accumulation in the stems and roots, and in Medicago sativa the MsZEP transcript content is lower in
the shoots, while its expression patterns in the roots are diverse [56,74,75]. The results of transcriptomic
analyses in Litchi chinensis have shown a correlation between fruit abscission and elevated expression
of ZEP and the ABA receptor-encoding gene—PYR/PYL (pyrabactin resistance/PYR1-like) [76]. In
yellow lupine, the changes in the transcriptional activity of LlZEP in the AZ of flowers cultivated
under water deficiency conditions are accompanied by increasing content of ABA (Figure 6B), and
by its localization in the AZ cells (Figure 7D–F). In our previous studies, we observed a similar
tendency in naturally active AZs [11]. The mechanism of ABA activity is based on the triggering of the
pathway of kinases involved in cell signaling (e.g., SnRK2, SAPK2) and regulation of the synthesis of
low-molecular-weight hydrophilic and thermolabile protective proteins, such as aquaporins (PIP1,
PIP2), osmotins, or dehydrins, which optimize water binding and improve the ion-selective properties
of the cell membrane [77–81]. Moreover, ABA stimulates the activity of enzymes responsible for the
synthesis of osmoprotectants, such as proline, betaine, and glycine, which protect cell structures from
the effects of dehydration [82].
In our previous research, we have shown that flowering abortion in yellow lupine evoked by ABA
resulted from its stimulatory effect on the expression of the two main ET biosynthesis genes, LlACS and
LlACO, as well as ACC content [5]. Presented qPCR analyses have shown that soil drought stimulates
the transcriptional activity of LlACS in the AZs of yellow lupine flowers (Figure 8A) and elevates the
content of ACC (Figure 8B), which is localized in the AZ (Figure 9). The accompanying high expression
of LlACO (Figure 8C) may indicate that ACC is oxidized to ET, which is the main abscission effector
responsible for activating cell wall hydrolytic enzymes [83,84]. The role of soil drought in regulating
the expression of ACS and ACO, and the production of ACC and ET, has been proven in research on
Citrus reshni [85]. In the root, drought led to the accumulation of ACC, which was then transported
by xylem to the above ground plant parts and oxidized in a reaction catalyzed by ACO to ET. This
effect was not only associated with the increased levels of ET in the tissues, but also a heightened
sensitivity of the cells to that phytohormone caused by the changes in the concentrations of auxins or
ABA [33]. Leaf abscission in citrus evoked by increasing ACC levels was accompanied by elevated
ET production [86]. An important role in regulating the contents of precursors in the individual
organs is played by their translocation. In the cell, ACC can be transported across the tonoplast by
ATP-dependent transporters [87]. On the systemic level, under soil drought conditions, ET precursor
is transported by elements of the vascular bundles, with this mechanism having been thoroughly
described for Solanum lycopersicum and Citrus reshni [85,88]. It has been found, as well, that in Gossypium
hirsutum, ACC can be transported by the phloem [89]. It appears that ACC may be one element of
long-distance pathways triggered in response to drought stress [90]. Thus, there exist two possible
interpretations of the results obtained for yellow lupine. ACC either plays the role of a signaling
molecule in generating the plant’s response to water deficit, or—in an ACO-catalyzed reaction—it
enables the formation of ET which, by regulating the expression of genes encoding hydrolytic enzymes,
leads to AZ activation.
Our study provides information about several new potential markers of early response to water
loss, which can help elucidate the mechanisms controlling plant response to drought, and forms a
useful basis for breeders and agronomists to enhance crop tolerance to stress. Based on our results, we
have proposed a floral AZ activation model for L. luteus (Figure 10).ACC either plays the role of a signaling molecule in generating the plant’s response to water deficit,
or—in an ACO-catalyzed reaction—it enables the formation of ET which, by regulating the
expression of genes encoding hydrolytic enzymes, leads to AZ activation.
Our study provides information about several new potential markers of early response to water
loss, which can help elucidate the mechanisms controlling plant response to drought, and forms a
Int. J. Mol. Sci. 2019, 20, 3731 15 of 23
useful basis for breeders and agronomists to enhance crop tolerance to stress. Based on our results,
we have proposed a floral AZ activation model for L. luteus (Figure 10).
Figure10.
Figure 10.Hypothetical
Hypotheticalmodel
modelof offloral
floralabscission
abscissionzone
zonefunctioning
functioningunder
underdrought
droughtstress
stressin
inyellow
yellow
lupine.The
lupine. Theprecise
precisedescription
descriptionisisin
inthe
thetext.
text.
4.4.Materials
Materialsand
andMethods
Methods
4.1.
4.1.Plant
PlantMaterial
MaterialandandGrowth
GrowthConditions
Conditions
Lupinus
Lupinusluteus
luteus(L.)
(L.)Taper
Tapervariety
variety(2n = 52)
(2n = 52)was used
was in in
used thethe
experiments.
experiments. AllAll
plants were
plants grown
were in
grown
phytotron chambers
in phytotron in controlled
chambers conditions,
in controlled which have
conditions, been optimized
which have beenand describedand
optimized previously by
described
Frankowski et al. [31]. The lupines (200 plants) were watered for five weeks in optimal
previously by Frankowski et al. [31]. The lupines (200 plants) were watered for five weeks in optimal70% soil water
holding
70% soilcapacity (WHC);capacity
water holding subsequently,
(WHC); part of them (100 part
subsequently, plants) were (100
of them grown for two
plants) weeks
were in the
grown for25%
two
WHC. For calculating WHC, the modified method of Chauhan and Johnson (2011)
weeks in the 25% WHC. For calculating WHC, the modified method of Chauhan and Johnson (2011) was used [91]. The
pots
was(11
usedL)[91].
containing
The potssoil
(11material were saturated
L) containing withwere
soil material tap water. Thewith
saturated pot surface wasThe
tap water. then
potcovered
surface
with a plastic container and the pots were allowed to drain for 48 h. Thereafter, from
was then covered with a plastic container and the pots were allowed to drain for 48 h. Thereafter, the middle of
each
frompot,
thethree soil samples
middle of each (each ~500 g)
pot, three were
soil taken. (each
samples These~500
samples were weighed
g) were (wet weight
taken. These samplesofwere
soil,
A), oven-dried (90 ◦ C for 72 h), and reweighed (dry weight of soil, B). The WHC was then calculated
weighed (wet weight of soil, A), oven-dried (90 °C for 72 h), and reweighed (dry weight of soil, B).
using the formula:
The WHC was then [(A-B) × 100]/B.
calculated using the formula: [(A-B) × 100]/B.
4.2. Sample Harvest
4.2. Sample Harvest
The plant material for analysis was selected after 48 and 51 days of plant growth in soil with
The plant material for analysis was selected after 48 and 51 days of plant growth in soil with
optimal moisture (70% WHC) and from drought conditions (25% WHC). The flower pedicels and
optimal moisture (70% WHC) and from drought conditions (25% WHC). The flower pedicels and
stem fragments (~2 mm thickness only) containing abscission zone (AZ) (Supplementary Figure S1)
stem fragments (~2 mm thickness only) containing abscission zone (AZ) (Supplementary Figure S1)
were used as the experimental material. AZ sections of stressed and unstressed plants were dissected
were used as the experimental material. AZ sections of stressed and unstressed plants were dissected
using a razor blade under a binocular microscope (Supplementary Figure S2A,B). We applied the
using a razor blade under a binocular microscope (Supplementary Figure S2A,B). We applied the
methodology previously described by Frankowski et al. [7]. For the purpose of expression and gas
chromatography mass spectrometry (GC-MS), analyses tissues (0.2 g or 0.5 g, respectively) were frozen
in liquid nitrogen and stored at −80 ◦ C until use, while for histological and immunocytochemical
studies, 15 AZs from each variant were immediately fixed. In turn, 2 g of leaves (Supplementary
Figure S2C,D) for Inductively Coupled Plasma—Optical Emission Spectrometers (ICP-OES) studies
were sampled and dried at 60 ◦ C for 24 h.You can also read