MONITORING THE INFLUENCE OF SOCIO-ECONOMIC RIGHTS IMPLEMENTATION ON VOTER PREFERENCES IN THE RUN-UP TO THE 2019 NATIONAL GENERAL ELECTIONS - UJ
←
→
Page content transcription
If your browser does not render page correctly, please read the page content below
MONITORING THE
INFLUENCE OF SOCIO-ECONOMIC
   RIGHTS IMPLEMENTATION ON
   VOTER PREFERENCES IN THE
  RUN-UP TO THE 2019 NATIONAL
      GENERAL ELECTIONS
Leila Patel, SA Research Chair in Welfare and Social Development and Director
  of the Centre for Social Development in Africa, University of Johannesburg
     Prof Yolanda Sadie, Professor of Politics, University of Johannesburg
      Megan Bryer, Researcher, Centre for Social Development in Africa,
                        University of Johannesburg
INTRODUCTION
Ake (2000:75) argues that the legitimacy of democracy in Africa depends on how it relates to the social
experiences of people and serves their social needs. Loss of confidence and public trust that democracy
as a system of government will yield these returns could lead to lower levels of participation in elections,
voter apathy, declining trust in political parties and political leadership, unlawful protests and violence, and
disinterest in holding governments accountable.

Despite some declines in participation in elections over the past twenty years in South Africa, three quarters
of poor people in a CSDA study (Patel et al 2014:6; Sadie, Patel and Baldry 2016; Ismail and Ulriksen 2017) had
voted in previous elections because it would ‘make things better’ and ‘because it is their democratic right’. Seven
out of ten respondents participated in local government ward meetings because it would bring about community
change. While most respondents (90%) had knowledge of their democratic right to health care, food and water,
education, adequate housing and social security (i.e. social grants for persons with disabilities, older persons
and children), a third were less sure that these rights would be protected should another political party win the
elections. Social grants had some influence on how poor people voted, but party identification, party loyalty,
rational-choice reasons for voting, beliefs about the protection of rights, ratings of government performance
and perceptions of corruption were significant predictors of voting behaviour in two poor urban communities in
Gauteng and one rural community in Limpopo. Although this research was the first on the voting behaviour of
poor voters, it was restricted to three communities only, which limited the generalisability of the results.

Service-delivery failures have been cited as the reason for loss of confidence in the ruling party from an
all-time high of 70% in 2004 to 54% in the 2016 local government elections. Across various social sectors,
capability failures in the delivery of rights-based services and entitlements, political interference in the
administration, allegations of corruption in the award of tenders, disregard for the rule of law and failure
of leadership are cited as underlying the loss of confidence in the ruling party. As the election is drawing
nearer, service-delivery protests are increasing in local communities in a context of high joblessness, a lack of
economic growth and the rising cost of food and daily necessities. Significant leadership changes occurred in
the governing party at the end of 2017, which may also have an impact on voter preferences. These factors,
coupled with increasing electoral competition, suggest that the 2019 national general election is likely to be a
watershed election for democracy in South Africa.

If a shift is indeed occurring away from party loyalty and party identification as the main factors influencing
voter preferences, it is likely that the implementation of socio-economic policies that will lead to real
improvements in people’s lives will feature more prominently in voter preferences. In light of this scenario, we
pose the following question: to what extent are government performance in the delivery of socio-economic
rights, perceptions of corruption and issues of governance likely to influence voter preferences in the run-up
to the 2019 national general elections? For the purpose of the study, we look specifically at the effect of social
grant receipt, an important aspect of socio-economic rights implementation in view of South Africa’s very high
coverage of cash transfers and the constitutional right to social assistance.

AIM OF THE RESEARCH
The aim is to monitor how socio-economic rights are likely to shape voting behaviour in a constitutional
democracy and in an upper middle-income country that has a fairly well-developed welfare system. The
findings could contribute to dialogue and public engagement with stakeholders on issues of social policy
implementation, ethical governance and the importance of participation in elections to safeguard the quality
and the legitimacy of democracy (see Schultz-Herzenberg & Southall 2014).

RESEARCH PLANS
Three national cross-sectional surveys were planned for the period October 2017 to October 2019. The first
wave of data was collected in October 2017 and is referred to as Wave 1 in this research brief. The findings
emerge from a random and nationally representative sample of 3447 potential voters. Ipsos Public Affairs, a
marketing research company, collected the data on behalf of the CSDA. The sample consisted of metropolitan
and rural areas stratified in terms of age, gender and ethnicity. Six survey questions supplied by the CSDA
were included in Ipsos’s Khayabus survey, which is conducted between October and November each year. The
data was analysed by the research team with statistical support provided by Jaclyn de Klerk from STATCON at
the University of the Johannesburg.

                                                         2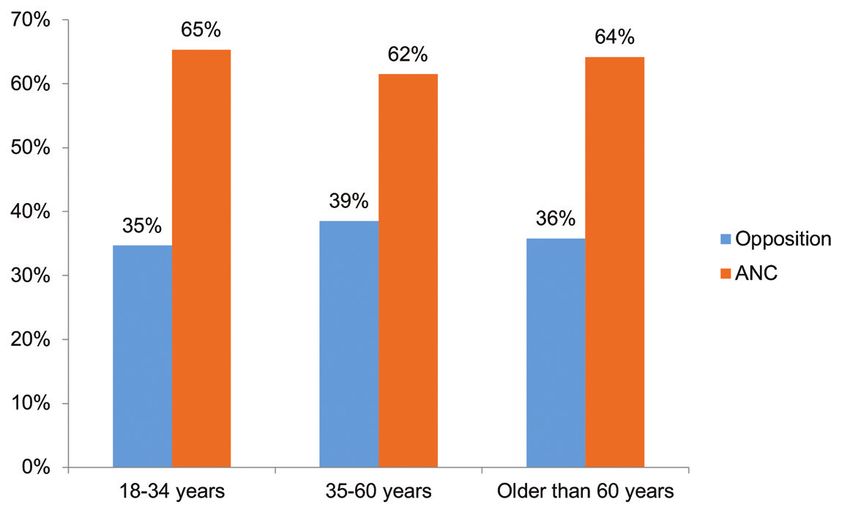
The second study conducted in October 2018 and again at the same time in 2019 after the national general
elections should yield valuable results on the trends and factors influencing voter preferences and choices over
a three-year period.

Results: Wave 1, 2017
PROFILE OF PARTICIPANTS
Our sample included 3390 respondents. Of the total, 75% reside in urban areas and 25% in rural areas.
This corresponds with the national urban–rural split.1 There was an equal percentage of male and female
respondents. Most respondents were aged between 18 and 34 years (49%), with 43% aged between 35 and
59 years, while 7% were older than 60 years. Of the total, 75% of respondents were black, 11% coloured,
11% white and 3% Indian/Asian. Most respondents were working (49%) as opposed to not working (19%) or
unemployed2 (32%).

Respondents in the sample were largely poor and fell into the lower middle-income bands. Of all the
respondents, 53% earned less than R8 000 as their total monthly income.3 38% of the respondents refused to
answer. Only 6% of respondents earned more than R10 000 per month.

Regarding education, 50% of respondents have Grade 12 as the highest level of education; 28% have
secondary school as the highest level; 4% have primary school. 4% of respondents have an artisan’s
certificate; 6% have a technikon diploma and only 4% have a university degree.

Table 1: Highest level of education received

                                                                                                    Percent
    1 - No schooling                                                                                   0,7
    2 - Some primary school                                                                            2,2
    3 - Primary school completed                                                                       3,9
    4 - Some high school                                                                               28,4
    5 - Matric / Grade 12                                                                              50,2
    6 - Artisan’s certificate obtained                                                                 3,9
    7 - Technikon diploma/degree completed                                                             6,3
    8 - University degree completed                                                                    3,5
    9 - Professional                                                                                   0,4
    10 - Technical                                                                                     0,4
    11 - Secretarial                                                                                   0,2
    Total                                                                                             100,0

REASONS FOR VOTER PREFERENCES
When asked which party they would vote for in the next election, most respondents said the African National
Congress (ANC) (53%), followed by the Democratic Alliance (DA) (22%) and the Economic Freedom Fighters
(EFF) (6%). 5% of respondents said that they would not vote and 6% refused to answer. The most common
reason that respondents in the full sample of 3 447 gave for supporting a party was that they trust the party
(37%), followed by the party brought freedom and democracy to South Africa (35%), that they believed the party
would bring a better life (32%), and that the party is for everyone (28%). Employment status, the age of the
respondent, whether they lived in an urban or a rural area and the gender of the respondent did not affect the
three main reasons selected for why they voted for a particular party.

1
 StatsSA, 2015. Findings of the Living Conditions Survey 2014/15. [Online] Available at http://www.statssa.gov.za/publications/Re-
port-03-10-02%20/Report-03-10-02%202015.pdf
2
    Includes unemployed looking for work and unemployed not looking for work.
3
    Total personal monthly income before tax and deductions, including salaries, pensions, income from investments, grants etc.

                                                                      3
Asked whether they receive any grant from the government, 23,9% of respondents answered “Yes”.
Interestingly, 14,6% of all respondents said that one of the reasons they voted for a particular party was
because they “receive a government grant and are afraid that another party will not give [them] a grant”. Of
the respondents who receive a grant from government, 25% gave this as their reason for their party choice.

DO VOTERS VALUE DEMOCRATIC RIGHTS OR SOCIO-ECONOMIC
WELL-BEING?
When asked which they consider to be more important: democratic rights or socio-economic well-being,
44,6% said socio-economic well-being, while 42,9% considered democratic rights to be more important.

          Figure 1: What is more important to you, democratic rights vs. socio-economic well-being?

DO VOTERS TRUST IN INSTITUTIONS?
Trust in institutions is mostly favourable, with the majority of respondents saying that they are very likely or
extremely likely to trust in all institutions, with the exception of the presidency (under President Jacob Zuma in
October 2017, when the survey was conducted). 56% were not at all likely or not very likely to trust the former
president. Lower levels of trust were also expressed for the South African Police Service and Parliament, at
45% respectively, compared to those who expressed some trust in these institutions.

                       Figure 2: How likely are you to trust in the following institutions?

                                                        4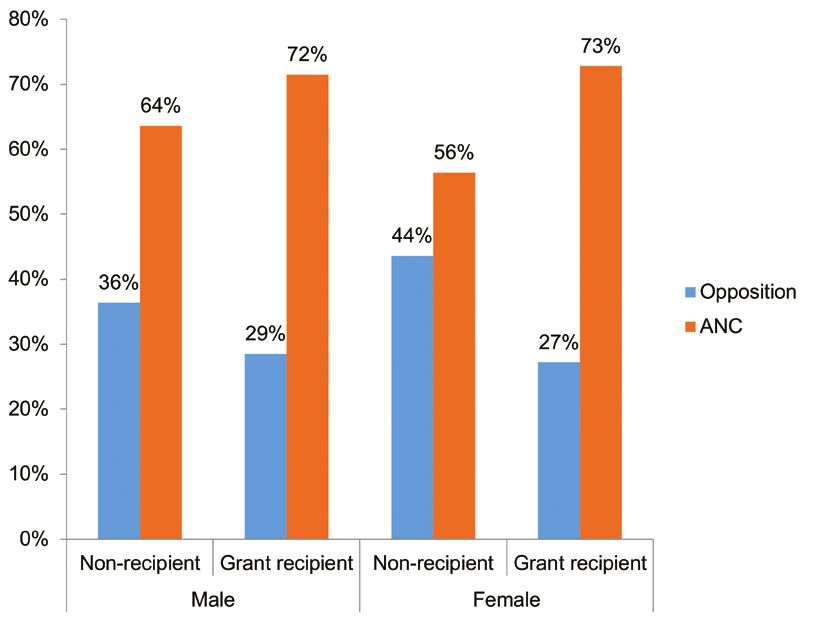
DO VOTERS THINK CORRUPTION IS INCREASING?
The vast majority of respondents (76%) held the view that corruption had increased between 2014 and 2017.

Figure 3: Do you think that corruption has increased in South Africa since three years ago, that is, since 2014?

WHICH FACTORS ARE LIKELY TO MATTER IN VOTER PREFERENCES?
Exploratory factor analysis is a statistical procedure used to determine which factors are likely to influence
voter choices. The procedure followed is described briefly, and the results are then presented.

EXPLORATORY FACTOR ANALYSIS PROCEDURE
To measure perception of governance (trust in institutions) among the respondents, we constructed a variable
by calculating the average score across all seven questions that measure a respondent’s trust in institutions.
We conducted a factor analysis to test whether the set of questions about trust in institutions can be used to
provide a composite indication of trust levels.

The question asks respondents “… how much [do] you trust each institution, would you say that you are 1 – Not at all
likely to, 2 – Not very likely to, 3 – Neither likely nor unlikely to, 4 – Very likely to, or 5 – Extremely likely to …

•     Trust the Presidency (President Jacob Zuma)
•     Trust the Courts
•     Trust the Department of Social Development
•     Trust Parliament
•     Trust the South African Police
•     Trust the Media
•     Trust SASSA (SA Social Security Agency)?”

No reverse scoring was necessary, since all questions measure trust on a spectrum from Not at All Likely to
trust in the institution through to Extremely Likely to trust in the institution.

We then used the Kaiser-Meyer-Oklin Measure of Sampling Adequacy to check whether the items were
suitable for factor analysis. The Kaiser-Meyer-Oklin value measured 0,9, exceeding the recommended
value of 0,6 (Kaiser 1974) and Bartlett’s Test of Sphericity (Bartlett 1954) reached statistical significance. The
result supported the factorability of the correlation matrix. Inspection of the correlation matrix revealed the
presence of coefficients of 0,3 and above.

We checked for weak items using the anti-image correlation test. All items had MSA4 values above 0,6,
and therefore it was not necessary to remove any item from the factors constructed. We expected the
communalities at extraction test. Low values (less than 0,3) could indicate that the item does not fit well with
the other items in its component. Despite a low score for the question on trust in the presidency, this item was
retained, as its MSA value was considered satisfactory.

We found that of the total variance in the model, 58% is explained by the constructed factor for Governance.

4
    Measures of Sampling Adequacy.

                                                           5
We tested the reliability of the items in measuring trust in institutions using Cronbach’s Alpha, which measured
0,873. According to Pavot, Diener, Colvin and Sandvik (1991) there is good internal consistency with a Cronbach
alpha coefficient reported of at least 0,85. This factor is therefore a reliable measure of trust in institutions
(which we term here “governance”).

DOES SOCIAL GRANT RECEIPT MATTER IN VOTER PREFERENCES?
We compared respondents who received a grant from the government to those who did not. We tested
whether the receipt of a grant impacted the respondents’ choice of party – voting for the ANC or an
opposition party. Of the respondents who received a grant from the government, 73% said that they would
vote ANC, while 27% said that they would vote for an opposition party.5 Of the respondents who did not
receive any government grant, 61% said they would vote ANC, while 39% said that they would vote for an
opposition party.

                        Figure 4: Comparison of grant recipients vs. non-recipients in voting choice

Using Fisher’s Exact Test, we show that there is a statistically significant difference between grant recipients
and non-recipients in terms of voter choice. The Fisher’s Exact Test p-value is 0,000. Those who received a
grant were more likely to vote for the ANC than those who did not. The magnitude of the effect, however, is
small. The phi coefficient value is 0,107. This is considered small using Cohen’s (1988) criteria of 0,10 for small
effect; 0,30 for medium effect; and 0,50 for large effect. Both recipients and non-recipients were more likely to
vote for the ANC than for an opposition party.

We did the same test to compare male and female respondents, disaggregated into grant recipients and non-
recipients, in terms of voter choice. In our sample, 151 males receive a grant (compared to 1235 non-recipients)
and 534 females receive a grant (compared to 880 non-recipients). For males, 64% of non-recipients vote
ANC, whereas 72% of grant recipients vote ANC. For females, 56% of non-recipients vote ANC compared to
73% of grant recipients.

       Figure 5: Comparison of male vs. female grant recipients and non-recipients, in terms of voter choice

5
    We exclude from the analysis respondents who said they will not vote or refused to disclose voting party choice.

                                                                       6
We found no statistically significant difference between male grant recipients and non-recipients in voter
choice; Fisher’s Exact Test p-value measured 0,059. But for females, there was a statistically significant
difference between grant recipients and non-recipients in terms of voter choice; Fisher’s Exact Test p-value
measured 0,000 for female recipients and non-recipients. Again, the magnitude of the effect is small, with the
phi coefficient value measuring 0,165.
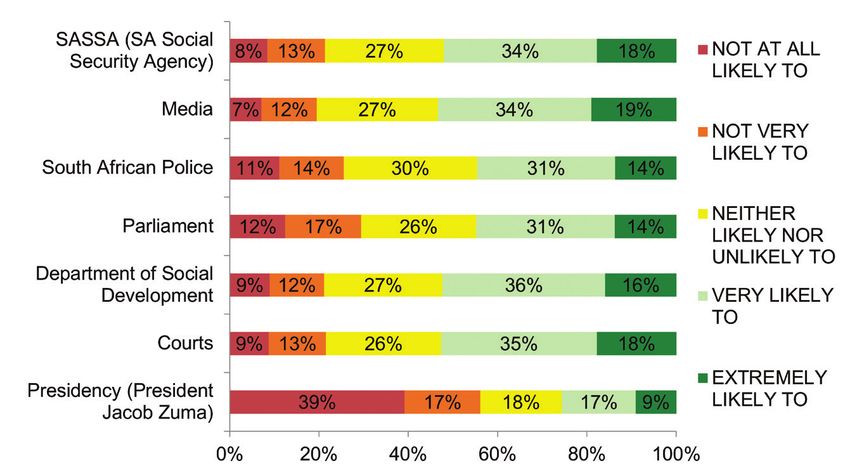
DOES AGE MATTER IN VOTER PREFERENCES?
Next we compared whether there was a statistically significant difference in how the respondents of different
age groups voted. We compared three age groups: 18-34 years, 35-60 years and older than 60 years. In the
youngest group, 65% vote ANC. In the middle-aged group, 62% vote ANC. In the oldest group, 64% vote ANC.
We found no statistically significant difference in terms of voting choice of ANC or opposition party across the
three age groups.
Figure 6: Comparison of young, middle-aged and old respondents in voter choice
THE PREDICTIVE VALUE OF OUR MODEL
We used a logistic regression as a predictive analysis to test the impact of three constructed independent
variables – perception of the importance of socio-economic rights protection, perception of governance, and
perception of corruption – on the likelihood that a respondent would vote for the ANC or an opposition party.
We constructed the independent variables as follows:
Perception of governance: We assigned an average score to each respondent such that scores range from 1
to 5 (Not at all likely to Extremely likely to trust in institutions), for the question “… how much [do] you trust each
institution, would you say that you are 1 – Not at all likely to, 2 – Not very likely to, 3 – Neither likely nor unlikely to, 4 –
Very likely to, or 5 – Extremely likely to …
• Trust the Presidency (President Jacob Zuma)
• Trust the Courts
• Trust the Department of Social Development
• Trust Parliament
• Trust the South African Police
• Trust the Media
• Trust SASSA (SA Social Security Agency)?”
Perception of the importance of socio-economic rights protection: Using the question “which ONE is closest
to your opinion, even if you don’t fully agree, please choose one that is most important to you: (i) Democratic rights like
voting, access to courts, freedom of speech and expression or (ii) Socio-economic well-being, meeting your basic needs,
jobs, income, housing etc.”, we assigned 1 if socio-economic well-being (statement 2) was more important.
Perception of corruption: Using the question “There is a lot of talk about corruption in our country. Do you think that
corruption has increased in South Africa since three years ago, that is, since 2014?”, we assigned a value of 1 if the
respondent answered Yes, and 0 if the respondent answered No.
7Our dependent variable we set as 1 if respondents said that they would vote for the ANC in the next election,
and 0 if they said that they would vote for an opposition party. We excluded those who refused to answer or
indicated that they would not vote.
We included variables to control for: age, race, income level, urban versus rural, gender, work status, education
level, grant recipient versus non-recipient and whether recipients answered that their reason for party choice
was that they received a grant from the government which they feared they would not receive if another party
took power.
We tested for multicollinearity to confirm that the correlation between independent variables in the model
was not too high. We measured VIF (variance inflation factor) and tolerance. Tolerance measures how much
variability of the specified independent variable is not explained by the other independent variables in the
model. Tolerance is measured between 0 and 1, with values closer to 1 showing the absence of collinearity
concerns. VIF is the inverse of the tolerance value. The VIF values examined were close to 1, which is
acceptable. We were satisfied that there were no concerns of collinearity in our model and that the regression
coefficients rendered below were indeed the factors that were the likely predictors of voter preferences.
Table 2: Coefficientsa
Coefficientsa
Collinearity Statistics
Model Tolerance VIF
1 Governance 0,893 1,120
SocEcRights 0,983 1,018
Corruption 0,972 1,029
Age 0,768 1,302
White 0,862 1,160
IndAsian 0,961 1,041
Coloured 0,940 1,064
Income 0,469 2,131
Area 0,870 1,149
NotWorking 0,665 1,503
Unemployed 0,508 1,967
Education 0,738 1,354
Gender 0,891 1,122
Grant 0,673 1,485
Fear of Loss of Grant 0,923 1,083
a. Dependent Variable: Vote
Table 3: Model summary shows the results for the R-square test to test the usefulness of the model. We used
Cox & Snell R Square and Nagelkerke R Square values to assess the amount of variation in the dependent
variable that is explained by the model. The R-square value measured 0,274 using the Cox & Snell test and
0,381 using the Nagelkerke test. This suggests that between 27,4% and 38,1% of the variability in voting choice
is explained by the set of variables in the model.
8Table 3: Model summary
Step -2 Log likelihood Cox & Snell R Square Nagelkerke R Square
1 1516.909a 0,274 0,381
a. Estimation terminated at iteration number 5 because parameter estimates changed by less than .001.
Model Summary
Step -2 Log likelihood Cox & Snell R Square Nagelkerke R Square
1 1516.909a 0,274 0,381
a. Estimation terminated at iteration number 5 because parameter estimates changed by less than .001.
Table 4: Variables in the equation below show the results from the logistic regression, which tells us about the
contribution or importance of each of the predictor variables. 1794 cases were excluded from our analysis due
to missing data. The analysis was therefore conducted on 1596 cases.
FINDINGS OF THE REGRESSION MODEL
Perception of governance, perception of socio-economic rights protection and perception of corruption are
all shown to be significant in determining whether a respondent votes for the ANC or an opposition party.
Age, race, education, gender and whether respondents said they voted for a particular party because they
received a grant and were afraid the grant would not be provided by another party in power were all shown to
be statistically significant. Receipt of a grant from government was not found to contribute significantly to the
model.
Table 4: Variables in the equation
95% C.I.for EXP(B)
B S.E. Wald df Sig. Exp(B) Lower Upper
Step 1 a
Governance 0,335 0,071 22,067 1 0,000 1,398 1,216 1,608
SocEcRights -0,493 0,130 14,271 1 0,000 0,611 0,473 0,789
Corruption -0,595 0,176 11,389 1 0,001 0,552 0,391 0,779
Age 0,015 0,006 7,660 1 0,006 1,015 1,004 1,027
White -3,143 0,270 135,046 1 0,000 0,043 0,025 0,073
IndAsian -2,783 0,451 38,093 1 0,000 0,062 0,026 0,150
Coloured -2,348 0,227 107,242 1 0,000 0,096 0,061 0,149
Income -0,001 0,011 0,017 1 0,897 0,999 0,976 1,021
Area -0,178 0,165 1,173 1 0,279 0,837 0,606 1,155
NotWorking -0,205 0,211 0,945 1 0,331 0,814 0,538 1,232
Unemployed -0,087 0,196 0,200 1 0,655 0,916 0,624 1,345
Education -0,184 0,068 7,338 1 0,007 0,832 0,728 0,950
Gender -0,285 0,136 4,372 1 0,037 0,752 0,576 0,982
Grant 0,065 0,181 0,128 1 0,721 1,067 0,749 1,520
Fear of Loss of 0,987 0,227 18,896 1 0,000 2,684 1,720 4,190
Grant
Constant 1,909 0,631 9,148 1 0,002 6,744
a. Variable(s) entered on step 1: Governance, SocEcRights, Corruption, Age, White, IndAsian, Coloured,
rIncome, rArea, NotWorking, Unemployed, Education, Gender, rGrant, QUJ101.
9The higher the perception of governance (i.e. the higher the trust in institutions a respondent held) the more
likely the respondent would be to vote for the ANC. The odds of a respondent voting for the ANC increase by a
factor of 1,398 for each additional unit of trust in institutions the respondent held, all other factors being equal.
Respondents who said socio-economic well-being was more important than democratic rights were less
likely to vote for the ANC. The odds of a respondent voting for the ANC decreased by a factor of 0,611 if the
respondent considered socio-economic well-being more important than democratic rights, all other factors
being equal.
Respondents who believed that corruption had increased in the last three years (since 2014) were less likely to
vote for the ANC than those who did not believe corruption had increased. The odds of a respondent voting
for the ANC decreased by a factor of 0,552 if the respondent believed that corruption had increased in the
past three years (since 2014), all other factors being equal.
For each additional year in age, the odds of a respondent voting for the ANC increased by a factor of 1,015, all
other factors being equal.
Compared to black respondents, the odds of a white respondent voting for the ANC, decreased by a factor of
0,043. Compared to black respondents, the odds of an Indian/Asian respondent voting for the ANC decreased
by a factor of 0,062, and the odds of a coloured respondent voting for the ANC decreased by a factor of
0,096, all other factors being equal.
Female respondents are less likely than male respondents to vote for the ANC in the next election. The odds
of a female respondent voting for the ANC decreased by a factor of 0,752 compared to male respondents, all
other factors being equal.
For respondents who said that the reason they voted for a particular party was because they received a grant
from government and feared that this grant would not be paid if they voted for another party, the odds of voting
for the ANC increased by a factor of 2,526 compared to those who cited another reason for their party choice.
When we reran the model including an additional variable to indicate whether recipients answered that their
reason for party choice was that they believed the party “brought freedom and democracy”, we found that this
variable was not significant in the logistic regression. We therefore do not include this variation of the model
in the analysis. The reason the additional variable is not statistically significant may be explained by the
design of the question, which did not specifically test party identification as a reason for voter choice. Instead,
respondents were asked an open-ended question on the reason for party choice and answers were coded
according to the respondents’ unprompted response.
CONCLUSIONS
The first wave of data collected towards the end of 2017 occurred at the height of the leadership contestation
in the governing party and amid public outcry about state capture, corruption and the downgrade in the
investment status of the country. The study shows that key shifts are indeed occurring in voter preferences
that could influence the political landscape of the country. First is that support continued to decline for the
ANC to 53%. Should this trend continue, and should support for the ANC fall below 50%, it is unlikely that the
two opposition parties with significant electoral support will achieve a majority. This will pave the way for the
emergence of a coalition government as early as 2019.
Second, the reasons for voter choice are beginning to shift. Trust in the party emerged as the main reason
for voting for a particular political party (37%). Although the reason for choosing a party on the basis that it
brought freedom and democracy was still important to prospective voters (35%), the likelihood that a party
will bring a better life was a close third (32%). Also important to some voters (28%) is how inclusive a party is
for some voters. These reasons for party preference were not affected by the employment status, age, gender
and the urban/rural location of potential voters.
Third, although 86% of all respondents did not think that receipt of a social grant mattered in their voting
preferences, this was not the case for social grant beneficiaries. A quarter of social grant beneficiaries
indicated that fears that they could lose their social grants if they voted for another party were influential in
their choices.
10Fourth, our regression model included a range of factors that were likely predictors of the voting preferences
of voters in Wave 1. The most significant predictors were related to their perception of (a) governance, (b)
socio-economic rights protection, and (c) corruption. These factors were all highly significant in determining
whether a respondent votes for the ANC or for an opposition party. Voters who have a negative perception
of governance and corruption were more likely to vote for the opposition. Perceived weaknesses in protecting
socio-economic rights due to a lack of jobs, income and poor housing delivery were less likely to influence
voting for the governing party. Furthermore, factors such as age, race, education, gender and whether
respondents said that they voted for a particular party because they received a grant and were afraid they
would lose their grant if another party came to power were all shown to be statistically significant in the
analysis model of the study. However, receipt of a social grant in itself was not found to contribute significantly
to the model.
Finally, female respondents are less likely than male respondents to vote for the ANC in the next election.
The odds of a female respondent voting for the ANC decreased by a factor of 0,752 compared to male
respondents.
We conclude that while voter preferences are still driven by support for the party of liberation, other factors
are becoming increasingly important as we move closer to the 2019 national general elections. These factors
are socio-economic rights protection and implementation, trust in government institutions, trust in the
president of the country, issues of governance and the perception of increased corruption. Female voters
appeared to be more discerning in the exercise of their electoral choices. Determining why this is the case
would require further research.
The second wave of the study is in progress and these trends will be assessed over time using the same
statistical procedures in the model. Since many changes have occurred since the Wave 1 survey data was
collected, the Wave 2 study will provide insight into the effects of these changes on voter preferences. For
instance, will the leadership changes in the governing party and the presidency, including efforts to expose
corruption, lead to changes in voter preferences? We find support for Ake’s (2000) thesis that people’s electoral
choices and participation in elections are influenced by the potential of democracies to meet their needs and
are shaped by their real-life experiences.
REFERENCES
Ake, C. (2000). The Feasibility of Democracy in Africa. Senegal: CODESRIA
Bartlett, M.S. (1954). A note on the multiplying factors for various chi-square approximations. Journal of the
Royal Statistical Society.16:296–298.
Cohen, J. (1988). Statistical power analysis for the behavioral sciences. 2nd.
Ismail, Z. and Ulriksen, M. (2017). Social Assistance and electoral choice: A citizen’s perspective In Patel, L. and
Ulriksen (Ed), (2017). Development, Social Policy and Community Action. Cape Town: HSRC Press
Kaiser, H. (1974) An index of factorial simplicity. Psychometrika. 39:31–36.
Pallant, J. F. (2007). SPSS survival manual: A step-by-step guide to data analysis with SPSS. New York, NY:
McGrath Hill.
Patel, L., Sadie, Y. Graham, V., Delany, A. & Baldry, K. (2014). Voting Behaviour and the Influence of Social
Protection. Johannesburg: CSDA, University of Johannesburg. www.uj.ac.za/csda
Pavot, W., Diener, E. D., Colvin, C. R., & Sandvik, E. (1991). Further validation of the Satisfaction with Life Scale:
Evidence for the cross-method convergence of well-being measures. Journal of personality assessment, 57(1),
149-161.
Sadie, Y., Patel, L. & Baldry, K. (2016). ‘A Comparative Case Study of the Voting Behaviour of Poor People in
Three Selected South African Communities’. Journal of African Elections, 15(1): 113-138.
Schultz-Herzenberg, C. & Southall, R. (2014). “The party system and political prospects in the wake of election
2014” in Schulz-Herzenberg. C. & Southhall, R. (eds). Election 2014. Johannesburg: Jacana Media and Konrad
Adenauer Foundation.
11You can also read