Monthly Discussion on Seasonal Climate Outlooks (No. 54) - (24 August 2018) Tokyo Climate Center (TCC) Japan Meteorological Agency (JMA)
←
→
Page content transcription
If your browser does not render page correctly, please read the page content below
Monthly Discussion on
Seasonal Climate Outlooks (No. 54)
         (24 August 2018)

     Tokyo Climate Center (TCC)
 Japan Meteorological Agency (JMA)

                                     1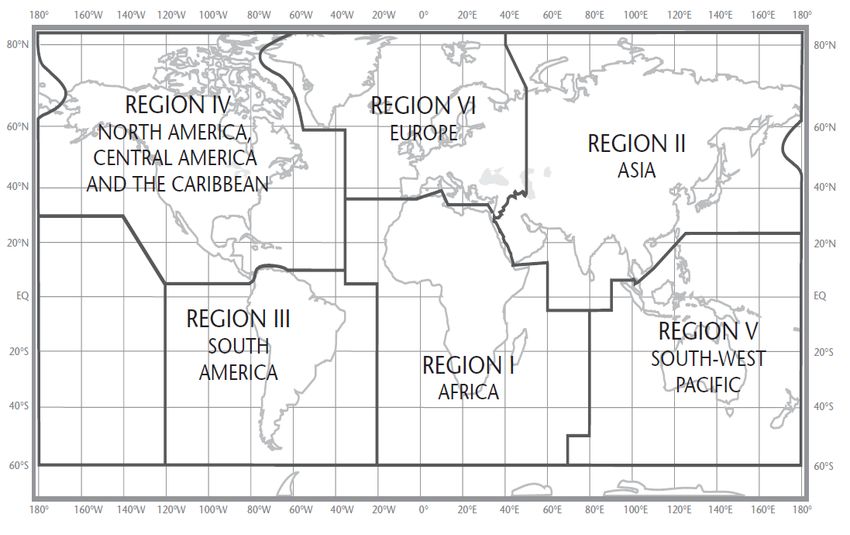
Outline
1. Summary and Discussion
2. Latest State of the Climate System (July 2018)
3. Three-month Predictions (Sep. – Nov. 2018)
Explanatory Notes

 Notes:
 • The present monthly discussion is intended to assist National Meteorological and
   Hydrological Services (NMHSs) in WMO RA II (Asia) in interpreting GPC Tokyo’s
   seasonal prediction products. It does not constitute an official forecast for any nation.
   Seasonal outlooks for individual countries should be obtained from the relevant NMHS.
 • Seasonal predictions are based on a JMA’s Seasonal Ensemble Prediction System (EPS),
   which is based on the coupled atmosphere-ocean general circulation model (CGCM).
 • JMA provides three-month prediction products around the 20th of every month with
   warm-season (Jun. – Aug.) prediction products in February, March and April, and with
   cold-season (Dec. – Feb.) prediction products in September and October.
                                                                                               2
1. Summary and Discussion
ENSO
• ENSO-neutral conditions persisted in July.
• It is likely that ENSO-neutral conditions will persist in boreal summer (70%).
• It is more likely (60%) that El Niño conditions will develop in boreal autumn than that
  ENSO-neutral conditions will persist until boreal autumn (40%).

Prediction for September-October-November 2018 (SON 2018)
• In the upper troposphere, large-scale divergence anomalies are predicted over the central-
  to-eastern part of the North Pacific, while large-scale convergence anomalies are predicted
  from the eastern Indian Ocean to the western tropical Pacific.
• A high probability of above-normal precipitation is predicted over the western tropical
  Indian Ocean. A high probability of below-normal precipitation is predicted in and around
  the South China Sea and over the southeastern tropical Indian Ocean.
• A high probability of above-normal temperatures is predicted over the Middle East and in
  40ºN latitude band east of mainland Japan.

                                                                                                3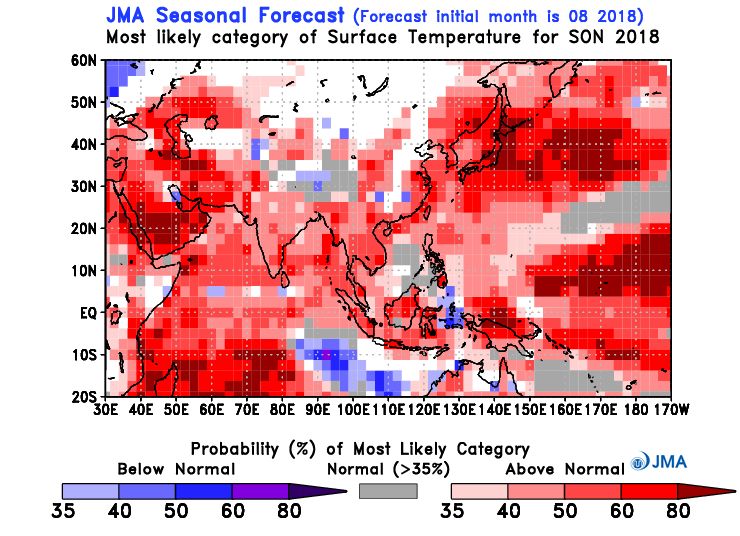
2. Latest State of the Climate System
  July 2018

                                        4
Extreme Climate Events
Type Area Type Area
1 Heavy Rain In and around western Japan 9 Heavy Rain Northern Nigeria
2 Warm From eastern Japan to central China 10 Heat Wave Southeastern Canada
3 Wet In and around eastern Mongolia From southwestern Canada to the central part of
11 Warm
4 Warm In and around Malaysia Central America
5 Heavy Rain 12 Dry From the northwestern to central part of Central
India
America
6 Warm In and around the southern part of Central Asia 13 Dry In and around eastern Brazil
7 Dry Central Europe 14 Wet In and around eastern Argentina
8 Warm From northern Europe to the northwestern part of
Northern Africa
https://ds.data.jma.go.jp/tcc/tcc/products/climate/monthly/index.html 5Temperature
• Temperatures were above normal from eastern Japan to central China, in and around the southern part of Central Asia,
from northern Europe to the northwestern part of Northern Africa, over southeastern Canada, and from southwestern
Canada to the central part of Central America.
• Temperatures were below normal in the Central Siberia, and the southern part of South America.
Normalized anomaly of monthly mean temperature
https://ds.data.jma.go.jp/tcc/tcc/products/climate/climfig/?tm=monthly 6Precipitation
• Precipitation amounts were above normal in and around eastern Mongolia, in and around the northern part of Southeast
Asia, and in and around the eastern Europe.
• Precipitation amounts were below normal over the central Europe, from the northwestern to central part of Central
America, and in and around eastern Brazil.
Monthly precipitation ratio
https://ds.data.jma.go.jp/tcc/tcc/products/climate/climfig/?tm=monthly 7Sea Surface Temperature (SST)
• In the equatorial Pacific, remarkably positive SST anomalies were observed in the western part.
• In the North Pacific, remarkably positive SST anomalies were observed from the area near 5ºN, 155ºE to
the western coast of Central America, and from east of Japan to south of Alaska.
• In the Indian Ocean, remarkably positive SST anomalies were observed from the area near 30ºS, 60ºE to
the area near 15ºS, 100ºE, and in the area near Madagascar.
Monthly mean SST anomaly (˚C)
https://ds.data.jma.go.jp/tcc/tcc/products/elnino/ocean/sst-ano-global_tcc.html 8ENSO Monitoring Indices
• ENSO-neutral conditions persisted in
July.
• The NINO.3 SST was near normal with
a deviation of +0.3˚C.
• The Southern Oscillation Index (SOI)
NINO.3
value was +0.2.
• The area-averaged SST in the tropical
western Pacific (NINO.WEST) region
was near normal.
SOI
• The area-averaged SST in the tropical
Indian Ocean (IOBW) region was near
normal.
NINO.WEST
IOBW
Monthly values (thin lines) and five-month running means (thick lines). The shading indicates El Niño (red) and La Niña (blue) events.
< El Niño Monitoring and Outlook> https://ds.data.jma.go.jp/tcc/tcc/products/elnino/elmonout.html 9Convective activity in the Tropics • Convective activity was enhanced from the Philippines to the latitudinal bands from 10ºN to 20ºN of the central part of the North Pacific, and was suppressed over the Indian Ocean and from the eastern part of East Asia to the seas east of Japan. Monthly mean OLR anomalies Shading: OLR anomalies (W/m2) Monthly mean Velocity potential, Divergent wind vector, and Velocity potential anomalies at 200-hPa Contour: velocity potential (106m2/s) Vector: divergent wind vector (m/s) Shading: velocity potential anomalies (106m2/s) “D” and “C” indicate the centers of large-scale divergence and convergence anomalies, respectively. https://ds.data.jma.go.jp/tcc/tcc/products/clisys/figures/db_hist_mon_tcc.html https://ds.data.jma.go.jp/tcc/tcc/products/clisys/anim/anim_tp.html 10
Equatorial Intraseasonal Oscillation
• The active phase of equatorial intraseasonal oscillation propagated eastward with a large amplitude
  over the eastern Maritime Continent in mid-July.

Time-longitude cross section of seven-day running mean
velocity potential anomalies at 200-hPa (5˚S – 5˚N)
                                                                               MJO diagram
          https://ds.data.jma.go.jp/tcc/tcc/products/clisys/mjo/moni_mjo.html                 11
Upper-level Circulation • In the upper troposphere, anticyclonic circulation anomalies were seen over the northeastern part of East Asia, indicating a stronger-than-normal northeastward extension of the Tibetan High which covered a large part of Japan. Cyclonic circulation anomalies were seen over a wide area from the central part of the tropical North Pacific to the tropical North Atlantic. Monthly mean Stream function and its anomalies at 200-hPa Contour: stream function (106m2/s) Shading: stream function anomalies (106m2/s ) “H” and “L” indicate the centers of anti-cyclonic and cyclonic circulations, respectively. Monthly mean Velocity potential, Divergent wind vector and Velocity potential anomalies at 200-hPa Contour: velocity potential (106m2/s) Vector: divergent wind vector (m/s) Shading: velocity potential anomalies (106m2/s) “D” and “C” indicate the centers of large-scale divergence and convergence anomalies, respectively. https://ds.data.jma.go.jp/tcc/tcc/products/clisys/figures/db_hist_mon_tcc.html https://ds.data.jma.go.jp/tcc/tcc/products/clisys/anim/anim_tp.html 12
Low-level Circulation
• In the lower troposphere, cyclonic circulation anomalies were seen from the South China Sea to the seas east of the
  Philippines, associated with active convection from the Philippines to the central part of the North Pacific. Wave trains
  were propagated from there in directions toward north or northeast.
• In the sea level pressure field, positive anomalies were seen from Africa to the Indian Ocean and negative anomalies were
  seen over the equatorial Pacific.

 Monthly mean
 Stream function and
 its anomalies at 850-hPa
 Contour: stream function (106m2/s)
 Shading: stream function anomalies (106m2/s)
 “H” and “L” indicate the centers of anti-cyclonic
 and cyclonic circulations, respectively.

 Monthly mean
 Sea level pressure anomalies
 and
 Surface wind vector anomalies
 Contour&shading: sea level pressure anomalies
 (hPa)
 Vector: surface wind vector anomalies (m/s)
 “H” and “L” indicate the centers of anti-cyclonic
 and cyclonic anomalies, respectively.

    https://ds.data.jma.go.jp/tcc/tcc/products/clisys/figures/db_hist_mon_tcc.html
    https://ds.data.jma.go.jp/tcc/tcc/products/clisys/anim/anim_tp.html                 13
Northern Hemisphere Circulation
• In the 500-hPa height field, the polar vortex in the Northern Hemisphere was stronger than normal. Wave trains were seen
from the eastern part of the North Pacific to the North Atlantic and northern Eurasia, with positive anomalies over northern
Europe and a wide area from East Asia to eastern Canada.
• Temperatures at 850-hPa were above normal around the western coast of North America, eastern Canada, northern Europe,
the Caspian Sea and the eastern part of East Asia, and below normal over the latitudinal band of 30ºN in the dateline of the
North Pacific and the North Atlantic.
• In the sea level pressure field, positive anomalies were seen from northern Europe to Western Siberia, from the North
Pacific via North America to the North Atlantic. Negative anomalies were seen around the Caspian Sea. The extension of
the North Pacific Subtropical High toward mainland Japan was stronger than normal.
Monthly mean Monthly mean Monthly mean
geopotential height temperature sea level pressure
and its anomalies at 500-hPa and its anomalies at 850-hPa and its anomalies
Contour: geopotential height (m) Contour: temperature (˚C) Contour: sea level pressure (hPa)
Shading: geopotential height anomalies (m) Shading: temperature anomalies (˚C) Shading: sea level pressure anomalies (hPa)
https://ds.data.jma.go.jp/tcc/tcc/products/clisys/figures/db_hist_mon_tcc.html 143. Three-month Predictions
September – October – November 2018
(SON 2018)
(Initial date for the Seasonal EPS: 9 August 2018)
15Sea Surface Temperature (SST)
• It is likely that ENSO-neutral conditions will persist in boreal summer (70%).
• It is more likely (60%) that El Niño conditions will develop in boreal autumn than that ENSO-neutral conditions will
persist until boreal autumn (40%).
• It is likely that the NINO.WEST SST will be below normal or near normal until boreal autumn and below normal in
boreal winter.
• It is likely that the IOBW SST will be below normal or near normal until boreal autumn and above normal or near normal
in boreal winter .
Three month mean
Sea surface temperature (SST) ENSO forecast probabilities
Contour: SST (˚C); Shading: SST anomalies.
Outlook of the SST deviation
(a) IOBW (b) NINO.WEST (c) NINO.3
(b) (c)
(a)
Verification based on hindcast (See “Explanatory Notes (2)”
https://ds.data.jma.go.jp/tcc/tcc/products/model/hindcast/CPS2/index.html for the definition of the SST indices.)
https://ds.data.jma.go.jp/tcc/tcc/products/model/hindcast/CPS2/shisu/shisu.html 16Global Circulation • In the 200-hPa velocity potential field, negative (large-scale divergence) anomalies are predicted over the central-to-eastern part of the North Pacific, while positive (large-scale convergence) anomalies are predicted from the eastern Indian Ocean to the western tropical Pacific. • In the 200-hPa stream function field, cyclonic circulation anomalies are predicted in the 20 – 40oN latitude band from Eurasia to the East China Sea, and anti-cyclonic circulation anomalies straddling the equator are predicted in and around the central tropical Pacific. Three month mean 200-hPa velocity potential Contour: 200-hPa velocity potential (106 m2/s) Shading: 200-hPa velocity potential anomalies (106 m2/s) Three month mean 200-hPa stream function Contour: 200-hPa stream function (106 m2/s) Shading: 200-hPa stream function anomalies (106 m2/s) Verification based on hindcast https://ds.data.jma.go.jp/tcc/tcc/products/model/hindcast/CPS2/index.html 17
Asian Circulation
• In the 850-hPa stream function field, cyclonic circulation (a)
  anomalies are predicted in the latitude band of 20oN over
  the North Pacific, and anti-cyclonic circulation anomalies
  are predicted over the tropical South Indian Ocean.
• In the sea level pressure field, negative anomalies are
  predicted in the latitude band of 20oN over the North
  Pacific.
• Above-normal precipitation is predicted east of Mariana
  Islands over the North Pacific, over the western equatorial
                                                                                                              [m/s]
  Pacific, and over the western tropical Indian Ocean. (b)
  Below-normal precipitation is predicted in and around the
  South China Sea and over the southeastern tropical Indian
  Ocean.
  Three month mean
  (a) 850-hPa stream function anomalies
  and wind vector anomalies
  Contour&Shading: 850-hPa stream function anomalies (106 m2/s)
  Vector: wind vector anomalies (m/s)                                     (c)

  (b) sea level pressure and its anomalies
  Contour: sea level pressure (hPa)
  Shading: sea level pressure anomalies (hPa)

  (c) precipitation and its anomalies
  Coutour: precipitation (mm/day)
  Shading: precipitation anomalies (mm/day)
   Verification based on hindcast https://ds.data.jma.go.jp/tcc/tcc/products/model/hindcast/CPS2/index.html    18
Northern Hemisphere circulation • In the 500-hPa height field, positive anomalies are dominantly predicted over the Northern Hemisphere, especially in the 40 – 60oN latitude band from the northeastern East Asia to the west coast of North America, and in and around the Barents Sea. • In the 850-hPa temperature field, positive anomalies are also dominantly predicted over the Northern Hemisphere, especially east of Japan, in and around the west coast of the USA and east of the Greenland. • In the sea level pressure field, negative anomalies are predicted south of 40oN over the North Pacific. Three month mean Three month mean Three month mean geopotential height temperature sea level pressure (SLP) and its anomalies at 500-hPa and its anomalies at 850-hPa and its anomalies Contour: geopotential height (m) Contour: temperature (˚C) Contour: sea level pressure (hPa) Shading: geopotential height anomalies (m) Shading: temperature anomalies (˚C) Shading: sea level pressure anomalies (hPa) Verification based on hindcast https://ds.data.jma.go.jp/tcc/tcc/products/model/hindcast/CPS2/index.html 19
Probability Forecasts (precipitation)
• A high probability of above-normal precipitation is predicted over the western tropical Indian Ocean.
• A high probability of below-normal precipitation is predicted in and around the South China Sea and over
  the southeastern tropical Indian Ocean.

Verification based on hindcast
 https://ds.data.jma.go.jp/tcc/tcc/products/model/probfcst/3-mon/hind/html/skill_reg_3-mon.html
 https://ds.data.jma.go.jp/tcc/tcc/products/model/probfcst/3-mon/hind/html/skill_2d_3-mon.html        20
Probability Forecasts (temperature)
• A high probability of above-normal temperatures is predicted over the Middle East and in 40oN latitude
  band east of mainland Japan.

Verification based on hindcast
 https://ds.data.jma.go.jp/tcc/tcc/products/model/probfcst/3-mon/hind/html/skill_reg_3-mon.html
 https://ds.data.jma.go.jp/tcc/tcc/products/model/probfcst/3-mon/hind/html/skill_2d_3-mon.html      21
Explanatory Notes (1)
Latest state of the climate system
• Extreme climate events and surface climate conditions are based on CLIMAT messages.
  For details, see https://ds.data.jma.go.jp/tcc/tcc/products/climate/index.html
• SST products are based on COBE-SST data.
  For details, see https://ds.data.jma.go.jp/tcc/tcc/products/elnino/index.html
• Atmospheric circulation products are based on JRA-55 data:
 http://jra.kishou.go.jp/JRA-55/index_en.html
 For details, see https://ds.data.jma.go.jp/tcc/tcc/products/clisys/index.html
• The base period for the normal is 1981 – 2010.
Three-month predictions and warm/cold season predictions
• Products are generated using JMA’s seasonal EPS which is based on the CGCM.
  For details, see https://ds.data.jma.go.jp/tcc/tcc/products/model/index.html
• Unless otherwise noted, atmospheric circulation prediction products are based on the
ensemble mean, and anomalies are deviations from the 1981 – 2010 average for hindcasts.

                                            Contact: tcc@met.kishou.go.jp
                                                                                        22
Explanatory Notes (2)
SST monitoring indices (NINO.3, NINO.WEST and IOBW)
• The SST baseline for NINO.3 region (5˚S – 5˚N, 150˚W – 90˚W) is defined as a monthly
average over a sliding 30-year period (e.g., 1988 – 2017 for 2018). The thresholds of
above the baseline, near the baseline, and below the baseline categories are +0.5 and -0.5.
• The SST baselines for the NINO.WEST region (Eq. – 15˚N, 130˚E – 150˚E) and the
IOBW region (20˚S – 20˚N, 40˚E – 100˚E) are defined as linear extrapolations with respect
to a sliding 30-year period in order to remove the effects of significant long-term warming
trends observed in these regions. The thresholds of above the baseline, near the baseline,
and below the baseline categories are +0.15 and -0.15.
Contact: tcc@met.kishou.go.jp
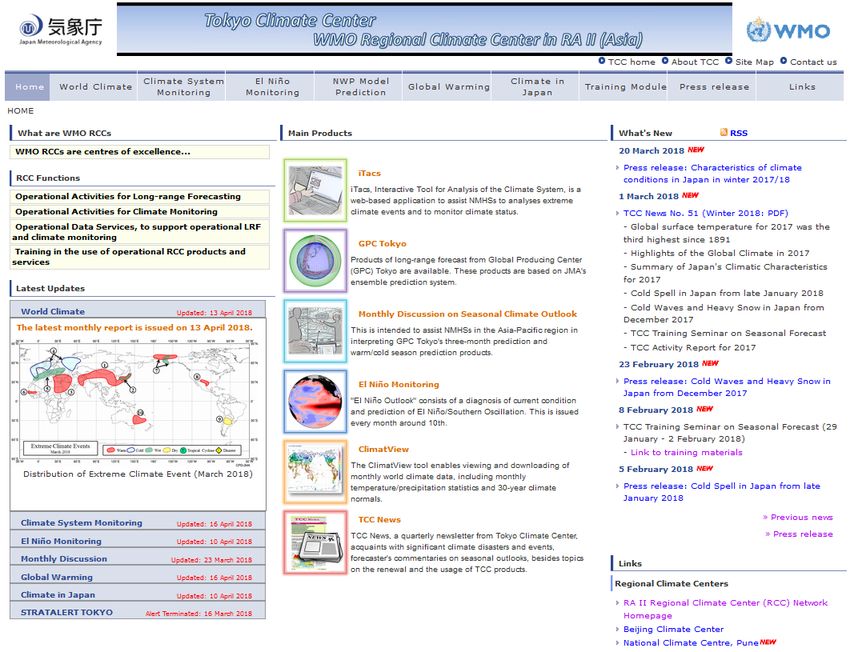
23Names of world regions
24WMO Regional Association regions
Reference: WMO General Regulations
25TCC website https://ds.data.jma.go.jp/tcc/tcc/index.html 26
You can also read